Abstract
Purpose
A novel PEGylated and heparinized magnetic iron oxide nano-platform (DNPH) was synthesized for simultaneous magnetic resonance imaging (MRI) and tumor targeting.
Methods
Starch-coated magnetic iron oxide nanoparticles (“D”) were crosslinked, aminated (DN) and then simultaneously PEGylated and heparinized with different feed ratios of PEG and heparin (DNPH1-4). DNPH products were characterized by Fourier transform infrared spectroscopy (FTIR), transmission electron microscopy (TEM) and superconducting quantum interference device (SQUID). The magentic targeting of DNPH3, with appropriate amounts of conjugated PEG and heparin, in a mouse 9L-glioma subcutaneous tumor model was confirmed by magnetic resonance imaging (MRI)/electron spin resonance (ESR).
Results
DNPH3 showed long circulating properties in vivo (half-life > 8 h, more than 60-fold longer than that of parent D) and low reticuloendothelial system (RES) recognition in liver and spleen. Protamine, a model cationic protein, was efficiently loaded onto DNPH3 with a maxium loading content of 26.4 μg/mg Fe. Magnetic capture of DNPH3 in tumor site with optimized conditions (I.D. of 12 mg/kg, targeting time of 45 min) was up to 29.42 μg Fe/g tissue (12.26% I.D./g tissue).
Conclusion
DNPH3 showed the potential to be used as a platform for cationic proteins for simultaneous tumor targeting and imaging.
Keywords: Magnetic targeting, Iron oxide nanoparticles, Heparin, 9L-glioma, Magnetic resonance imaging
1. INTRODUCTION
The latest annual report of cancer incidence, mortality and survival of American cancer society estimated that about 1.66 million new cancer cases and 0.58 million cancer deaths (1 in 4 total deaths) will occur in USA this year (1). The ever-increasing cancer incidence is attracting more and more concerns about cancer treatment. Despite several decades of effort, cancer is still among the world's top killers. The worldwide incidence of malignant cancers resulted in the extensive utilization of chemotherapeutic agents. However, conventional chemotherapy faces many disadvantages such as poor therapeutic efficacy and severe systemic toxicity due to the low selectivity of small molecule anti-cancer drugs for tumor cells (2). Moreover, adjuvants and sensitizers have to be applied for multi-drug resistant cancer cases.
To overcome these disadvantages, the utilization of macromolecular therapeutics (such as small interfering RNA (siRNA) (3–5) and protein toxins (6–8)) is gaining more and more attraction. These therapeutic macromolecules have unmatched specificity and efficiency for malignant tumor cells with extremely low IC50 (inhibit cellular proliferation by 50%) values (9). Even so, clinical translation of these macromolecular drugs is always a difficult task due to their low bioavailability, poor plasma stability and, most crucially, poor cell internalization. In previous studies, the intra-tumoral uptake of these toxins was successfully improved by functionalization of them with cell-penetrating peptides (CPPs) such as transactivator of transcription (TAT) peptide and low molecular weight protamine (9–10). Nevertheless, these CPP-toxins also face some shortcomings such as poor plasma half-life and severe systemic toxicity (due to the non-specific cell penetrating mechanism of CPP). To overcome these disadvantages, targeted drug delivery systems, which can deliver macromolecular therapeutics specifically to a region of interest, have been intensively developed (11–12). Among these targeted drug delivery strategies, magnetic iron oxide nanoparticle (MNP)-based magnetic targeting is drawing more and more attention (13–14).
MNP, generally composed of a magnetite (Fe3O4) core and a polymeric shell, have been widely utilized for enhanced magnetic tumor targeting and therapy (13). The biocompatible shell and the high magnetic susceptible core enable MNP to be employed as favorable magnetic targeting platforms. Furthermore, the polymeric shell of MNP provides functional groups for additional conjugation, which further extends their applications. MNP-based platforms have been widely used for simultaneous magnetically-enhanced tumor targeting and magnetic resonance imaging (MRI) (13–18). By further heparin functionalization of MNP, we recently demonstrated the attaching of CPP-modified enzyme (β-galactosidase) to the MNP surface via charge interaction between the cationic CPP and the anionic heparin molecule (19). However, intra-arterial administration of heparin-coated MNP via carotid artery was utilized due to its poor plasma half-life (less than 5 min) caused by the extremely high negative charge density on the particle surface. Despite the promising clinical application, intra-arterial administration is one of the least preferable methods in clinical practice. Furthermore, the applied magnetic field (for magnetic targeting) can cause severe MNP aggregation, which will result in significant embolism of the afferent vasculature and further lead to severe neuro-sequelae. With all above-mentioned considerations, the construction of a long-circulating , MNP-based drug delivery system for therapeutic proteins, suitable for theranostic application of malignant tumors, is of the most essential and urgent need (20).
Herein, we demonstrated such a platform in this study. The surface of starch-coated MNP was aminated and then simultaneously modified with 20-KDa PEG chains (for plasma long-circulation and better passive targeting via the enhanced penetration effect (EPR)) (21) and negative heparin (for loading of cationic CPP-modified protein in the future). This starch-coated MNP-based, PEGylated and heparin-functionalized nanoparticle platform (DNPH) thus displayed a long blood circulation time, low reticuloendothelial system (RES) recognition and great accumulation in subcutaneous 9L-glioma tumors with magnetic targeting, indicating the potential application of this DNPH as a protein carrier for simultaneous MRI and drug targeted delivery.
2. MATERIALS AND METHODS
2.1 Materials
The starch-coated magnetite (Fe3O4)-cored nanoparticles fluidMAG-D (“D”) was commercially purchased from Chemicell® GmbH (Berlin, Germany). Iron standard (1000 mg Fe/L) and yittrium internal standard (1000 mg Fe/L) were commercially supplied by GFS Chemicals (Ohio, USA). Methoxyl polyethylene glycol succinimidyl carbonates (mPEG-NHS, 20 kDa) were obtained from JenKem Technology (Texas, USA). Lacey carbon type A copper grids were purchased from Ted Pella (300-mesh, California, USA). Ethanolamine, N-hydroxysuccinimide (NHS), 1-Ethyl-3-(3-dimethylaminopropyl) carbodiimide (EDC), 4-Dimethylaminopyridine (DMAP), Ninhydrin reagent (2%, w/v), 0.1 N iodine solution, epichlorohydrin, concentrated ammonium hydroxide (NH4OH, 30%), azure A dye, dimethylsulfxodide (DMSO), dimethylformamide (DMF), BCA assay kit and heparin sodium salt (from porcine intestinal mucosa, 193 U/mg) were all obtained from Sigma Aldrich (Missouri, USA). All the media (Roswell Park memorial institute (RPMI) medium 1640 and Dulbecco’s Modified Eagle Medium (DMEM)) and reagents (phosphate buffered saline (PBS), ethylenediaminetetraacetic acid disodium salt (EDTA), fetal bovine serum (FBS) and antibiotics for cell culture were all purchased from Invitrogen (California, USA). Rat 9L glioma cell line was obtained from the Brain Tumor Research Center (University of California San Francisco, USA). Deinoized water (DI H2O) for all reactions, solution preparation and sample purification was prepared from a Milli-Q A10 Biocel water purification system (Millipore, USA).
2.2 One-pot synthesis of DNPH
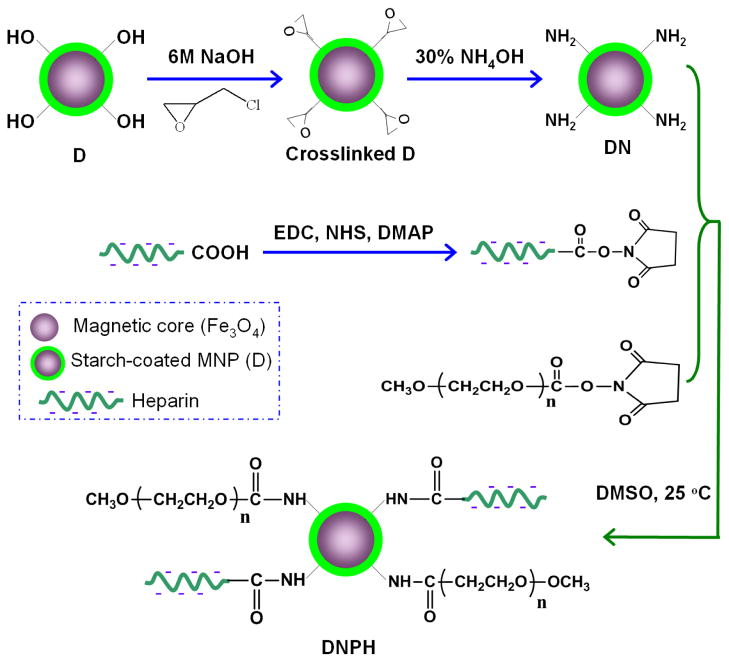
As previously described (22–23), aminated MNP (DN) were synthesized by crosslinking and aminating the coating starch on D nanoparticles via epichlorohydrin and concentrated ammonium hydroxide (30%, w/v), respectively (Figure 1).
Fig 1.
One-pot synthesis strategy of DNPH.
After that, the simple N-hydroxysuccinimide (NHS) chemistry was then employed for the PEGylation and heparin conjugation of DN using one-pot synthesis (PEGylation and heparin conjugation at the same time, Figure 1). Briefly, 40 mg of PEG (20 kDa, MW) was intensively dissovled by heating in 1 ml of DMSO. Heparin (5 ~ 40 mg) was then well-dissolved in 0.1 ml of DI H2O and diluted with 2 ml of DMSO containing well-dissolved EDC (6 ~ 48 mg), NHS (4 ~ 32 mg) and a catalytic amount of DMAP as well (Table 1). After incubation at 40 °C for 20 min, the heparin-activated mixture was mixed with above-prepared PEG solution and immediately added to 2 ml of DNP suspension (in DMSO, 40 mg Fe/ml). The reaction mixture was further incubated at 40 °C with shaking for 2 h. This D-based, aminated, PEGylated and heparin conjugated MNP (DNPH) product was purified and concentrated by centrifugation (15,000 rounds per minute (r.p.m.) × 15 min) and washed with DI H2O for five times.
Table 1.
Feed compositions of DNPH synthesis.
| Product | DN (mg Fe) | EDC (mg) | NHS (mg) | PEG (mg) | Heparin (mg) |
|---|---|---|---|---|---|
| DNPH1 | 80 | 24 | 20 | 40 | 40 |
| DNPH2 | 80 | 12 | 10 | 40 | 20 |
| DNPH3 | 80 | 6 | 5 | 40 | 10 |
| DNPH4 | 80 | 3 | 2.5 | 40 | 5 |
2.3 In vitro Characterization of MNP
2.3.1 Quantitative analysis of Iron (Fe) content of MNP suspensions in DI H2O
The Fe content of all MNP suspensions (in DI H2O) throughout this study was analyzed by inductively coupled plasma optical emission spectroscopy (ICP-OES) using an Optima DV 2000 spectrometer (Perkin Elmer, USA). In brief, 10 μL of MNP suspension was degraded in 1 ml of concentrated HCl and diluted with DI H2O to a concentration of 1–10 mg Fe/L. Samples were measured at 238.204 nm and calibrated using iron standard (0–10 mg Fe/L) and yittrium internal standard (1 mg Fe/L).
2.3.2 Size distribution and zeta potential of MNP
In current study, we used dynamic light scattering (DLS) to characterize the hydrodynamic size distribution and zeta potential of MNP suspensions using a Nano ZS90 particle-sizer (Malvern, Worcestershire, UK). All dilute MNP suspensions (~ 0.1 mg/ml) were measured in triplicate in DI H2O.
2.3.3 Fourier transform infrared spectroscopy (FTIR), transmission electron microscopy (TEM) and superconducting quantum interference device (SQUID) characterization of MNP
All the MNP samples were lyophilized prior to the collection of their infrared (IR) spectra. A Spectrum BX FTIR spectrometer (Perkin Elmer, Massachusetts, USA) was used here to collect all the IR spectra with a wavenumber range of 4000–600 cm−1 (mid-range FTIR). The morphology and size of MNP throughout the synthesis steps (D, DN, DNPH1-4) were determined by TEM analysis using a Philips CM-100 transmission electron microscope (Amsterdam, Netherlands). Samples of dilute MNP suspensions were loaded onto 200-mesh Lacey carbon film-coated copper grids followed by ambient drying. TEM images were then taken with an accelerated voltage of 60 kV. After that, SQUID analysis was carried out to assess the magnetization properties of MNP using an MPMS-XL SQUID magnetometer (Quantum Design, San Diego, CA). The nanoparticles were lyophilized, powdered and suspended in an eicosane matrix, mounted in capsules and then assessed at varying DC magnetic field (0-30000 Oe) at 300 K.
2.3.4 In vitro size stability assessment of DNPH
Size stability of DNPH samples (DNPH1-4, Table 1) was assessed using a multiple and intense centrifugation process. Briefly, 1.0 ml of size-known DNPH suspensions (2.4 mg Fe/ml, the concentration used for in vivo assessment of DNPH) were centrifuged at 15,000 r.p.m. × 15 min × 5 cycles. The DNPH samples were re-dispersed in 1 ml of fresh DI H2O by pipetting after each centrifugation. After the final (fifth) centrifugation, the samples were resuspended in DI H2O with a 20-sec mild sonication using a Sonifier (Branson, Connecticut, USA) operated at 10% amplitude at 25 °C. All the DNPH samples were monitored by DLS for variations of the size distributions during the whole centrifugation process.
Size stability of MNP suspensions (2.4 mg Fe/ml) in different solutions were also characterized in this study. The MNP samples were incubated in DI H2O, 0.1 mol/L PBS (pH 7.4) or Hanks simulated body fluid (SBF) at 37 °C for 2 h with gentle shaking. After incubation, size distributions of all tested samples were measured in triplicate using DLS.
2.3.5 Quantitative analysis of amination, PEG content and heparin content
A previously described ninhydrin assay (24) was chosen to determine the amine content of the aminated nanoparticles (DN) by measuring the absorbance of ninhydrin-MNP mixture at 570 nm using a PowerWaveX340 spectrophotometer (Biotek, Vermont, USA). And PEG density on DNPH surface was then measured using a barium iodide assay based on the characteristic absorbance of PEG-iodine complex at 535 nm (25–26). Finally, the heparin conjugation of MNP was quantified using the azure A assay (27) by measuring the absorbance change at 620 nm. A metachromatic shift (from blue to red) occurs when the dye azure A is exposed to heparin. Ethanolamine, free mPEG-NHS (20 kDa) and heparin were used here as the standards of the ninhydrin assay, the barium iodide assay and the azure A assay, respectively, for the construction of the calibration curves. And all the measurements were carried out in triplicate.
2.3.6 Protamine loading on DNPH
The cationic protamine was loaded onto the anionic surface of DNPH3 or DNPH4 via charge interaction. Briefly, 0–120 μg of protamine was well dissolved in DI H2O and added to DNPH suspension (in DI H2O, cotaining 1 mg Fe) with a total volume of 1.0 ml. This mixture solution was incubated at 4 °C for 2 h with gentle shaking. The unbound protamine was then removed by centrifugation (15,000 r.p.m. × 15 min) and washed with DI H2O for three times. All the supernatants were collected and the amount of unbound protamine was quantitatively measured using BCA protein assay. Protamine loading content (PLC) and protamine binding efficiency (PBE) were then calculated quantified using Equation (1–2):
| (1) |
| (2) |
2.4 In vivo evaluation of MNP
All animal studies were carried out according to protocols reviewed and approved by the University of Michigan Committee on Use and Care of Animals (UCUCA).
2.4.1 Plasma pharmacokinetics (PK) and biodistribution of MNP
The PK and biodistribution studies of each MNP were performed using male C57BL6 black mice (18–22 g, Harlan, Indianapolis, IN). Mice were anesthetized by intraperitoneal (I.P.) injection of a ketamine/xylazine mixture (87/13 mg/kg body weight, hereinafter the same) and then treated through the lateral tail vein with MNP suspensions (D, DNPH3 and DNPH4, 12 mg Fe/kg). Blood samples were collected at preset time points by cardiac puncture and immediately seperated from the whole blood by centrifugation (5,000 r.p.m. × 5 min). The samples were then frozen at −80 °C until analysis. And at time points of 1 h or 48 h post-injection, mice were euthanized by CO2 overdose and their main organs (heart, liver, spleen, lung, and kidney) were harvested and frozen at −80 °C until analysis.
The MNP contents in blood samples and excised tissues were quantitatively analyzed using ESR spectroscopy as described in Section 2.4.5.
2.4.2 Induction of 9L-glioma subcutaneous tumors
9L-glioma cells (Brain Tumor Research Center, University of California, USA) were implanted subcutaneously to the left flank of male athymic nude mice (18–22 g, Harlan, Indiana, USA) for induction of the tumors. In brief, 9L-glioma cells were cultured in Dulbecco’s modified Eagle’s medium (DMEM) containing 10% heat inactivated fetal bovine serum and 1% antibiotics (penicillin and streptomycin) in a humidified atmosphere of 5% CO2 at 37 °C. Cells were grown to confluence, harvested and resuspended in fresh DMEM (serum free) at a concentration of 108 cells/ml. 100 μL of the cell suspension (~ 107 cells/mouse) was injected subcutaneously in the left flank of each anesthetized mouse. Magnetic targeting experiments were carried out when the tumor volume reached 300–500 mm3.
2.4.3 Optimization of magnetic targeting of MNP in the 9L-glioma mouse model
The applied magnetic field was set up by using the combination of permanent magnets (K&J Magnetics, USA). In brief, three DY0Y0-N52 cylindrical permanent ferro-magnets (51 mm diameter × 51 mm thickness,) were linked in tandem. And then a smaller D48-N52 cylindrical permanent ferro-magnet (6.4 mm-diameter × 12.7 mm-thickness) was mounted on the pole face center of the tandem magnets, showing a maximum magnetic field intensity of about 320 mT. The mouse was anesthetized and fixed face-down on a lucite jig with the flank tumor positioning closely to the pole face of the smaller magnet. The previously used magnetic targeting protocol was optimized in this study by two single-factor tests of I.D. and targeting time. For the single-factor analysis of I.D., each mouse was administered with DNPH3 suspension at a dose of 4–20 mg Fe/kg through lateral tail vein and retained in the magnetic eld for 45 min. And for the single-factor analysis of magnetic targeting time, animals were intravenously administered with DNPH3 (12 mg Fe/kg) and retained in the magnetic field for 15–60 min.
After magnetic targeting, animals were immediately euthanized by CO2 overdose and the flank tumors were excised for ESR analysis of tumor MNP accumulation using the protocol described in Section 24.5. MNP accumulation in excised tumor ((the percentage of injected MNP dose)/g tissue, I.D.%/g tissue) was calculated according to Equation (3):
| (3) |
Here, Fetumor is defined as the Fe content (μg/g tissue) in excised tumor tissue; BW, short for “body weight”, was normalized as 20 g for each mouse, and thus, the normalized I.D. for each kind of MNP sample was 240 μg Fe/animal.
2.4.4 Magnetic targeting and magnetic resonance imaging (MRI)
The in vivo dynamic distribution and tumor accumulation of MNP (D, DNPH3 and DNPH4) in the mouse 9L-glioma subcutaneous tumor model was further confirmed and monitored by real-time and non-invasive MRI carried out on a 30-cm horizontal-bore, 7T Direct Drive small animal imaging system (Varian, California, USA). Prior to MNP administration, the animals were anesthetized by inhalation of isoflurane/air mixture (1.5/98.5 v/v) and imaged using a high-resolution T2-weighted fast spin echo multi-slice (fsems) scan with the key parameters set as: repetition time (TR) = 4,000 ms; echo time (TE) = 60 ms; field of view = 30 mm × 30 mm over 256 × 256 matrix; slice thickness = 1 mm; slice separation = 0 mm; number of slices = 15; and one signal average. The animals were imaged with another T2-weighted fsems scan immediately after the magnetic targeting.
2.4.5 Ex vivo measurement of MNP in blood and excised tissue samples
Quantitative analysis of MNP (Fe content) in all blood and excised tissue samples throughout this study was conducted using electron spin resonance (ESR) spectroscopy using an EMX ESR spectrometer (Bruker, Massachusetts, USA). The key parameters of ESR analysis were set as: temperature of −128 °C; resonant frequency of 9.2 GHz; and microwave power of 20 mW. The modulation amplitude (1G or 5G) and combination of receiver gain (1 × 10³ ~ 1 × 10⁵) were set based on the observed spectral intensity of different samples. Blood or tissue samples with no exposure to MNP were used as controls.
For blood samples, ~ 30 μL of MNP-containing plasma was carefully transferred to an ESR tube and kept at −80 °C until ESR analysis. For excised tissue samples (normal tissues or tumor tissues), the tissues were sectioned into small pieces (~ 10 mg/piece) and frozen by dry ice for 3 min. And then, a 30-cm-long glass rod was used to push the samples (3 pieces, about 30 mg) to the bottom of the ESR tube. Three samples were made from each tissue sample to acquire reliable tissue MNP concentrations (n = 9; 3 EPR samples × 3 mice). Calibration curves were constructed with concentration-known MNP suspensions.
2.6 STATISTICAL ANALYSIS
All data were shown in this study as mean ± standard deviation (mean ± SD) unless otherwise noted. Statistical comparisons were made using the Student’s t-test with a significant difference of p < 0.05.
3. RESULTS
3.1 Synthesis and characterization of MNP
The starch-coated nanoparticles were versatile and widely utilized for theranostic applications (28–30). By making use of the coating starch, D was crosslinked (for stabilization) with epichlorohydrin and aminated (for further chemical conjugation) with concentrated ammonia to form DN (Fig. 1). After that, DN nanoparticles were simultaneously PEGylated and heparinized for the synthesis of the final product DNPH using the so-called one-pot strategy. All types of MNP were characterized in detail for particle size distribution, surface charge density and amine content with the results shown in Table 2. After crosslinking and amination, the average particle size (hydrodynamic diameter) of MNP increased slightly from 101.4 ± 3.7 nm (D) to 143.8 ± 4.3 (DN). The expected positive shift in zeta potential of MNP from −1.4 ± 0.2 mV (D) to +42.7 ± 4.4 (DN) proving the satisfactory amination. The amine content of DN was further quantitatively characterized using the ninhydrin assay by measuring the amine-initiated presence of dark Ruhemann’s Purple at 570 nm. The successful amination enables DN to have an amine content of 286.3 ± 45.3 nmol/mg Fe, indicating about 9.58 × 10⁴ amine groups/DN nanoparticle according to Chemicell® product information of D (1.8 × 10¹² particles/mg Fe).
Table 2.
Physical-chemical characterization of each MNP type with different feed ratios of heparin and PEG.
| MNP | Size distribution (nm) | Zeta Potential (mV) | [PEG] μg/mg Fe | PEG/MNP (molecules/p article) | [Heparin] μg/mg Fe |
|---|---|---|---|---|---|
| D | 101.4 ± 3.7 | −1.4 ± 0.2 | N/A | N/A | N/A |
| DN | 143.8 ± 4.3 | +42.7 ± 4.4 | N/A | N/A | N/A |
| DNPH1 | 164.9 ± 7.8 | −29.1 ± 3.3 | 4.8 ± 0.8 | 81 | 95.4 ± 12.3 |
| DNPH2 | 166.6 ± 7.4 | −20.3 ± 2.3 | 12.5 ± 1.7 | 209 | 78.4 ± 9.2 |
| DNPH3 | 162.2 ± 9.5 | −8.9 ± 1.7 | 19.2 ± 4.1 | 322 | 51.9 ± 7.6 |
| DNPH4 | 171.4 ± 6.7 | −3.6 ± 0.4 | 23.2 ± 4.9 | 387 | 39.6 ± 4.5 |
In this study, NHS chemistry was employed for simultaneous PEGylation and heparinization of DN with different feed ratios of PEG and heparin ([PEG/Heparin], mg/mg) using one-pot synthesis. The final products (DNPH1–4) showed negligible difference in average particle size of ~ 165 nm. However, different negative shifts in zeta potential of DNPH1-4 (with feed ratios of PEG and heparin of 1:1, 2:1, 4:1, 8:1, Table 1) were observed from +42.7 ± 4.4 to −29.1 ± 3.3 (DNPH1), −20.3 ± 2.3 (DNPH2), −8.9 ± 1.7 (DNPH3) and −3.6 ± 0.4 (DNPH4).
The PEGylation and heparin conjugation of DN were quantitatively characterized by barium iodide assay and azure A assay, respectivley. With [PEG/Heparin] increased from 1:1 to 8:1, PEG contents of MNP increased from 4.8 ± 0.8 μg/mg Fe (DNPH1, 81 PEG molecules/particle) to 12.5 ± 1.7 μg/mg Fe (DNPH2, 209 PEG molecules/particle), 19.2 ± 4.1 μg/mg Fe (DNPH3, 322 PEG molecules/particle) and 23.2 ± 4.9 μg/mg Fe (DNPH4, 387 PEG molecules/particle). Meanwhile, heparin conjugation of MNP decreased from 95.4 ± 12.3 μg/mg Fe (DNPH1) to 78.4 ± 9.2 μg/mg Fe (DNPH2), 51.9 ± 7.6 μg/mg Fe (DNPH3) and 39.6 ± 4.5 μg/mg Fe (DNPH4). The results of PEGylation and heparin conjugation of MNP were consistent with those of zeta potential measurements. Due to the limited surface area of nanoparticles, there is competition between PEGylation and heparinization. The more neutral PEGylation, the less negative heparin molecules on nanoparticle surface, and thus, the more neutral shift of zeta potential. The increase in average size, the decrease in zeta potential and the quantitative results (PEGylation and heparinization) of MNP indicated the successful synthesis of DNPH1-4.
3.2 FTIR, TEM and SQUID characterizati on of MNP
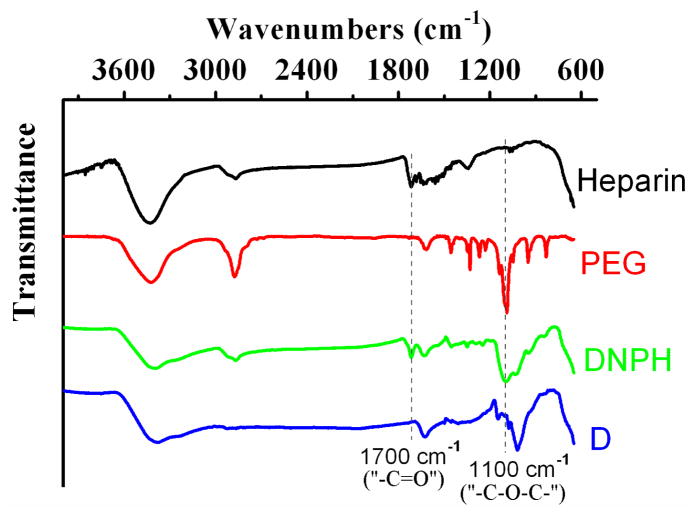
The correct synthesis of DNPH was further confirmed by FTIR spectra (Fig. 2). As a kind of qualitative measurement, FTIR didn’t demonstate the difference in IR spectra of DNPH1-4. Therefore, DNPH3 was chosen as the representative spectrum of all DNPH samples. Evolution of the peak at ~1100 cm−1, the specific absorption of “C-O-C” ether bond stretching vibrations (31), was observed in the IR spectra of both free PEG and DNPH, indicating the existance of PEG moieties on MNP. And the absorption peak at ~1700 cm−1 in spectra of both free heparin and DNPH, which was produced by the “ –C=O” stretching vibrations of carboxyl groups of heparin (32), confirming the heparin moieties on MNP. The coemergence of the peaks at 1100 cm−1 and 1700 cm−1 in IR spectrum of DNPH proved the successful PEGylation and heparinization of DN.
Fig 2.
FTIR spectra of D, DNPH, PEG and heparin. Due to the similar spectra of DNPH1-4, only DNPH3 was chosen as the representative for FTIR characterization.
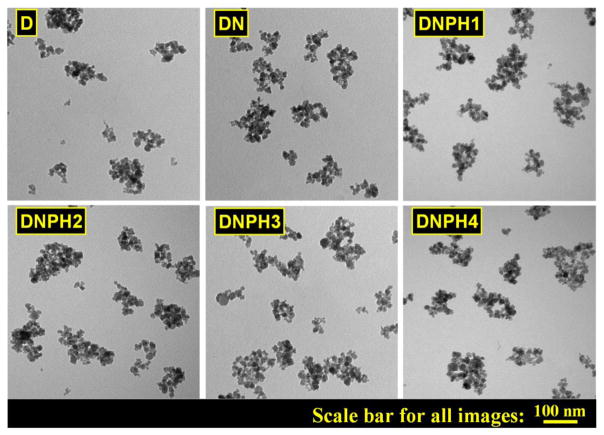
The typical morphology of each type of MNP was identified by TEM and shown in Fig. 3, which showed that nanoparticles were individually dispersed with irregular shapes and similar structures (larger coated magnetic cores cotaining multiple smaller Fe3O4 domains). TEM results indicated that the structure of parent D was well kept throughout the whole syntheis steps.
Fig 3.
TEM images of D, DN, DNPH1, DNPH2, DNPH3 and DNPH4.
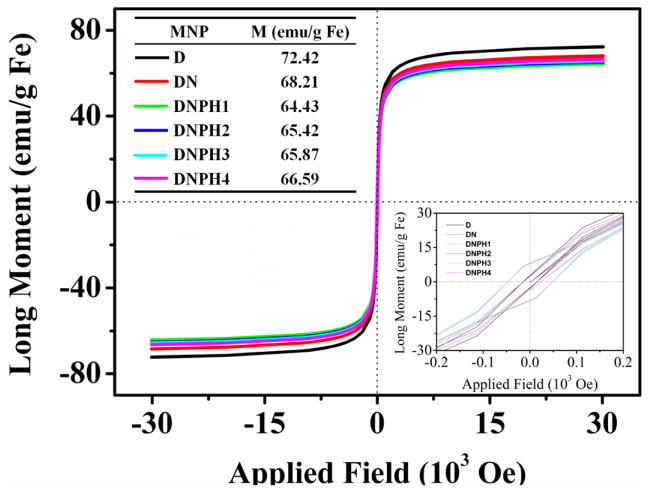
Superparamagnetic properties of MNP (D, DN, DNPH1-4) were characterized using SQUID analysis to confirm their plausibility for applications in magnetic targeting in vivo. Neither hysteresis nor magnetic remanence was observed in any magnetization curve of MNP, indicating the satisfactory superparamagnetic properties of parent D were well conserved during the steps of nanoparticle modifications (Fig. 4). And all the DNPH samples possess similar saturation magnetization of around 65 emu/g Fe, about 90% of the saturation magnetization of the precursor D. The SQUID results indicated the suitability of DNPH samples for live animal magnetic targeting.
Fig 4.
Magnetization sucsceptibility of D, DN and DNPH1-4 using SQUID analysis. The saturation magnetization of each MNP type was shown in the inset table. Inset image showed the data around zero field with an enlarged scale.
3.3 In vitro size stability of MNP
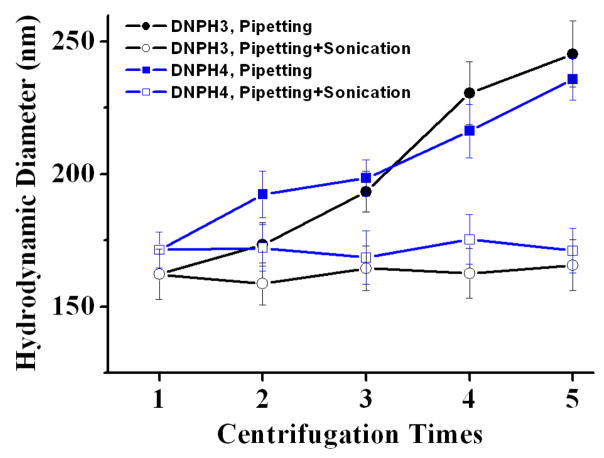
Size stability of DNPH3 and DNPH4 against high speed centrifugation were characterized in detail (Fig. 5). Both DNPH3 and DNPH4 showed great size stability against multiple centrifugation process at 15,000 r.p.m. × 15 min. No aggregation was attained after five cycles of high speed centrifugation. And only slight size increases were observed for DNPH3 (from 162.2 ± 9.5 nm to 245.3 ± 12.4 nm) and DNPH (171.4 ± 6.7 nm to 235.7 ± 7.8 nm) when re-suspended by pipetting only. When pipetting with mild sonication, both DNPH3 and DNPH4 could be easily re-suspended in DI H2O with almost no difference in size distributions compared to their counterparts prior to the centrifugation process. Size stability of DNPH1 and DNPH2 were not carried out in detail due to their poor resistance to high speed centrifugation. Especially for DNPH1, the nanoparticles could not be thoroughly re-suspended in DI H2O with/without sonication even after the first centrifugation.
Fig 5.
Size stability characterization of DNPH3 and DNPH4 against centrifugation at 15,000 r.p.m. × 15 min × 5 cycles. The samples were resuspended in DI H2O by pipetting with/without 20 seconds of sonication after every centrifugation.
Size stability of DNPH1-4 in different solutions were also characterized in detail. Both DNPH3 and DNPH4 showed negligible difference in size distributions after a 2-h incubation at 37 °C in DI H2O, PBS or Hanks SBF (Table 3). However, DNPH1 and DNPH2 can only keep their size stability in DI H2O. With relatively more heparin contents and less protective PEG on nanoparticle surface, DNPH1 or DNPH2 showed poor resistance to ionic solutions (PBS or Hanks SBF). Size distribution of DNPH2 increased significantly (p < 0.01) from 166.6 ± 7.4 nm (in DI H2O) to 353.3 ± 74.5 nm (in PBS) and 371.1 ± 59.3 nm (in Hanks SBF). And DNPH1, with the least protective PEG of all the DNPH samples, precipitated at once when exposed to either PBS or Hanks SBF. Therefore, DNPH1 and DNPH2 were not utilized for further in vivo study.
Table 3.
Hydrodynamic size distributions of MNP in different Conditions.
| Product | DI H2O | PBS | Hanks SBF |
|---|---|---|---|
| DNPH1 | 164.9 ± 7.8 | aggregation | aggregation |
| DNPH2 | 166.6 ± 7.4 | 353.3 ± 74.5 | 371.1 ± 59.3 |
| DNPH3 | 162.2 ± 9.5 | 165.3 ± 7.9 | 164.9 ± 8.7 |
| DNPH4 | 171.4 ± 6.7 | 168.7 ± 9.2 | 173.0 ± 7.2 |
3.3 Protamine loading on DNPH
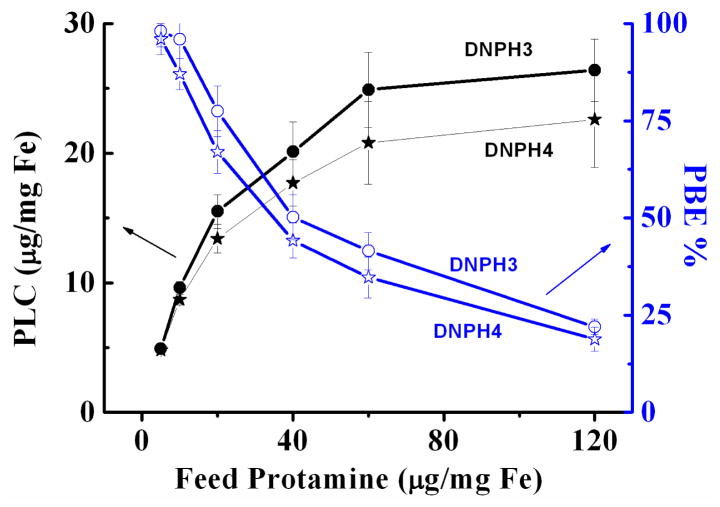
As shown in Fig. 6, protamine loading contents (PLC) for both DNPH3 and DNPH4 significantly increased (p < 0.01) from 4.9 ± 0.2 μg/mg Fe and 4.8 ± 0.2 μg/mg Fe to 24.9 ± 2.9 μg/mg Fe and 20.8 ± 3.2 μg/mg Fe, respectively, when the feed protamine amounts increased from 5 μg/mg Fe to 60 μg/mg Fe. However, only slightly increase of PLC were observed for both DNPH3 (26.4 ± 2.4 μg/mg Fe, 6.0% increase) and DNPH4 (22.6 ± 3.7 μg/mg Fe, 8.6% increase) when the feed protamine was doubled (from 60 μg/mg Fe to 120 μg/mg Fe), indicating the saturation loading of DNPH platforms for protamine. Meanwhile, protamine binding efficiency (PBE) decreased all the way from about 100% to 22.0%(DNPH3) and 18.8% (DNPH4) accordingly with the increase of feed protamine from 5 μg/mg Fe to 120 μg/mg Fe. Both DNPH3 and DNPH4 showed great size stability throughout the protamine loading process.
Fig 6.
Protamine loading content (PLC, black curve) and protamine binding efficiency (PBE, blue curve) of DNPH3 and DNPH4 varied with the amount of feed protamine of 0–120 μg/mg Fe.
3.4. Pharmacokinetic (PK) profiles of DNPH
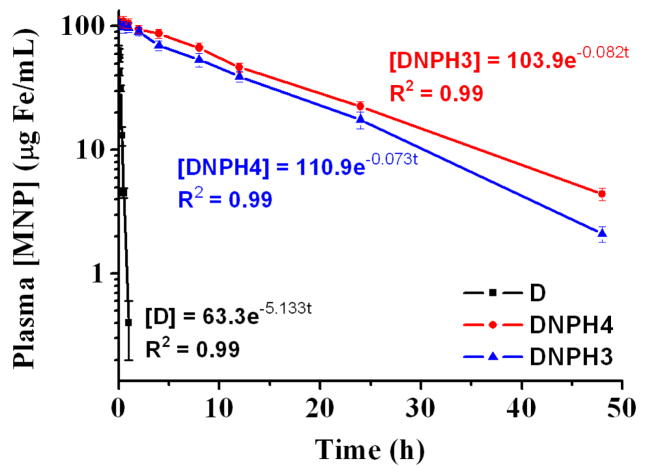
To further assess the potential in vivo application of this one-pot synthesized DNPH platform, the plasma PK profiles of DNPH3-4 and D (for comparison) were investigated in detail. As described previously, starch-coated MNP (D) and their derivatives showed a one-compartment PK profile when they were injected intravenously into animals. A similar PK model was also constructed here for each type of MNP. The plasma MNP concentration versus time profiles were shown in Fig. 7, and the corresponding PK parameters were presented in Table 4. DNPH3 (T1/2 = 8.45 h) or DNPH4 (T1/2 = 9.44 h), with appropriate amounts of coating heparin and protective PEG, showed significantly slower clearance (p < 0.001) than that of the precursor D (T1/2 = 0.13 h). And Vd for DNPH3 (115.49 ml/kg) or DNPH4 (108.21 ml/kg) was much lower than that of D (189.57 ml/kg), suggesting less tissue absorption of DNPH3-4 after PEGylation. In addition, the much lower Co, the initial plasma MNP concentration, for D (63.3 μg Fe/ml) than that of DNPH3 (103.9 μg Fe/ml) or DNPH4 (110.9 μg Fe/ml), proving the much higher first-pass tissue absorption for D. The “naked” D, without PEG protection, was rapidly identified and then cleared by RES in the liver and spleen, showing poor blood circulation time. AUC0-∞, indicating total plasma exposure available from one dose of MNP, of DNPH3 (1415 μg Fe·h/ml) and DNPH4 (1769 μg Fe·h/ml) were 109-fold and 136-fold, respectively, higher than that of D (13 μg Fe·h/ml). Both DNPH3 and DNPH4 showed great PK profiles (long circulation time, low RES recognition and high AUC0-∞).
Fig 7.
Plasma pharmacokinetic profiles of D, DNPH3 and DNPH4 in male C57BL6 black mouse (12 mg Fe/kg). Key pharmacokinetic parameters of all MNP types were calculated from the models and shown in Table 4.
Table 4.
Calculated parameters of MNP in blood circulation obtained from experimentally determined pharmacokinetic models.
| MNP | Co (μg Fe/ml) | K (1/h) | T1/2 (h) | Vd (ml/kg) | CL (ml/h/kg) | AUC0-∞ (μg Fe·h/ml) |
|---|---|---|---|---|---|---|
| D | 63.3 | 5.133 | 0.13 | 189.57 | 973.06 | 13 |
| DNPH3 | 103.9 | 0.082 | 8.45 | 115.49 | 9.47 | 1415 |
| DNPH4 | 110.9 | 0.073 | 9.44 | 108.21 | 7.89 | 1769 |
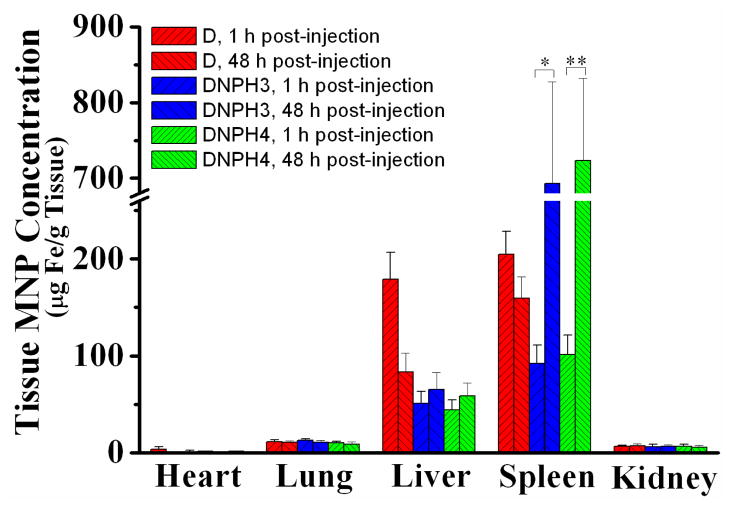
According to the results of the PK study, about 1 h and 48 h were needed for the complete clearance (> 98%) of D and DNPH3-4, repectively. Therefore, mice were euthanized at 1 h or 48 h post-injection and the main organs (heart, liver, spleen, lung and kidney) were harvested to measure the tissue absorption for D, DNPH3 and DNPH4. Calculated tissue accumulations of all the tested nanoparticles were depicted in Fig. 8. As non-elimination organs, any type of MNP showed similar and low accumulation in the heart (< 3 μg/g tissue), kidney (~ 7 μg/g tissue) and lung (~ 11 μg/g tissue) over the tested time course (0 - 48 h). However, D showed very different distribution profiles in elimination organs (spleen and liver) than those of DNPH3 or DNPH4. Without the protective PEG on surface, D showed much higher RES recognition in liver and spleen. After injection, D was rapidly taken by both liver (179.29 ± 27.68 μg/g tissue @ 1 h post-injection) and spleen (204.65 ± 23.89 μg/g tissue @ 1 h post-injection). After that, D nanoparticles were gradually biodegraded and showed much decreased MNP contents in both liver (83.36 ± 19.73 μg/g tissue) and spleen (159.32 ± 22.34 μg/g tissue) at 48 h post-injection. Different from the biodistribution pattern of D, much lower MNP concentrations were observed for DNPH3 (50.04 ± 12.45 μg/g tissue @ liver, 92.30 ± 18.74 μg/g tissue @ spleen) and DNPH4 (44.48 ± 10.27 μg/g tissue @ liver, 101.52 ± 19.78 μg/g tissue @ spleen) in liver at 1 h post-injection. And tissue nanoparticle concentrations for DNPH3 (65.44 ± 17.32 μg/g tissue @ liver, 692.98 ± 134.65 μg/g tissue @ spleen) and DNPH4 (58.47 ± 13.36μg/g tissue @ liver, 723.27 ± 108.79 μg/g tissue @ spleen) at 48 h post-injection were much higher than those at 1 h post-injection.
Fig 8.
Biodistribution of D, DNPH3 and DNPH4 in main organs (Heart, Liver, Spleen, Lung and Kidney) of the tested mice. (*,** = p < 0.01, determined by the Student t test).
3.7 Optimization of magnetic targeting and quantitative analysis of Fe content in excised tumor tissue
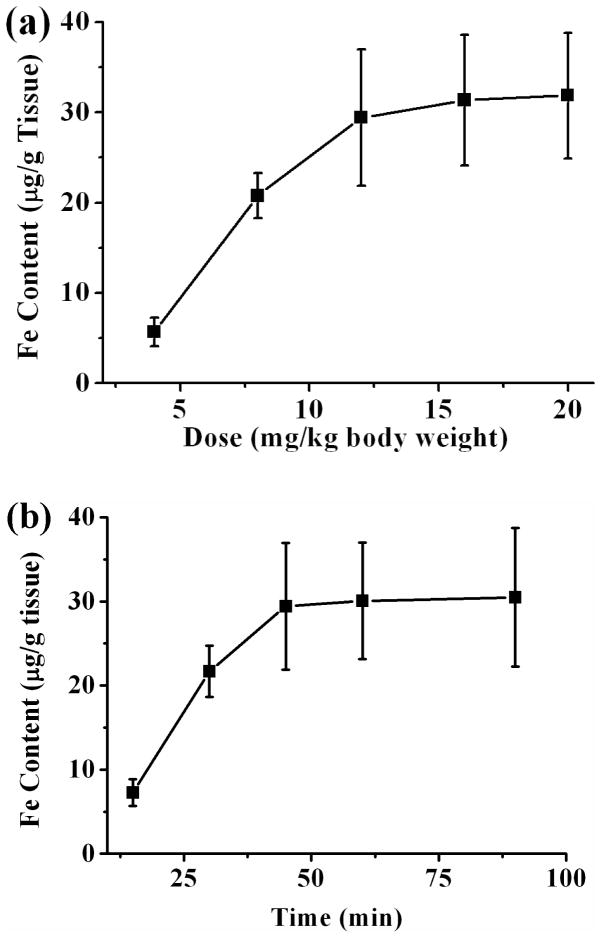
After intravenous injection, the targeted delivery of MNP in tumor lesion via magnetic capture was optimized using two sigle-factor tests of dose (4, 8, 12, 16 and 20 mg/kg) and magnetic targeting time (15, 30, 45, 60 and 90 min). And tumor MNP contents were quantitatively characterized via ESR analysis. As shown in Fig. 9a, the MNP concentrations in magnetically targeted tumors increased from 5.68 ± 1.59μg Fe/g tissue to 29.42 ± 7.54 μg Fe/g tissue when the I.D. of DNPH3 increased from 4 mg/kg to 12 mg/kg, indicating that high blood MNP concentration is crucial for enhanced tumor accumulation of MNP. However, only slightly increase of MNP contents were observed when I.D. further increased from 12 mg/kg to 16 mg/kg (31.33 ± 7.22 μg Fe/g tissue, 3.1% increase) and 20 mg/kg (31.87 ± 6.95 μg Fe/g tissue, 4.9% increase), implying a saturation of MNP accumulation in the tumor tissue. Iron oxide nanoparticles have been widely proven to be low toxic, biocompatible and biodegradable. Meanwhile, some studies also showed that too much MNP in blood circulation can cause significant toxicity issues, which were mainly attributable to oxidative stree and the generation of free radicals during the process of MNP biodegradation. Therefore, DNPH nanoparticles were injected intravenously with the dose of 12 mg/kg thereafter.
Fig 9.
Optimization of magnetic targeting of DNPH3 in 9L-glioma-bearing mouse model by two single-factor tests of (a) injected dose and (b) magnetic targeting time.
Besides I.D., magnetic targeting time is another crucial parameter for optimized MNP delivery to tumor region. Appropriate magnetic targeting time can greatly increase the comfortability of the tested animals under the premise of enough MNP delivery. MNP accumulation in tumor tissue versus magnetic targeting time was calculated and shown in Fig. 9b. Magnetic capture of DNPH in tumor lesion increased accordingly when targeting time increased from 15 min (7.27 ± 1.59 μg Fe/g tissue) to 30 min (21.68 ± 3.05 μg Fe/g tissue) and 45 min (29.42 ± 7.54 μg Fe/g tissue). Similar to the results of single-factor test of I.D., a saturation delivery of MNP in tumor region was also observed when magnetic targeting time further increased from 45 min to 60 min (30.06 ± 6.93 μg Fe/g tissue, 2.2% increase) and even 90 min (30.48 ± 8.24 μg Fe/g tissue, 3.6% increase). Therefore, a period of 45 min is sufficient for the saturation capture of DNPH in tumor site.
In conclusion, magnetic targeting study for all MNP types was carried out with the optimized dose of 12 mg/kg and magnetic targeting time of 45 min thereafter.
3.6 MRI characterization of DNPH in a 9L-glioma mouse model
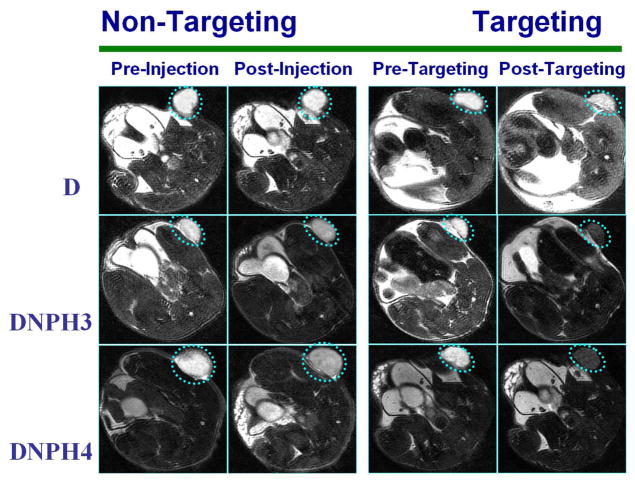
Magnetic tumor targeting behaviors of MNP with optimized I.D. and targeting time were further visually confirmed by MRI in this study. Iron oxide based MNP were widely used as favorable enhancers (negative contrasts) of T2/T2* proton relaxation. Therefore, the tissue/organ with high accumulation of MNP was identified as the hypointense region on the image of T2-weighted fsems MRI scan. Representative MRI images of mice administered with D, DNPH3 or DNPH4 with/without magnetic targeting were depicted in Fig. 10. The flank tumors (in broken circle) on the baseline images of T2-weighted scans (images taken prior to MNP administration) were clearly observed as the hyperintense regions. The MR images, acquired prior to and at 1 h post-administration from the mice administered with D without targeting, didn’t show any visible difference in hypointensity of tumor sites, indicating the negligible accumulation of D in tumor lesions. And only slightly visible hypointensity in the tumor region was observed in the post-injection image of the mouse injected with D when magnetic targeting was applied. MR images of animals exposed to DNPH3 or DNPH4 with magnetic targeting showed much increased hypointensity in tumor regions. The long-circulating properties enable DNPH nanoparticles to acquire visible accumulation in tumor lesions even when magnetic targeting was not applied.
Fig 10.
Representative MRI images of mice bearing 9L-glioma flank tumors injected with D, DNPH3 and DNPH4, respectively. For each MNP type, MRI images were taken prior to and at 60 min post-administration of MNP with/without magnetic targeting.
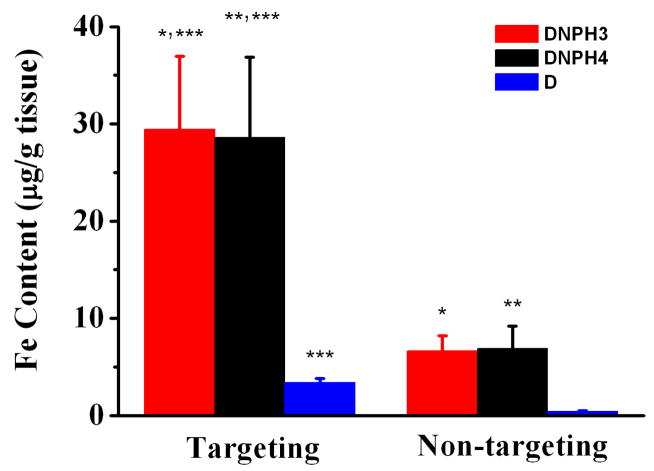
After MRI scans, animals were immediately euthanized and the flank tumors were excised for quantitative MNP analysis using ESR spectroscopy. MNP concentrations in excised tumor tissue were shown in Fig. 11. Due to the poor plasma half-life of D, almost negligible D accumulation in tumor lesion (0.32 ± 0.21 μg Fe/g tissue, 0.13% of I.D./g tissue) was measured when no magnetic targeting was applied. And the tumor content of D increased significantly to 4.27 ± 0.65 μg Fe/g tissue (13.3-fold increase, 1.78% of I.D./g tissue) under magnetic targeting. When exposed to DNPH3 or DNPH4, tumor MNP concentration was much higher than that of D. Compared to the concentration of D in tumor, long-circulating DNPH3 and DNPH4 were selectively and efficiently delivered to the tumor sites when magnetic targeting was applied. MNP concentrations of DNPH3 (29.42 ± 7.54 μg Fe/g tissue, 12.3% of I.D./g tissue) and DNPH4 (30.61 ± 8.25 μg Fe/g tissue, 12.8% of I.D./g tissue) were both about 4.4-fold higher than their non-targeting counterparts with DNPH3 of 6.64 ± 1.59 μg Fe/g tissue (2.8% of I.D./g tissue) and DNPH4 of 6.89 ± 2.33 μg Fe/g tissue (2.9% of I.D./g tissue). Interestingly, the long lasting DNPH3 or DNPH4, without magnetic targeting, even showed about 1.6-fold higher tumor delivery than that of targeted D. Owing to the PEGylation, EPR effect in tumor lesions and magnetic targeting, magnetic capture of DNPH3 or DNPH4 in tumor was about 200-fold and 7-fold higher than those of D with and without magnetic targeting, respectively.
Fig 11.
MNP concentrations of D, DNPH3 and DNPH4 in targeted/no-targeted tumor tissue quantitatively measured with EPR analyses (*,**,*** = p < 0.01, determined by the Student t test).
4. DISCUSSION
The success of magnetic targeting is highly determined by three major factors: the strength of the applied magnetic field, MNP physiochemical properties (size, shape, magnetic susceptibility, etc.) and MNP’s stability in blood circulation. The magnetic capture of MNP in tumor tissue occurs only when the magnetic force is stronger than the drag forces associated with the convective blood flow. (ref) To make sure that strong enough magnetic force is generated on nanoparticles, MNP with larger magnetic cores (e.g., 100 nm) are of great importance for their selective delivery to tumor via magnetic targeting. Some studies also showed size-dependent accumulation of MNP in tumor, indicating a better delivery of relatively larger nanoparticles in tumor lesions due to a longer retention time of larger particles via EPR effect. (ref) However, MNP with larger sizes increase the recognition of RES and, thus, show much worse half-lives (sometimes on the order of minutes). To enhance the plasma stability of MNP without the loss of magnetic response, starch-coated MNP (D) with magnetic core of about 100 nm was finally chosen as the precursor of the final DNPH nanoparticle and successfully aminated, PEGylated and heparin-functionalized (DNPH) using the simple EDC/NHS chemistry. DNPH3 and DNPH4, with appropriate feed ratios of PEG and heparin, displayed great plasma stability and selective delivery to tumor lesions. The heparin-modification further enabled DNPH to load therapeutic protein drugs (by simple charge interaction) for targeted tumor therapy.
Aminated nanoparticles (DN) were PEGylated and heparinized for the synthesis of the final products of DNPH1-4 (with different feed ratios of PEG and heparin) using one-pot synthesis. This NHS chemistry-based one-pot protocol showed great plausibility for the fast, efficient synthesis of DNPH. Due to the limited surface area of DN, there is a competition between PEGylation and heparin conjugation during the one-pot synthesis of DNPH1-4. Heparin, with multiple functional groups of “-COOH” and therefore multiple NHS ester groups on single molecule when activated by EDC/NHS, was much easier to be conjugated to DN than that of PEG with only one NHS ester group on single molecule. Heparin content on DNPH1 was about 20-fold (95.4 ± 12.3 μg/mg Fe) higher than that of PEG (4.8 ± 0.8 μg/mg Fe) when [PEG/heparin] (mg/mg) was set at 1:1. Even for DNPH4 with [PEG/heparin] of 8:1, the heparin content was still 1.7-fold higher than that of PEG. Based on the size stability of DNPH products in vitro and their PK profiles in vivo, DNPH3 and DNPH4 with appropriate PEGylation and heparin conjugation showed much brighter potentials for applications in vivo than those of DNPH1 and DNPH2.
Protamine was chosen to prove the strong binding capability of DNPH for cationic cargoes. Meanwhile, protamine was used here as a model cationic protein to assess the drug loading potential of this DNPH platform. Both DNPH3 and DNPH4 kept stable throughout the drug loading process with any tested protamine concentration (0 ~ 120 μg/ml) and showed maximum PLCs of 26.4 ± 2.4 μg/mg Fe (DNPH3) and 22.6 ± 3.7 μg/mg Fe (DNPH4). Compared to DNPH4, DNPH3 possessed about 30% more surface heparin and thus, showed better maxmium PLC and PBE. This PEGylated and heparin-modified DNPH platform showed a simple, stable and efficient loading for cationic protein protamine.
For in vivo study, the parent D, without any protective PEG, showed a very short plasma half-life (0.13 h). More than 80% of the initial MNP in blood circulation was cleared out at 30 min post-injection. And almost all the injected D nanoparticles were captured by RES in liver (179.29 ± 27.68 μg/g tissue) and spleen (204.65 ± 23.89 μg/g tissue) at 1 h post-injection. And the decrease of MNP concentrations in liver (about 50% decrease) and spleen (about 20% decrease) from 1 h to 48 h post-injection proved the biocompatibility and biodegradability of D. Compared with D, DNPH3 or DNPH4 showed a very different biodistribution pattern, especially the MNP concentrations in liver and spleen. Both DNPH3 and DNPH4 showed long-circulating properties and relatively lower accumulations in liver but higher accumulations in spleen. And due to the low recognition of RES for DNPH nanoparticles, it took much longer time for the complete absorption of DNPH3 or DNPH4 by liver and spleen than that of D. Detectable amounts of DNPH3 and DNPH4 were still left in blood circulation at 48 h post-administration. As a result, the biodegradation and absorption of MNP in liver and spleen were simultaneously proceeded throughout the 48 h after injection. Different from that of D, the MNP concentrations in liver at 48 h post-injection were about 1.3-fold higher, not lower, for both DNPH3 and DNPH4 than those at 1 h post-injection. Especially for the case in spleen, the concentrations of DNPH3 and DNPH4 at 48 h post-administration were 7.5-fold and 7.3-fold higher, respectively, than those at 1 h post-administration, indicating much more absorption of MNP than that of biodegradation in the spleen.
DNPH1 and DNPH2, with relatively more heparin conjugation, showed very different performances both in vitro and in vivo from those of DNPH3 and DNPH4, with relatively less heparin conjugation. Heparin is a key part of DNPH platform, however, too much coating heparin will cause a lot of adverse effects both in vitro and in vivo. Neither DNPH1 nor DNPH2 can keep stable when exposed to any amount of model protein protamine. Significant size increase (DNPH2) or even aggregation (DNPH1) was observed when they were suspended in PBS or Hanks SBF. DNPH with appropriate balance of PEGylation and heparin conjugation is extremely crucial for its potential applicatoins in vivo.
Encouraged by all the promising in vitro/in vivo results, we further tested the magnetic targeting of this DNPH system in a 9L-glioma tumor bearing mouse model visually monitored by MRI and quantitatively measured by ESR analysis. And the magnetic targeting of DNPH3 for 9L-glioma subcutaneous tumor was optimized by two single-factor tests with an optimized dose of 12 mg/kg and the targeting time of 45 min. Theoretically speaking, MNP accumulation in tumor tissue with targeting time of 60 min or 90 min was slightly higher than that with targeting time of 45 min. However, more than half of the tested animals, anesthetized by intraperitoneal injection of a ketamine/xylazine mixture (87/13 mg/kg), woke up when the targeting time was longer than 60 min. A higher dose or a second dose of ketamine/xylazine mixture was needed in this condition to keep animals still with the magnets, which greatly increased the risk of the anesthesia (more than 20% of the mice died of this). As a result, a targeting time of 45 min was chosen as an optimized parameter.
Due to the inhomogeneity of tumor tissue as well as the magnetic strength, several-fold difference of Fe contents between the samples from the same targeted tumor tissue was observed. Therefore, multiple ESR samples were made from the same tissue sample (organ or tumor) to get reliable average MNP concentrations in the excised tissue.
Throughout this study, both DNPH3 and DNPH4 displayed satisfactory in vivtro/in vivo performances (size stability, long circulating time in plasma, relatively low RES recognition, high tumor targeted accumulation, etc.). However, DNPH3 possessed a more promising future as a carrier for cationic proteins than that of DNPH4. Compared to DNPH4, DNPH3 has about 30% more surface heparin and showed higher PLC as well as PBE for model protamine. With the prerequisite of stability in vitro/in vivo, more heparin on MNP surface can favor this DNPH system with better drug loading performance. Therefore, DNPH3 was chosen to optimize the conditions of magnetic targeting. The efficay study of TAT peptide-gelonin fusion protein loaded DNPH3 was on-going in a rat 9L-glioma brain tumor model.
5. Conclusion
In this preliminary study, commercially acquired D was sucessfully aminated, and simultaneously PEGylated and heparinized for the preparation of the final product of DNPH. This multifunctional DNPH platform (DNPH3) showed great resistance against high speed centrifugation, long plasma circulation time (half-life, 9.37 h) and high protamine loading content (24.9 μg protamine/mg Fe, DNPH3). The binding of DNPH for cationic protamine is simple, efficient and stable. The magentic targeting behaviors of DNPH were visually confirmed by MRI and quantitatively measured by ESR analysis. With an applied magneitc field (320 mT), DNPH was selectively and effectively accumulated in tumor lesions with MNP accumulation of as high as 31.36 μg Fe/g tissue (13.07% injected dose/g tissue) at 45 min post-targeting. All these promising results encourage us to load a therapeutic protein to DNPH for cancer treatment purpose. This work is on-going currently in our lab in a rat brain tumor model.
Acknowledgments
This work was supported in part by the National Institutes of Health (NIH) R01 Grants CA114612 and NS066945, and a Hartwell Foundation Biomedical Research Award. This work was also partially sponsored by Grant R31-2008-000-10103-01 from the World Class University (WCU) project of South Korea. In addition, the project was partially sponsored by the National Basic Research Program of China (973 Program) 2013CB932502.
ABBREVIATIONS
- CPP
Cell penetrating peptide
- D
Starch-coated magnetic iron oxide nanoparticles
- DLS
Dynamic light scattering
- DN
Aminated D
- DNPH
Aminated, PEGylated and heparinized D
- EPR
Enhanced penetration effect
- ESR
Echo spin resonance
- FTIR
Fourier transform infrared spectroscopy
- ICP-OES
Inductively coupled plasma optical emission spectroscopy
- MNP
Magnetic nanoparticles
- MRI
Magnetic resonance imaging
- MWCO
Molecular weight cut-off
- PBE
Protamine binding effiency
- PK
Pharmacokinetics
- PLC
Protamine loading content
- siRNA
Small interfering RNA (siRNA)
- SQUID
Superconducting quantum interference device
- TEM
transmission electron microscopy
References
- 1.Siegel R, Naishadham D, Jemal A. Cancer statistics 2013. CA-Cancer J Clin. 2013;63(1):11–30. doi: 10.3322/caac.21166. [DOI] [PubMed] [Google Scholar]
- 2.Lindley C, McCune J, Thomason T, Lauder D, Sauls A, Adkins S, Sawyer W. Perception of chemotherapy side effects. Cancer Pratc. 1999;7(2):59–65. doi: 10.1046/j.1523-5394.1999.07205.x. [DOI] [PubMed] [Google Scholar]
- 4.Lee JH, Lee K, Moon SH, Lee YH, Park TG, Cheon J. All-in-One target-cell-specific magnetic nanoparticles for simultaneous molecular imaging and siRNA delivery. Angew Chem. 2009;121(23):4238–4243. doi: 10.1002/anie.200805998. [DOI] [PubMed] [Google Scholar]
- 4.Liu Z, Winters M, Holodniy M, Dai HJ. siRNA delivery into human T cells and primary cells with carbon-nanotube transporters. Angew Chem. 2007;46(12):2023–2027. doi: 10.1002/anie.200604295. [DOI] [PubMed] [Google Scholar]
- 5.Valadi H, Ekstrom K, Bossios A, Sjostrand M, Lee JJ, Lotvall JO. Exosome-mediated transfer of mRNAs and microRNAs is a novel mechanism of genetic exchange between cells. Nat Cell Biol. 2007;9(6):654–670. doi: 10.1038/ncb1596. [DOI] [PubMed] [Google Scholar]
- 6.Zhou XK, Qiu J, Wang Z, Huang NY, Li XL, Li Q, Zhang YB, Zhao CJ, Luo C, Zhang NN, Teng X, Chen ZW, Liu X, Yu XL, Wu WL, Wei YQ, Li L. In vitro and in vivo anti-tumor activities of anti-EGFR single-chain variable fragment fused with recombinant gelonin toxin. J Cancer Res Clin Oncol. 2012;138(7):1081–1090. doi: 10.1007/s00432-012-1181-7. [DOI] [PubMed] [Google Scholar]
- 7.Cao Y, Marks JW, Liu Z, Cheung LH, Hittelman WN, Rosenblum MG. Design optimization and characterization of Her2/neu-targeted immunotoxins: comparative in vitro and in vivo efficacy studies. Oncogene. 2013;32(4):1–11. doi: 10.1038/onc.2012.612. [DOI] [PMC free article] [PubMed] [Google Scholar]
- 8.Wang JT, Giuntini F, Eggleston IM, Bown SG, MacRobert AJ. Photochemical internalisation of a macromolecular protein toxin using a cell penetrating peptide-photosensitiser conjugate. J Control Release. 2012;157(2):305–313. doi: 10.1016/j.jconrel.2011.08.025. [DOI] [PubMed] [Google Scholar]
- 9.Park YJ, Chang LC, Liang JF, Moon C, Chung CP, Yang VC. Nontoxic membrane translocation peptide from protamine, low molecular weight protamine (LMWP), for enhanced intracellular protein delivery: in vitro and in vivo study. Faseb J. 2005;19(11):1555–1557. doi: 10.1096/fj.04-2322fje. [DOI] [PubMed] [Google Scholar]
- 10.Kwon YM, Li YT, Naik S, Liang JF, Huang YZ, Park YJ, Yang VC. The ATTEMPTS delivery systems for macromolecular drugs. Expert Opin Drug Del. 2008;5(11):1255–1266. doi: 10.1517/17425240802498059. [DOI] [PubMed] [Google Scholar]
- 11.Sawant RM, Hurley JP, Salmaso S, Kale A, Tolcheva E, Levchenko TS, Torchilin VP. “SMART” drug delivery systems: double-targeted pH-responsive pharmaceutical nanocarriers. Bioconjug Chem. 2006;17(4):943–949. doi: 10.1021/bc060080h. [DOI] [PMC free article] [PubMed] [Google Scholar]
- 12.Winer I, Wang S, Lee YE, Fan W, Gong Y, Burgos-Ojeda D, Spahlinger G, Kopelman R, Buckanovich RJ. F3-targeted cisplatin-hydrogel nanoparticles as an effective therapeutic that targets both murine and human ovarian tumor endothelial cells in vivo. Cancer Res. 2010;70(21):8674–8683. doi: 10.1158/0008-5472.CAN-10-1917. [DOI] [PMC free article] [PubMed] [Google Scholar]
- 13.Xie J, Liu G, Eden HS, Ai H, Chen XY. Surface-engineered magnetic nanoparticle platforms for cancer imaging and therapy. Accounts Chem Res. 2011;44(10):883–892. doi: 10.1021/ar200044b. [DOI] [PMC free article] [PubMed] [Google Scholar]
- 14.Reddy LH, Arias JL, Nicolas J, Couvreur P. Magnetic nanoparticles: design and characterization, toxicity and biocompatibility, pharmaceutical and biomedical applications. Chem Rev. 2012;112(11):5818–5878. doi: 10.1021/cr300068p. [DOI] [PubMed] [Google Scholar]
- 15.Yoo DW, Lee JH, Shin TH, Cheon JW. Theranostic magnetic nanoparticles. Accounts Chem Res. 2011;44(10):863–874. doi: 10.1021/ar200085c. [DOI] [PubMed] [Google Scholar]
- 16.Colombo M, Carregal-Momero S, Casula MF, Gutierrez L, Morales MP, Bohm IB, Heverhagen JT, Prosperi D, Parak WJ. Biological applications of magnetic nanoparticles. Chem Soc Rev. 2012;41(11):4306–4334. doi: 10.1039/c2cs15337h. [DOI] [PubMed] [Google Scholar]
- 17.Lee SM, Song Y, Hong BJ, MacRenaris KW, Mastarone DJ, O’Halloran TV, Meade TJ, Nguyen ST. Modular polymer-caged nanobins as a theranostic platform with enhanced magnetic resonance relaxivity and pH-responsive drug release. Angew Chem. 2010;122(51):10156–10160. doi: 10.1002/anie.201004867. [DOI] [PMC free article] [PubMed] [Google Scholar]
- 18.Sanson C, Diou O, Thevenot J, Ibarboure E, Soum A, Brulet A, Miraux S, Thiaudiere E, Tan S, Brisson A, Dupuis V, Sandre O, Lecommandoux S. Doxorubicin loaded magnetic polymersomes: theranostic nanocarriers for MR imaging and magneto-chemotherapy. ACS Nano. 2011;5(2):1122–1140. doi: 10.1021/nn102762f. [DOI] [PubMed] [Google Scholar]
- 19.Chertok B, David AE, Yang VC. Magnetically-enabled and MR-monitored selective brain tumor protein delivery in rats via magnetic nanocarriers. Biomaterials. 2011;32(26):6245–6253. doi: 10.1016/j.biomaterials.2011.05.004. [DOI] [PMC free article] [PubMed] [Google Scholar]
- 20.Sun CR, Du K, Fang C, Bhattarai N, Veiseh O, Kievit F. PEG-mediated synthesis of highly dispersive multifunctional superparamagnetic nanoparticles: their physicochemical properties and function in vivo. ACS Nano. 2010;4(4):2402–2410. doi: 10.1021/nn100190v. [DOI] [PMC free article] [PubMed] [Google Scholar]
- 21.Torchilin V. Tumor delivery of macromolecular drugs based on the EPR effect. Adv Drug Deliver Rev. 2011;63(3):131–135. doi: 10.1016/j.addr.2010.03.011. [DOI] [PubMed] [Google Scholar]
- 22.Simkovic I, Laszlo JA, Thompson AR. Preparation of a weakly basic ion exchanger by crosslinking starch with epichlorohydrin in the presence of NHAOH. Carbohyd Polym. 1996;30(1):25–30. [Google Scholar]
- 23.Pittet MJ, Swirski FK, Reynolds F, Josephson L, Weissleder R. Labeling of immune cells for in vivo imaging using magnetofluorescent nanoparticles. Nat Protoc. 2006;1(1):73–79. doi: 10.1038/nprot.2006.11. [DOI] [PubMed] [Google Scholar]
- 24.Prochazkova S, Varum KM, Østgaard K. Quantitative determination of chitosans by ninhydrin. Carbohyd Pllym. 1999;38(2):115–122. [Google Scholar]
- 25.Skoog B. Determination of polyethylene glycols 4000 and 6000 in plasma protein preparations. Vox Sanguinis. 1979;37(6):345–349. doi: 10.1111/j.1423-0410.1979.tb02314.x. [DOI] [PubMed] [Google Scholar]
- 26.Kurfurst MM. Detection and molecular weight determination of polyethylene glycol-modified hirudin by staining after sodium dodecyl sulfate-polyacrylamide gel electrophoresis. Anal Chem. 1992;200(2):244–248. doi: 10.1016/0003-2697(92)90460-o. [DOI] [PubMed] [Google Scholar]
- 27.Ma SC, Fu B, Meyerhoff ME, Yang VC. Electrochemical sensor for heparin: further characterization and bioanalytical applications. Anal Chem. 1993;65(15):2078–2084. doi: 10.1021/ac00063a024. [DOI] [PubMed] [Google Scholar]
- 28.Chertok B, David AE, Yang VC. Polyethyleneimine-modified iron oxide nanoparticles for brain tumor drug delivery using magnetic targeting and intra-carotid administration. Biomaterials. 2010;31(24):6317–6324. doi: 10.1016/j.biomaterials.2010.04.043. [DOI] [PMC free article] [PubMed] [Google Scholar]
- 29.Cole AJ, David AE, Wang JX, Galban CJ, Hill HL, Yang VC. Magnetic brain tumor targeting and biodistribution of long-circulating PEG-modified, cross-linked starch-coated iron oxide nanoparticles. Biomaterials. 2011;32(26):2183–2193. doi: 10.1016/j.biomaterials.2011.05.024. [DOI] [PMC free article] [PubMed] [Google Scholar]
- 30.Richter H, Kettering M, Wiekhorst F, Steinhoff U, Hilger I, Trahms L. Magnetorelaxometry for localization and quantification of magnetic nanoparticles for thermal ablation studies. Phys Med Biol. 2010;55(3):624–634. doi: 10.1088/0031-9155/55/3/005. [DOI] [PubMed] [Google Scholar]
- 31.Xie J, Xu C, Kohler N, Hou Y, Sun S. Controlled PEGylation of monodisperse Fe3O4 nanoparticles for reduced non-specific uptake by macrophage cells. Adv Mater. 2007;19(20):3163–3166. [Google Scholar]
- 32.Singh S, Wu BM, Dunn JCY. The enhancement of VEGF-mediated angiogenesis by polycaprolactone scaffolds with surface cross-linked heparin. Biomaterials. 2011;32(8):2059–2069. doi: 10.1016/j.biomaterials.2010.11.038. [DOI] [PMC free article] [PubMed] [Google Scholar]


