

Abstract
Objective
To assess the relationship between pubertal progression and change in PN burden over time in pediatric and young adult patients with neurofibromatosis type 1 (NF1) and plexiform neurofibromas (PN).
Study design
Analyses accounted for sex, age, race, and chemotherapy. Forty-one patients with NF1 (15 female, 26 male) were studied at the National Cancer Institute (NCI). Tanner stage, testosterone, progesterone, estradiol, insulin-like growth factor −1, luteinizing hormone, and follicle stimulating hormone were assessed. Tumor volume was measured using Magnetic Resonance Imaging and lesion detection software developed at NIH. Patients were divided into two groups based upon whether they were actively progressing through puberty (n=16) or peri pubertal (n=25), and were followed for an average of 20 months. Tumor growth rates in the puberty and peri pubertal group were analyzed for a subset of patients.
Results
There was no statistically significant difference in tumor burden change over time (cc/kg/month) between the pubertal and peri pubertal group (−0.16 ± 0.34 vs. 0.03 ± 1.8, p=0.31), and in the PN growth rates pre and during puberty (p=0.90). Change in tumor volume/patient weight/time did not correlate with testosterone change/time in males or estradiol change/time in females.
Conclusion
These findings support that hormonal changes of puberty do not accelerate PN growth. Additional long-term follow up of patients is necessary to further characterize the interaction between puberty and tumor growth.
Keywords: Estradiol, Testosterone, Plexiform Neurofibromas, Tumor Burden, Genetic Disease
Studies have shown that the number and size of both cutaneous and PNs in patients with NF1 increase in pregnancy, with regression post-partum in some cases15,16,17. In the study by Dugoff and Sajansky, 64 out of 105 women report growth of new neurofibromas during pregnancy, 55 note enlargement of existing ones, and 19 observed no changes18. One case report describes a patient with a giant PN of the thigh that enlarged during pregnancy16. An increase in the number of cutaneous and subcutaneous neurofibromas first appear in adolescence and then continue to grow and develop late into adult life6,7,20. No studies have reported the natural history of PN during pubertal development.
In vitro analysis of the effects on sex steroids on neurofibromas has yielded conflicting results. The presence of progesterone receptor (PR) has been described in rat primary Schwann cell cultures and progesterone promotes the remyelination of injured peripheral nerves21. Androgen receptor (AR) seems to be present in the epineurial compartment. McLaughlin and Jacks found that 75% human neurofibromas expressed PR; of the different subtypes, 86% of the cutaneous neurofibromas were positive for PRs, and 50% of PN were positive22. In all cases PR expression localized to neurofibromin expressing, non-neoplastic cells, and not to neoplastic Schwann cells. None of the normal nerve samples showed PR expression. Estrogen receptor was detected in 5% of the samples22. It has also been documented that Schwann cells in rats express PRs as well as low levels of estrogen receptors that have increased proliferation rates in response to progesterone and estrogen when placed in an autocrine loop, which could have implications with re-myelination of nerves23. Investigation of Schwann cells enriched cutaneous xenografted human NF1 cells demonstrates that estrogen and progesterone increased growth of malignant peripheral nerve sheath tumors (MPNST); PN Schwann cell growth decreased in size, but the other three did not24.
Tumor burden and sex steroid levels have not been clearly evaluated in children and adolescents with NF1 as they progress through puberty. A common concern among patients and physicians is the question of whether puberty may lead to accelerated PN growth. Although it is known that dermal neurofibroma numbers increase during puberty, the impact on PN is undetermined. The objective of this project was to study the effects of the progression of puberty on PN burden in pediatric and young adult patients with NF1 and PNs while accounting for sex, age, race, and chemotherapeutic treatment. To measure puberty, several characteristics were considered including Tanner stage, age, as well as critical pubertal hormone levels including testosterone, progesterone, estradiol, insulin-like growth factor −1 (IGF-1), luteinizing hormone (LH), and follicle stimulating hormone (FSH). We hypothesized that tumor burden might progress more rapidly during puberty, possibly due to the increase of certain growth factors and gonadal steroids.
Methods
Figure 1 shows a patient with a PN and the corresponding MRI. Data are obtained from 41 pediatric and adolescent patients with NF1 (15 female) enrolled in the National Cancer Institute (NCI) NF1 Natural History Study for children, adolescents, and young adults. Study evaluations were approved by the NCI Institutional Review Board, and informed consent was obtained from the legal guardians of all participants. Patients ≤ 35 years old with a clinical diagnosis of NF1 or with a confirmed NF1 mutation are enrolled on the study and undergo serial detailed clinical evaluation for signs and symptoms of NF1, endocrine evaluation, laboratory evaluations, and MRI imaging of NF1 related tumor burden using whole body MRI and MRI of individual PN. This analysis only included children and young adults with PN. Patients were divided into groups based on sex and pubertal status. Patients were considered to be progressing through puberty if they were within the age range of 9 – 16 years as well as having changed Tanner stages during subsequent protocol visits. These patients were placed in the “pubertal group”. Anyone above or below the age range and/or who remained fixed in either Tanner stage I or V within the study period was considered peri pubertal and was considered in a separate group, “peri pubertal” for comparison. The age ranges of the patient cohort in the pubertal group was 7 through 20 years old, and the peri pubertal group age range was 6 to 11 and 17 through 33 years old. For the analysis, PN burden per patient weight was determined using volumetric MRI analysis as previously described25. During protocol visits, hormonal measurements were performed via chemiluminescence immunoassay including testosterone in males, estradiol in females, progesterone, IGF-1, LH and FSH levels in all patients. For the IGF-1 measurement a Z-score was calculated to take into account age- and sex-adjusted values. The initial visit represented the patient’s first evaluation of PN tumor burden as well as hormonal levels. The final visit was the patient’s most recent complete evaluation. The difference between these visits were calculated and used in other computations. Change over time in all of the measured hormonal values reflects their change between initial and final visit divided by the change in time for the same period.
Figure 1.
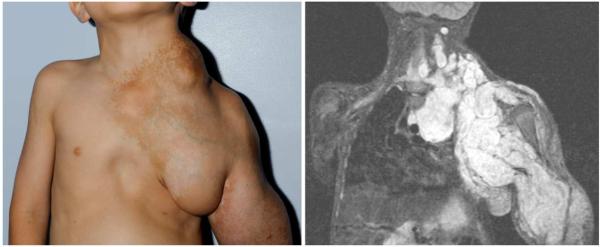
Pediatric patient with NF1 and large plexiform neurofibroma affecting the neck, chest and arm and corresponding magnetic resonance imaging study.
For comparison of continuous data between the pubertal and peri pubertal groups, t-tests or Wilcoxon rank-sum tests were used. Paired analyses were used for the paired comparisons of IGF-1 and IGF-1 Z-scores. Pearson or Spearman correlation coefficients were used for correlation analyses, and categorical data between groups were compared by Fisher exact tests. Data are presented as mean ± SD, unless otherwise indicated and were analyzed using SAS system software version 9.2 (SAS Institute, Inc., Cary, NC). A two-sided P≤0.05 was considered statistically significant. To assess for possible confounding factors related to previous or concomitant treatments, the data were analyzed with and without the patients that have received investigational treatments for their PNs.
For the subset of patients with extended serial MRI studies available covering the time period prior to onset and during puberty, we evaluated changes in PN growth rate for each patient using linear regression analysis. Separate slopes of PN growth were generated for PN growth before and after the onset of puberty. Because the onset of puberty could not be determined for all patients, 9 and 11 years were chosen as arbitrary cut-offs. A two-tailed Wilcoxon signed rank test was used to determine whether slopes of younger and older stages were different and to compare the difference of the difference in slope pairs before versus after age 9 and 11 years.
Results
The patients average height SDS score was −0.7 ± 1.1 at the time of their initial evaluation (Table I). Four of 41 of the patients with NF-1 (10%) fell ≥ 2 SD below the reference population mean for height. Within the pubertal and peri pubertal group, 56% and 52%, respectively, had been or were currently enrolled in one or multiple clinical trials with investigational drugs used to treat their PN. The average length of follow up was 17.3 ± 6.7 months for the pubertal group and 21.7 ± 17.1 months for the peri pubertal group, and were similar between groups. Months of study follow-up were not statistically significantly different between those on PN investigational treatments (n=22) versus those who were not (n=19).
There was no statistically significant difference in tumor burden change over time (mL/kg/month) between the pubertal and peri pubertal group (−0.16 ± 0.34 vs. 0.03 ± 1.8, p=0.31; Table II). This remained the case when the analysis was restricted to only patients who were naive to investigational therapies for PN. Change in PN burden over time did not correlate with testosterone change over time in the males of the either the pubertal or peri pubertal group. Tumor burden change over time was also not correlated with estradiol change over time in the females of either the pubertal or peri pubertal groups. There was no statistically significant correlation with progesterone change over time in either males or females within the pubertal or peri pubertal group.
Patient biochemical data at the initial and final visits are shown in Table 2. Testosterone change over time in males were higher in the pubertal (delta 92.6 ± 159.8) compared with the peri pubertal (delta −5.6 ± 14.4) groups (p<0.001; Table II). When this analysis was repeated without patients that had received treatment, the difference remained statistically significant (p=0.009) with higher values of change over time in the pubertal group (delta 42.2 ± 24.0) compared with the peri pubertal group (delta −13.6 ± 20.9). The mean levels of estradiol change over time were similar between groups (Table II). No other differences in hormonal measurements over time were noted between groups.
Table 2.
Hormonal and Plexiform Neurofibroma Measurements at Initial and Final Visits by Pubertal Status.
| Pubertal Group (n=16) |
Peri Pubertal Group (n=26) |
|||
|---|---|---|---|---|
| Female | Male | Female | Male | |
| Initial Age (years) | 12.5 ± 2.7 | 10.7 ± 3.0 | 14.7 ± 8.7 | 15.7 ± 7.1 |
| Final Age (years) | 13.6 ± 2.8 | 12.3 ± 3.1 | 16.1 ± 8.5 | 17.4 ± 6.9 |
|
Initial Testosterone
(ng/dL) |
- | 49.0 ± 39.9 | - | 429.9 ± 427.0 |
|
Final Testosterone
(ng/dL) |
- | 292.9 ± 216.4 | - | 353.6 ± 281.0 |
| Initial Estradiol (pg/dL) | 24.6 ± 28.3 | - | 25.2 ± 36.2 | - |
|
Final Estradiol
(pg/dL) |
85.2 ± 123.4 | - | 40.6 ± 73.0 | - |
|
Initial Progesterone
(ng/mL) |
0.40 ± 0.00 | 0.15 ± 0.15 | 0.74 ± 1.37 | 0.25 ± 0.20 |
|
Final Progesterone
(ng/mL) |
0.40 ± 0.16 | 0.77 ± 1.84 | 0.49 ± 0.72 | 0.39 ± 0.16 |
| Initial IGF-1 (ng/mL) | 278 ± 100.9 | 211.4 ± 123.2 | 181.0 ± 70.0 | 255.0 ± 162.1 |
| Final IGF-1 (ng/mL) | 238.8 ± 121.4 | 303.6 ± 125.2 | 173.1 ± 100.4 | 229.2 ± 159.1 |
| Initial LH (U/L) | 2.8 ± 4.2 | 1.1 ± 0.8 | 1.5 ± 3.1 | 2.2 ± 2.0 |
| Final LH (U/L) | 14.7 ± 27.8 | 2.8 ± 1.6 | 2.6 ± 3.8 | 3.1 ± 2.7 |
| Initial FSH (U/L) | 3.2 ± 1.8 | 2.0 ± 0.9 | 2.4 ± 2.2 | 2.7 ± 2.6 |
| Final FSH (U/L) | 6.0 ± 3.7 | 3.8 ± 1.9 | 3.1 ± 2.3 | 2.8 ± 1.6 |
|
Initial tumor volume on
MRI (mL) (median, range) |
631 (157 - 2,089) | 516 (27 - 4,192) | 674 (167 - 3,288) | 836 (33 - 4,426) |
|
Final tumor volume on
MRI (mL) (median, range) |
698 (173 - 2,377) | 481 (27 - 5,608) | 738 (9 - 3,465) | 990 (35 - 4,314) |
|
Initial Tumor Burden
/patient body weight (mL/kg) |
24.0 ± 23.9 | 31.2 ± 35.7 | 27.2 ± 22.7 | 23.0 ± 22.7 |
|
Final Tumor Burden
/patient body weight (mL/kg) |
24.5 ± 24.0 | 28.3 ± 35.6 | 23.6 ± 22.5 | 25.1 ± 25.2 |
All data are mean ± standard deviation unless otherwise indicated
For 16 patients (5 female, 11 male), slopes of PN growth rates pre and during puberty could be calculated. The median age at the time of the first MRI was 6.4 years (range, 3.3-8.5 years), and the median follow-up time was 7.6 years (range, 5.4-9.1 years). For most patients PN growth rate appeared constant over time (Figure 2). Figure 3 shows that there was no significant difference in the slope of PN growth before and after age 9 (p=0.90), or before and after age 11 (p=0.98). The differences were the same for the age cut off of 9 years and 11 years (p=0.91) (Figure 3).
Figure 2.
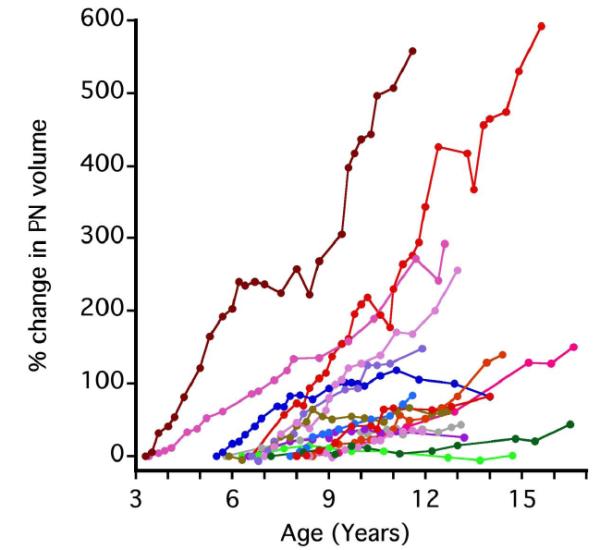
Percent change in plexiform neurofibroma volume over time (n=16) For most patients, the rate of PN growth appears constant without change in slope during adolescence.
Figure 3.
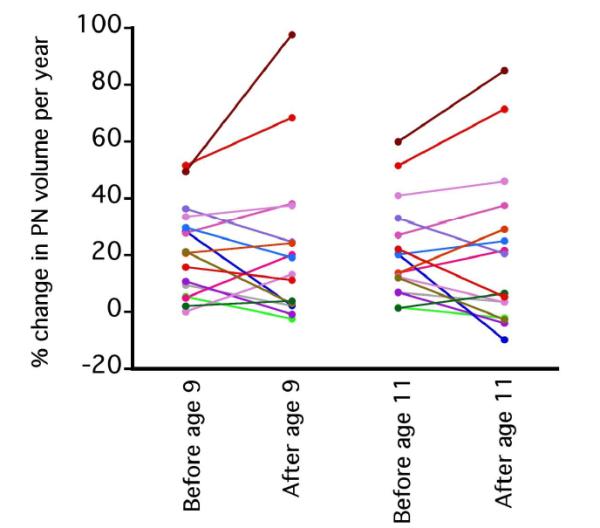
Paired comparison of plexiform neurofibroma growth slopes (n=16). No significant difference was found in the slope of PN growth before and after age 9 (p=0.90), or before and after age 11 (p=0.98).
Discussion
The contribution of hormonal changes to growth of NF1 related tumors has not been well described, but several reports document an increase of NF1 tumors during pregnancy, a period of hormonal change15,16,18. An increase in the number of dermal neurofibromas is observed during puberty with continued development of new neurofibromas throughout life7. Patients and physicians remain concerned about the possible adverse effects of puberty on PN tumor burden. Knowledge about the natural history of PN during normal childhood growth and development is crucial to inform patients about what to expect during puberty, to interpret the impact of medical interventions directed at PN growth, and to design meaningful clinical trials. Our study analyzes steroid hormone levels of patients with NF1 in the context of their PN tumor burden analyzed using a sensitive method of volumetric MRI analysis during puberty as well as peri puberty.
We did not find any relationship between hormonal markers of puberty and changes in tumor burden in our patient cohort. The lack of any statistically significant difference between tumor burden changes over time in the pubertal vs. peri pubertal groups may indicate that puberty does not have a substantial effect on PN growth. In vitro studies of steroid hormones in NF1 tumors suggests that their effect are not sex specific and might only have an effect on certain subtypes and patients26. This suggests that any pubertal effects may be due to other environmental and epigenetic alterations specific to each patient case because of tumor heterogeneity. Our analysis of a subset of patients with extended MRI studies covering the time period before and during puberty also did not demonstrate an increase in the PN growth rate during puberty. In some patients it appeared that the PN growth rate decreased during puberty (Figures 2 and 3). A number of studies have described that the growth of PNs is inversely correlated with age, especially in younger patients with NF110,27,28. In an earlier study of 49 patients (median age 8.3 years; 30 male) from our group, patients <8 years old experienced a 21.2% median increase in PN volume per year whereas older children experienced a median change per year of 8.4%27. A larger analysis of 171 patients with serial whole body MRI exams showed that growth rate of tumors was inversely correlated with age10. A possible implication of these findings could be that after rapid growth seen at a young age the PN growth rate decreases by the time patients reach adulthood. Additional follow-up of patients enrolled in our study will allow for characterization of changes in PN growth rates as patients reach adulthood.
Our study has several limitations: Due to the NIH referral pattern patients with NF1seen at the clinical center come specifically for treatment of their PN, making our patient cohort different from the general NF1 population. Another limitation of our study is the potential effects of tumor therapies on tumor growth and pubertal progression. Within our patient cohort half of these individuals had been or were enrolled in clinical trials with investigational agents directed at their PN, but the results were similar when the cohort was limited to those not receiving tumor therapy treatments. Finally, several of these medical treatments have the potential to negatively impact pubertal progression as well as linear body growth. The increase in testosterone levels over time in the pubertal group vs. the peri pubertal male group supports the clinical observation that these patients were in fact going through puberty during the study. Estradiol changes over time are more difficult to capture not only because of fluctuations with the menstrual cycle, but also because current assays fail to accurately measure levels at the low end of the normal range29.
Understanding and identifying how puberty may impact tumor burden in patients with NF1 is critical in order to provide improved patient care. The biochemical and clinical results of our study do not support a causal relationship between puberty and PN growth stimulation, and do not demonstrate an increase in PN growth rates during puberty. Although these findings are considered preliminary due to the small sample size they are hypothesis generating and may have utility in counseling parents and patients with NF1 and PN. Further studies clarifying the relationship between PN progression and overall child and adolescent growth and development are necessary. Additional patients are being enrolled on the NF1 natural history study and follow-up data of a larger patient cohort will provide additional information.
Table 1.
Patient Characteristics Based on Pubertal Status
| Pubertal Group (n=16) n (%) |
Peri Pubertal Group (n=25) n (%) |
|
|---|---|---|
|
Sex
Females (n=15) Males (n=26) |
5 (31%) 11 (69%) |
10 (40%) 15 (60%) |
|
Race
African American (n=2) Asian (n=1) Hispanic (n=2) White (n=35) Other (n=1) |
1 (6%) 0(0%) 1(6%) 13 (81%) 1 (6%) |
1 (4%) 1 (4%) 1 (4%) 22 (88%) 0 (0%) |
|
Months Between Initial
and Final Visits mean ± SD |
17.3 ± 6.7 | 21.7 ± 17.1 |
|
Treatment for PN
Yes (n = 22) |
9 (56%) | 13 (52%) |
|
Plexiform tumor volume
mL (median, range) |
516 (27 - 4,192) | 836 (33 - 4,426) |
|
Tumor volume / patient
body weight mL/kg, mean± SD |
29.2 ± 32.3 | 24.5 ± 22.2 |
Acknowledgments
We thank Andrea Gillespie, RN, who contributed to the study as the lead nurse who managed patient visits and played a role in the collection of patient data.
Supported by the Intramural programs of the National Cancer Institute and the Eunice Kennedy Shriver National Institute of Child Health and Human Development.
Abbreviations
- NF1
Neurofibromatosis Type I
- PN
Plexiform neurofibromas
- PR
Progesterone Receptor
- MPNST
Malignant Peripheral Nerve Sheath Tumors
- IGF-1
Insulin-Like Growth Factor −1
- LH
Luteinizing Hormone
- FSH
Follicle Stimulating Hormone
- NCI
National Cancer Institute
- MRI
Magnetic Resonance Image
Footnotes
Publisher's Disclaimer: This is a PDF file of an unedited manuscript that has been accepted for publication. As a service to our customers we are providing this early version of the manuscript. The manuscript will undergo copyediting, typesetting, and review of the resulting proof before it is published in its final citable form. Please note that during the production process errors may be discovered which could affect the content, and all legal disclaimers that apply to the journal pertain.
The authors declare no conflicts of interest.
References
- 1.Ward BA, Gutmann DH. Neurofibromatosis 1: from lab bench to clinic. Pediatr Neurol. 2005;32:221–228. doi: 10.1016/j.pediatrneurol.2004.11.002. [DOI] [PubMed] [Google Scholar]
- 2.Ars E, Serra E, Garcia J, Kruyer H, Gaona A, Lazaro C, Estivill X. Mutations affecting mRNA splicing are the most common molecular defects in patients with neurofibromatosis type 1. Hum Mol Genet. 2000;9:237–247. doi: 10.1093/hmg/9.2.237. [DOI] [PubMed] [Google Scholar]
- 3.Lynch TM, Gutmann DH. Neurofibromatosis 1. Neurol Clin. 2002;20:841–865. doi: 10.1016/s0733-8619(01)00019-6. [DOI] [PubMed] [Google Scholar]
- 4.Friedman JM. Neurofibromatosis 1: clinical manifestations and diagnostic criteria. J Child Neurol. 2002;17:548–554. doi: 10.1177/088307380201700802. discussion 571-542, 646-551. [DOI] [PubMed] [Google Scholar]
- 5.Gutmann DH, Aylsworth A, Carey JC, Korf B, Marks J, Pyeritz RE, Rubenstein A, Viskochil D. The diagnostic evaluation and multidisciplinary management of neurofibromatosis 1 and neurofibromatosis 2. JAMA. 1997;278:51–57. [PubMed] [Google Scholar]
- 6.Duong TA, Bastuji-Garin S, Valeyrie-Allanore L, Sbidian E, Ferkal S, Wolkenstein P. Evolving pattern with age of cutaneous signs in neurofibromatosis type 1: a cross-sectional study of 728 patients. Dermatology. 2011;222:269–273. doi: 10.1159/000327379. [DOI] [PubMed] [Google Scholar]
- 7.Huson S. Neurofibromatosis: emerging phenotypes, mechanisms and management. Clin Med. 2008;8:611–617. doi: 10.7861/clinmedicine.8-6-611. [DOI] [PMC free article] [PubMed] [Google Scholar]
- 8.Korf BR. Plexiform neurofibromas. Am J Med Genet. 1999;89:31–37. doi: 10.1002/(sici)1096-8628(19990326)89:1<31::aid-ajmg7>3.0.co;2-w. [DOI] [PubMed] [Google Scholar]
- 9.Kim A, Gillespie A, Dombi E, Goodwin A, Goodspeed W, Fox E, Balis FM, Widemann BC. Characteristics of children enrolled in treatment trials for NF1-related plexiform neurofibromas. Neurology. 2009;73:1273–1279. doi: 10.1212/WNL.0b013e3181bd1326. [DOI] [PMC free article] [PubMed] [Google Scholar]
- 10.Nguyen R, Dombi E, Widemann BC, Solomon J, Fuensterer C, Kluwe L, Friedman JM, Mautner VF. Growth dynamics of plexiform neurofibromas: a retrospective cohort study of 201 patients with neurofibromatosis 1. Orphanet J Rare Dis. 2012;7:75. doi: 10.1186/1750-1172-7-75. [DOI] [PMC free article] [PubMed] [Google Scholar]
- 11.Davies C, Godwin J, Gray R, Clarke M, Cutter D, Darby S, McGale P, Pan HC, Taylor C, Wang YC, et al. Relevance of breast cancer hormone receptors and other factors to the efficacy of adjuvant tamoxifen: patient-level meta-analysis of randomised trials. Lancet. 2011;378:771–784. doi: 10.1016/S0140-6736(11)60993-8. [DOI] [PMC free article] [PubMed] [Google Scholar]
- 12.Kim JJ, Chapman-Davis E. Role of progesterone in endometrial cancer. Semin Reprod Med. 2010;28:81–90. doi: 10.1055/s-0029-1242998. [DOI] [PMC free article] [PubMed] [Google Scholar]
- 13.Ricke WA, Ishii K, Ricke EA, Simko J, Wang Y, Hayward SW, Cunha GR. Steroid hormones stimulate human prostate cancer progression and metastasis. Int J Cancer. 2006;118:2123–2131. doi: 10.1002/ijc.21614. [DOI] [PubMed] [Google Scholar]
- 14.Villa E. Role of estrogen in liver cancer. Womens Health (Lond Engl) 2008;4:41–50. doi: 10.2217/17455057.4.1.41. [DOI] [PubMed] [Google Scholar]
- 15.Dugoff L, Sujansky E. Neurofibromatosis type 1 and pregnancy. American journal of medical genetics. 1996b;66:7–10. doi: 10.1002/(SICI)1096-8628(19961202)66:1<7::AID-AJMG2>3.0.CO;2-R. [DOI] [PubMed] [Google Scholar]
- 16.Isikoglu M, Has R, Korkmaz D, Bebek N. Plexiform neurofibroma during and after pregnancy. Arch Gynecol Obstet. 2002;267:41–42. doi: 10.1007/s004040100239. [DOI] [PubMed] [Google Scholar]
- 17.Roth TM, Petty EM, Barald KF. The role of steroid hormones in the NF1 phenotype: focus on pregnancy. Am J Med Genet A. 2008;146A:1624–1633. doi: 10.1002/ajmg.a.32301. [DOI] [PubMed] [Google Scholar]
- 18.Dugoff L, Sujansky E. Neurofibromatosis type 1 and pregnancy. Am J Med Genet. 1996a;66:7–10. doi: 10.1002/(SICI)1096-8628(19961202)66:1<7::AID-AJMG2>3.0.CO;2-R. [DOI] [PubMed] [Google Scholar]
- 19.Lammert M, Mautner VF, Kluwe L. Do hormonal contraceptives stimulate growth of neurofibromas? A survey on 59 NF1 patients. BMC Cancer. 2005;5:16. doi: 10.1186/1471-2407-5-16. [DOI] [PMC free article] [PubMed] [Google Scholar]
- 20.Bonnemaison E, Roze-Abert B, Lorette G, Sirinelli D, Boscq M, Mazjoub S, De Courtivron B, Bonnard C, Despert F, Toutain A, et al. Neurofibromatosis type 1 complications in the pediatric age: follow-up of a hundred cases. Arch Pediatr. 2006;13:1009–1014. doi: 10.1016/j.arcped.2006.03.149. [DOI] [PubMed] [Google Scholar]
- 21.Azcoitia I, Leonelli E, Magnaghi V, Veiga S, Garcia-Segura LM, Melcangi RC. Progesterone and its derivatives dihydroprogesterone and tetrahydroprogesterone reduce myelin fiber morphological abnormalities and myelin fiber loss in the sciatic nerve of aged rats. Neurobiol Aging. 2003;24:853–860. doi: 10.1016/s0197-4580(02)00234-8. [DOI] [PubMed] [Google Scholar]
- 22.McLaughlin ME, Jacks T. Progesterone receptor expression in neurofibromas. Cancer Res. 2003;63:752–755. [PubMed] [Google Scholar]
- 23.Jung-Testas I, Schumacher M, Robel P, Baulieu EE. Demonstration of progesterone receptors in rat Schwann cells. The Journal of steroid biochemistry and molecular biology. 1996;58:77–82. doi: 10.1016/0960-0760(96)00009-x. [DOI] [PubMed] [Google Scholar]
- 24.Li H, Zhang X, Fishbein L, Kweh F, Campbell-Thompson M, Perrin GQ, Muir D, Wallace M. Analysis of steroid hormone effects on xenografted human NF1 tumor schwann cells. Cancer biology & therapy. 2010;10:758–764. doi: 10.4161/cbt.10.8.12878. [DOI] [PMC free article] [PubMed] [Google Scholar]
- 25.Solomon J, Warren K, Dombi E, Patronas N, Widemann B. Automated detection and volume measurement of plexiform neurofibromas in neurofibromatosis 1 using magnetic resonance imaging. Comput Med Imaging Graph. 2004;28:257–265. doi: 10.1016/j.compmedimag.2004.03.002. [DOI] [PubMed] [Google Scholar]
- 26.Fishbein L, Zhang X, Fisher LB, Li H, Campbell-Thompson M, Yachnis A, Rubenstein A, Muir D, Wallace MR. In vitro studies of steroid hormones in neurofibromatosis 1 tumors and Schwann cells. Mol Carcinog. 2007;46:512–523. doi: 10.1002/mc.20236. [DOI] [PubMed] [Google Scholar]
- 27.Dombi E, Solomon J, Gillespie AJ, Fox E, Balis FM, Patronas N, Korf BR, Babovic-Vuksanovic D, Packer RJ, Belasco J, et al. NF1 plexiform neurofibroma growth rate by volumetric MRI: relationship to age and body weight. Neurology. 2007;68:643–647. doi: 10.1212/01.wnl.0000250332.89420.e6. [DOI] [PubMed] [Google Scholar]
- 28.Tucker T, Friedman JM, Friedrich RE, Wenzel R, Funsterer C, Mautner VF. Longitudinal study of neurofibromatosis 1 associated plexiform neurofibromas. J Med Genet. 2009;46:81–85. doi: 10.1136/jmg.2008.061051. [DOI] [PubMed] [Google Scholar]
- 29.Cao ZM, Swift TA, West CA, Rosano TG, Rej R. Immunoassay of estradiol: Unanticipated suppression by unconjugated estriol. Clinical Chemistry. 2004;50:160–165. doi: 10.1373/clinchem.2003.023325. [DOI] [PubMed] [Google Scholar]