

Abstract
Synthetic molecule microarrays, consisting of many different compounds spotted onto a planar surface such as modified glass or cellulose, have proven to be useful tools for the multiplexed analysis of small molecule- and peptide-protein interactions. However, these arrays are technically difficult to manufacture and use with high reproducibility and require specialized equipment. Here we report a more convenient alternative comprised of color-encoded beads that display a small molecule protein ligand on the surface. Quantitative, multiplexed assay of protein binding to up to 24 different ligands can be achieved using a common flow cytometer for the readout. This technology should be useful for evaluating hits from library screening efforts, the determination of structure activity relationships and for certain types of serological analyses.
Multiplexed small molecule-protein binding assays are often carried out using microarray technology in which some number of small molecules are spotted onto a chemically-modified planar surface, such as a glass slide.(1–5) The protein(s) of interest are exposed to the slide and bound material is visualized, usually via a labeled antibody that recognizes the protein(s) of interest or via a label that is covalently attached to the protein itself. Complex arrays displaying thousands of small molecules have been employed as a primary library-screening platform. Ligands for transcription factors,(6) antibodies(7–9) and other proteins(10–12) have been discovered in this fashion. Arrays displaying thousands of random peptides have been employed to obtain serum antibody “signatures” of possible diagnostic utility.(13–17) Smaller arrays comprised of tens to hundreds of ligands have been used to stratify hits from larger library screens conducted on some other platform. Similarly, structure activity relationships can be gleaned by array-based, multiplexed analysis of derivatives of protein- or RNA-binding ligands.(18–22) In the future, there is the hope that if one has high affinity synthetic ligands for many serum proteins involved in disease states, that arrays of these species might be employed for clinical diagnostics.
While planar glass arrays of peptides or non-peptidic small molecules can be effective in these applications, their creation is technically demanding and requires sophisticated instruments, including robotic liquid handlers and spotters. Therefore, we were interested in developing simpler alternatives to this technology for the multiplexed analysis of small molecule- protein complexes. In considering this problem, we were influenced by precedents in the fields of genomics and proteomics where “liquid arrays” have emerged as an alternative to the microarray platform. Liquid arrays employ small, polystyrene microspheres, also known as beads, as the scaffold to which the capture agent is immobilized. Unlike the planar microarrays, where the identity of the ligand is defined spatially, liquid arrays are employed in a batch mode whereby beads displaying different ligands are added to a single sample. Therefore, an encoding strategy is required. For example, the popular Luminex technology (http://www.luminexcorp.com) employs 5.3 μm polystyrene microspheres that display antibody capture agents and are encoded by a specific ratio of two organic dyes that are physically adsorbed into the hydrophobic interior of the beads. Binding of the analyte of interest to each bead is measured by addition of a sandwich antibody tagged with a third color dye. The beads are analyzed using a proprietary flow cytometer-like instrument with lasers that measure the level of the sandwich antibody and identify the encoding ratio of dyes on each bead as they pass single file past the detector. Thus, the Luminex system is a potentially attractive alternative to planar arrays for making multiplexed measurements of small molecule-protein interactions. In reality however, there are problems with the application of this off the shelf technology to the analysis of small molecule-protein complexes. First, the encoded beads are expensive and not well suited as a platform for synthesis. Since the encoding dyes are only adsorbed in the beads, they leach out when the beads are suspended in organic solvents in order to link small molecules to their surface (T.M.D., unpublished results). Second, like any polystyrene-based bead platform, there is a high level of non-specific protein binding. This can be tolerated if one is using high affinity capture agents such as antibodies and detecting bound analyte via a sandwich assay. But typically lower affinity synthetic ligands and direct detection of bound proteins make this a much more serious issue with respect to sensitivity and accuracy. Therefore, we sought to combine the advantages of the Luminex platform with a less expensive, more organic chemistry-friendly solid support and encoding system. In this communication we describe the development of such a system that is capable of measuring up to 24 different small molecule-protein interactions simultaneously with excellent sensitivity and accuracy using inexpensive materials and a common flow cytometer for the readout.
TentaGel beads (Rapp Polymere GmbH) are a superior support for analyzing interactions between bead-displayed small molecules and proteins.(23–25) TentaGel beads are comprised of an amine-functionalized polystyrene core onto which is grafted a thick layer of amine-terminated polyethylene glycol (PEG). The PEG layer grossly reduces the level of non-specific protein binding to the beads. Lam and co-workers have published a clever protocol by which the hydrophobic interior and hydrophilic exterior of the TentaGel beads can be modified differentially and they have used this strategy to encode synthetic molecules on the surface of the bead with internal mass spectrometry-sequencable tags.(24, 26–28) Thus, we hypothesized that the interior of TentaGel beads could be modified covalently with a particular mixture of encoding dyes. As such, the protein ligand would never “see” these hydrophobic dyes and they would be unable to leach out of the bead during subsequent synthetic operations in organic solvents. The small molecule capture agent could then be coupled to, or synthesized on, the surface-accessible PEG-NH2 layer. 10 μm TentaGel beads are available and are small enough to pass through a standard flow cytometer, allowing for the analysis of thousands of beads per second (Figure 1).
Figure 1.

Overview of the multiplexed liquid array platform. a) Representation of the biphasic microsphere construct with internally-labeled dyes and externally-immobilized synthetic molecule ligand. b) Illustration of bead sorting and fluorescence “reading” using a common flow cytometer requiring two excitation lasers and three detectors. c) Example FACS dot plot showing the ratiometric emission intensities of the two encoding dyes. Each subpopulation can be separated from a batch of differentially dyed microspheres. d) Upon gating a designated subpopulation, binding can be quantified as the relative intensity of a reporter fluorochrome (dye 3). e) FACS dot plot of Pacific Orange vs. Pacific Blue emission intensities for a batch of 24 subpopulations of encoded microspheres.
We first examined whether 10 μm TentaGel beads are amenable to the described biphasic bead encoding strategy. We used confocal microscopy to show that beads comprised of externally-labeled FITC and internally-labeled Texas red exhibited a clear separation of the two fluorochromes (Supplementary Figure S1). Having demonstrated that 10 μm beads can be topologically segregated, we arbitrarily chose to encode 24 subpopulations of beads using our encoding strategy wherein the ratios of internally labeled Pacific Orange and Pacific Blue dyes were varied. To achieve 24 non-overlapping populations, we created 8 ratios of 3 different stock solutions of Pacific Orange and Pacific Blue activated esters. After protecting the amine groups in the hydrophilic surface layer of the beads, a small fraction of the interior amines were covalently modified with the activated esters of Pacific Blue and Pacific Orange. These dyes were chosen because each absorbs at the same wavelength, but have very well-separated emission maxima (Supplementary Figure S2). Encoding was achieved by both altering the absolute concentration of the dye as well as the ratio between the two. As shown in Fig. 1E, the 24 differentially-encoded bead populations were readily visualized on the FACS plot. Indeed, the degree of separation suggests that there is room for a further increase in the number of differentially encoded beads, which could be achieved by using more than three stock solutions, more than eight ratios of the dyes, or both. However, we anticipate that a 24 “color” assay will be sufficient for many applications and so have not explored the practicality of this. Of course, if one wished to examine more than 24 small molecule-protein interactions in this fashion, more than one well of sample could be employed and 24 different beads could be incubated with sample in each well.
Having established the encoding capabilities of the microspheres, we next turned to the issue of multiplexed protein detection using ligands immobilized to the surface layer of the coded beads. We chose as a target chicken IgY antibodies from an animal immunized with a synthetic molecule, specifically a peptoid called ADP3 (29) (Figure 2A). We performed a “methyl scan”(30) on ADP3 to determine what side chains in ADP3 are critical for binding to the anti- ADP3 IgY antibodies. Each side chain, in turn, in ADP3 was replaced by a methyl group (excluding cysteine, Supplementary Figure S3). Titrations monitored by fluorescence polarization (FP) spectroscopy were performed to determine the affinity of each of these eight variants for anti-ADP3 IgY. Binding was severely compromised only when the position 2 side chain or the position 7 side chain was replaced with a methyl substituent, indicating that these residues are particularly important for molecular recognition (Figure 2B). The other substitutions had either no effect or reduced binding only modestly. We also constructed an ADP3 variant that possessed a methyl substituent at every position except for positions 2 and 7, which contained the original side chains. This variant still bound to the IgY antibodies, but showed a significantly reduced affinity, indicating that the sum of eliminating several minor contacts results in a large effect on binding. With these data in hand, we asked if similar results could be obtained in a single multiplexed experiment using encoded TentaGel beads.
Figure 2.

Evaluation of the multiplexed capabilities of the dye-encoded microspheres. a) Chemical structure of ADP3 with a free cysteine. Position labels indicate the side chains substituted for the methyl scan derivatives. b) Binding isotherms generated for ADP3 and all methyl derivatives of ADP3 using fluorescence polarization. c) Dot plot of Pacific Orange vs. Pacific Blue emission intensities for the encoded subpopulations containing ADP3 and selected methyl derivatives. d) Binding isotherms generated for each of the methyl derivatives using the microsphere immunoassay. e) Fluorescence polarization of fluorescein-labeled BBHit3 when incubated with monovalent PAFAH-1B2 or a negative control protein. f) Binding isotherms for BBHit3 binding to PAFAH-1B2 or a negative control protein using the microsphere immunoassay.
Seven dye-encoded bead populations were modified with either ADP3-Cys or one of six derivatives after deprotection of the surface amines, they were primed by coupling of the activated ester of 2-bromoacetic acid (Figure 2C). These six derivatives were the two single methyl derivatives with poor binding (2-Me and 7-Me), the hexamethyl derivative and three methyl derivatives that bound nearly as well as ADP3. The bead populations were mixed together and added to solutions comprised of serially diluted anti-ADP3 IgY spiked into PBS Starting Block. After washing, Texas red-conjugated secondary antibody was added. After incubation and another washing step, the beads were analyzed on a flow cytometer. Gratifyingly the trends observed for the ADP3-IgY binding affinity in the microsphere assay mirrored those observed using FP (Figure 2D). ADP3-2Me, ADP3-7ME and the hexamethyl derivative all bound the antibody with much lower affinity than ADP3 itself, while the other methyl derivatives bound the IgY with only modestly lower affinity.
Interestingly, the KD values determined using the microsphere assay were lower, by about a factor of ten, than those derived from the FP data, indicating higher affinity binding on the bead support (Table 1). This trend was observed for antibody-antigen interactions over a wide range of KD values, including the nanomolar interaction between FLAG tag and the anti-FLAG monoclonal antibody (Supplementary Figure S4). Antibodies are bivalent molecules and thus it is possible that the beads allow for avidity-driven binding (i.e., two immobilized ADP3 molecules bind to a single IgY antibody). To test this idea, we conducted an experiment with a small molecule ligand that binds to a monovalent protein. For this, we chose the monomeric serine hydrolase PAFAH-1B2 that binds to the synthetic ligand BBHit3 with modest affinity (B. Sarma, B. Knuckley and T.K., in preparation). We monitored binding by monitoring fluorescence anisotropy of a fluorescein-labeled BBHit3 (Figure 2E). We then compared this binding affinity to the one determined by immobilizing BBHit3 to the TentaGel platform (Figure 2F). In this case, the KD values derived from the FP and TentaGel assays were almost identical within experimental error (Table 1). Thus, the clustered presentation of ligands in the PEG layer of the TentaGel beads appears to afford an avidity-driven boost in binding to bivalent antibodies.
Table 1.
Dissociation constants determined for small molecule binding probes and their targets.
| Variant | KD (FP assay, μM)a | KD (TentaGel assay, μM)a |
|---|---|---|
| ADP3 | 4.4 ± 1.1 | 0.5± 0.2 |
| ADP3-1Me | 2.0 ± 1.5 | ND |
| ADP3-2Me | DNS | DNS |
| ADP3-3Me | 2.2 ± 1.6 | 0.4 ± 0.2 |
| ADP3-4Me | 2.3 ± 1.9 | 0.4 ± 0.2 |
| ADP3-5Me | 3.4 ± 0.7 | 1.2 ± 0.5 |
| ADP3-6Me | 8.3 ± 4.3 | ND |
| ADP3-7Me | DNS | DNS |
| ADP3-8Me | 3.3 ± 2.5 | ND |
| ADP3-hexamethyl | DNS | DNS |
| FLAG | 0.090 | 0.008 |
| BBHit3 | 26.7 ± 11.7 | 17.3 ± 5.3 |
Reported KD for the ADP3 variants is an effective KD as the IgY has not been purified with respect to antigen specificity;
ND, Not Determined; DNS, Did Not Saturate
Given that serological measurements are particularly challenging with respect to interference from non-specific protein binding, we were interested to compare the TentaGel beads with Luminex microspheres in the hopes that the highly PEG-coated surface layer could both shield these nonspecific interactions and promote specific, avidity-driven binding. We assessed the utility of the TentaGel microspheres to detect anti-ADP3 IgY in chicken serum using immobilized ADP3. This experiment did not require bead encoding. 10 μm TentaGel beads were first primed by acylating the amine groups with an activated ester of 3-maleimidopropionic acid. ADP3 was then attached to the microspheres via Michael addition. Chicken serum (2 mg/mL total protein) was doped with IgY from ADP3-immunized chickens, or with nonspecific IgY as a negative control. After overnight incubation, the beads were washed and hybridized with phycoerythrin (PE)-conjugated anti-IgY secondary antibody, and binding of IgY to the beads was measured by monitoring PE emission of each bead by flow cytometry (Figure 3A). As expected, the microspheres incubated with chicken sera containing anti-ADP3 IgY exhibited binding saturation behavior, and a marked increase in intensity compared to the control IgY sample. Therefore, the TentaGel-based immunoassay was able to clearly differentiate between specific and nonspecific interactions.
Figure 3.
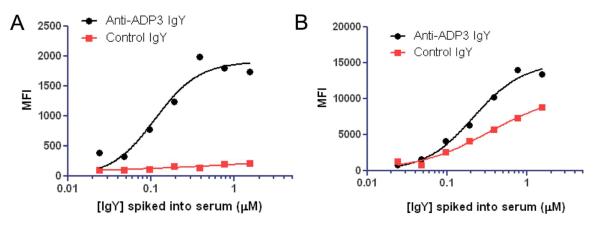
Comparison of Luminex vs. TentaGel platforms in serological measurements. a) Binding isotherms generated for the detection of anti-ADP3 IgY in chicken serum using ADP3 immobilized onto TentaGel microspheres. Binding was quantified by measuring the mean fluorescence intensity (MFI) of a PE-conjugated anti-IgY antibody. b) The same experiment was performed using ADP3 immobilized onto Luminex microspheres.
We proceeded to compare our liquid array platform with Luminex microspheres to ask if the PEG layer of TentaGel indeed exhibits a lower background signal due to the PEG surface coating. Because Luminex microspheres are sold with a terminal carboxylic acid, the linker between the bead and ADP3 differed in the directionality of the amide bond, however all other aspects of the experiment were performed similarly (Supplementary Figure S5). The apparent affinity of ADP3 for anti-ADP3 IgY was the same on the Luminex platform (KD = 0.3 ± 0.1) as it was on the TentaGel platform (KD= 0.2 ± 0.1), indicating that avidity effects are also operational on the Luminex surface. However, a signal only modestly lower than that seen for the anti-ADP3 antibody was observed when the ADP3-modified Luminex beads were exposed to serum lacking anti-ADP3 antibodies, presumably due to nonspecific interactions of other IgY antibodies with the Luminex resin. These data show that the suppression of non-specific binding due to the PEG layer on the TentaGel beads is a major advantage in this type of direct binding assay.
In conclusion, we have demonstrated the utility of a color-coded liquid bead array system that is convenient and effective for the multiplexed, quantitative measurement of synthetic molecule-protein interactions in complex biological mixtures. At least 24 independent measurements can be made in a multiplexed fashion in a single sample. The use of PEG-coated microspheres minimizes nonspecific binding that is encountered using traditional polystyrene surfaces when high serum concentrations are used. Attractive applications of this technology will include the characterization and optimization of protein ligands that have been identified in a primary screen, and in the detection of diagnostically useful immune complexes contained within sera.
Methods
All chemicals and solvents were purchased from commercial suppliers and used without further purification. HPLC grade solvents were used for purifications. All steps involving water utilized distilled water filtered through a Barnstead Nanopure filtration system (Thermo Scientific)
Confocal microscopy
10 mg of 10 μm TentaGel microspheres were equilibrated in water overnight. After swelling, the beads were topologically segregated (vide supra). Texas red sulfonyl chloride (25 μg, 40 nmol) dissolved in 250 μL DMF was added to the beads and shaken overnight. After washing the resin 5 times in DMF, the unreacted interior amines were capped by acylation using 20% acetic anhydride in DMF. The beads were washed (5 × 300 μL DMF) times and the exterior amines were deprotected in 20% piperidine. After washing the beads (5×300 μL DMF), a solution of fluorescein isothiocyanate (FITC, 250 μg, 0.64 μmol) in DMF was added to the beads and shaken overnight. The beads were washed in DMF (3 × 300 μL) the water (5 × 300 μL) and brought up into 100 μL water. 5 μL of the microsphere solution was co-spotted with 5 μL ProLong® Gold antifade reagent (Life Technologies) onto a glass microscope slide, sealed with a cover slip and dried overnight. Confocal microscopy was performed on an Olympus Fluoview 1000 confocal microscope at 100× magnification and analyzed using the F10-ASW 3.0 software.
TentaGel microsphere encoding
TentaGel microspheres (Rapp Polymere GmbH,), were topologically segregated using the method of Lam and coworkers.(31) 10 μm microspheres (0.05 g, 0.23 mmol/g) were incubated in water overnight. After centrifuging at 500 × g for 1 min, the supernatant was decanted. N-(9-Fluorenylmethoxycarbonyl) succinimide (Fmoc-Osu, 1.9 mg, 0.5 eq.) dissolved in 2.5 mL of a diethyl ether/dichloromethane (DCM) 50:50 mixture was added to the microspheres in a 5 mL centrifuge tube. The microspheres were shaken vigorously and vortexed and sonicated for 30 s each and rotated for 20 min thereafter. The microspheres were collected by centrifugation (500 × g) and washed 4 times in DMF (NOTE: In some cases, it may be necessary to add DMF to the diethyl ether/DCM solution to help pellet the microspheres during the first centrifugation step). After washing in DMF, the microspheres were re-equilibrated in DMF for 3 h. Failure to re-equilibrate the beads in DMF resulted in heterogeneous internal dye concentrations as indicated by a large range of microsphere internal dye intensities. The washed, equilibrated resin was aliquoted (2 mg) subpopulations into black centrifuge tubes and diluted to 200 μL volume with anhydrous DMF-Stock concentrations of the activated Pacific Blue and Pacific Orange NHS esters (Life Technologies) were prepared at 3 μM and 15 μM, respectively, and added in eight different ratios such that the total volume of all added dye solutions was 10 μL. The 8 ratios were obtained by addition of the following ratios of Pacific Orange and Pacific Blue to the microsphere aliquots, respectively: 0:100, 5:95, 10:90, 30:70, 50:50, 70:30, 90:10, 100:0. DIPEA (1 μL, 0.005 mmol) was added to the microsphere suspension to facilitate acylation. To produce up to 16 populations, the same eight ratios were applied using 9 μM Pacific Blue and 45 μM Pacific Orange as the fluorochrome stock concentrations. To achieve 24 populations, 27 μM and 135 μM Pacific Orange were added in the same ratios. It is necessary to optimize the ratios when purchasing new lots of fluorophore NHS esters. After addition of the dyes, the microspheres were vortexed for 30 s and rotated overnight. After washing the beads thoroughly, the unreacted interior amines were capped with 20% acetic anhydride for 20 min. Washing was best accomplished by centrifuging the microspheres, pouring off the supernatant, applying fresh DMF and pipetting the solution up and down 5-10 times. Washing was repeated 5 times after each step.
Peptoid and azapeptoid synthesis
Peptoids and azapeptoid BBHit3 were synthesized on Rink Amide resin (0.32 mmol/g) using previously described protocols.(23, 32,34) The resin (0.1 g, 0.032 mmol) was swelled in DMF for 2 hours prior to use. 9-Fluorenylmethoxycarbonyl (Fmoc) was removed by 20% piperidine and washed thoroughly in DMF. N-α-Fmoc-S-p-methoxytrityl-L-cysteine, (0.1 g, 0.16 mmol) was coupled to the resin using O-(benzotriazol-1-yl)-N,N,N′,N′-tetramethyluronium hexafluorophosphate (HBTU, 0.061 g, 0.16 mmol) and diisopropylethylamine (DIPEA, 0.06 mL, 0.32 mmol). Fmoc was deprotected with 20% piperidine and washed thoroughly (3 × 3 mL DMF). The growing chain was bromoacetylated using 1 mL 2 M 2-bromoacetic acid (BAA) and 1 mL 2.5 M diisopropylcarbodiimide (DIC). The mixture was shaken at 37 °C for 10 min and washed thoroughly. Primary amines and acyl hydrazide sub-monomers were added to the bromoacetylated resin as 1 M solutions in DMF and shaken at 37 °C for 1 h. 1-(t-butoxycarbonyl)-diaminobutane and glycine t-butyl ester were used as protected primary amines. Treatment of MMT-protected cysteine with 2% TFA in DCM (5 × 2 min) gave the free sulfhydryl, upon which fluorescein-5-maleimide was conjugated. For fluorescein conjugation, the resin was neutralized with 10% DIPEA, washed (5 × 2 mL DMF), and incubated with a 5 mM solution of fluorescein-5-maleimide in DMF for 3 hours at room temperature. Peptoids were simultaneously deprotected and liberated from the resin by incubating in a cocktail of TFA:H2O:TIS (95:5:5) for 2 hours. Oligomers were purified on a Vydac reverse-phase C18 column (Grace), freeze dried, and stored without further modification. Peptoid identity was confirmed by matrix-assisted laser desorption ionization-time of flight mass spectrometry.
Fluorescence polarization
Probe concentrations were determined using the absorbance of fluorescein at 495 nm (ε280 = 78,000 M−1cm−1) using a Nanodrop UV-vis spectrophotometer (Thermo Scientific). FP experiments were performed in 384-well half-area, medium bind microtiter plate (Greiner Bio-One) using a probe concentration of 10 nM and two-fold serial dilutions of the target protein or antibody in PBS. Measurements were performed on a 2104 EnVision Multilabel Plate Reader (PerkinElmer) using 450 excitation and 515 nm emission filters. Fitting of the saturation curves to obtain KD values was accomplished using Prism (GraphPad Software, Inc.) with a one-site saturation with Hill slope model. KD values are the average of three independent runs with standard deviation reported.
Probe conjugation to encoded TentaGel microspheres via thioalkylation
After encoding the microspheres, the beads were incubated in 20% piperidine in DMF to afford the free external amines. The terminal amines were bromoacetylated by incubation with 150 μL BAA (2 M in DMF) and 150 μL DIC (2.5 M in DMF) for 15 minutes at 37 °C. After washing (5 × 300 μL DMF), the ligand of interest (0.46 μmol, 2 eq.) containing a terminal cysteine was dissolved in a 50:50 mixture of DMF and PBS (2.5 mg/mL) and applied to the bead suspension. Thioether formation was permitted to occur overnight at 37 °C. The beads were washed 3 times in DMF and quenched in aqueous media. These transformations did not result in any apparent chemical bleaching (Supplementary Figure S6).
Quenching of TentaGel microspheres
The microspheres were transferred to a 96-well filter plate and washed (10 × 300 μL H2O) and equilibrated in water overnight. The microspheres were quenched with 150 mM 2-mercaptoethanol in PBS and washed five times in PBS. Beads were equilibrated in TBS containing 0.05% Tween 20 (TBS-T) for 1 h. The quenched microspheres were transferred to a centrifuge tube where they were blocked in PBS containing 50% Starting Block for 1 hour (200 μL total volume). Beads were immediately used for assays or stored in the blocking solution in the dark at 4 °C. Beads left in the dark did not exhibit any photobleaching for >10 days (Supplementary Figure S7).
ADP3 variant KD determination using encoded microspheres
A stock solution containing 14 μM IgY from a chicken immunized with ADP3 (Creative Biolabs) was prepared in PBS containing 50% Starting Block and serially diluted into 150 μL of the blocking solution in a MultiScreen® Solvinert 96-well filter plate (EMD Millipore). Seven subpopulations of 10 μm TentaGel microspheres containing ADP3 variants were encoded, quenched, and blocked as described, and then distributed (3 μL) among the IgY solutions. The beads were incubating overnight at 4 °C with gentle shaking, washed (3 × 300 μL TBS-T) and hybridized for 1 h at room temperature with Texas red-conjugated anti-chicken secondary antibody (Thermo Scientific) as a 1:200 dilution in the blocking buffer. After washing the beads (3 × 300 μL TBS-T), the Texas red mean fluorescence intensity (MFI) was monitored by fluorescence-activated cell sorting (FACS). We found no evidence of internal dye or reporter fluorophore self-quenching, indicating minimal spectral overlap (Supplementary Figure S8).
Fluorescence-activated cell sorting (FACS)
FACS was performed on an LSRII (BD Biosciences) using violet and red lasers. Emission intensities were monitored at 450 nm (Pacific Blue), 550 nm (Pacific Orange), and 615 nm (Texas Red). At least 500 microspheres were collected for each analysis and the MFI of the Texas red emission intensity was calculated using FlowJo software (Tree Star, Inc.). Data reported are representative of two independent experiments. Fitting of the saturation curves to obtain KD values was accomplished using Prism (GraphPad Software, Inc.) using a one-site saturation model with Hill slope. All FACS experiments were performed in triplicate, and saturation plots display a single representative experiment. KD values are an average of the three experiments with standard deviation reported.
Determination of KD for the BBHit3 and PAFAH-1B2 interaction
BBHit3 was immobilized onto uncoded 10 μm TentaGel microspheres via thioalkylation and quenched as described above. A 100 μM stock solution of His-tagged PAFAH-1B2 or p53 in 50% PBS Starting Block was two-fold serially diluted seven times in PBS containing 50% Starting Block and added to a 96-well filter plate. Microspheres preblocked in PBS Starting Block for 1 h were added to the serially diluted protein solutions. The plate was gently shaken overnight at 4 °C. The beads were washed (3 × 5 min TBS-T) and incubated with anti-His-tag secondary antibody (Sigma Aldrich) diluted 200-fold in 50% Starting Block for 1 h at room temperature. After washing the beads (3 × 5 min TBS-T), AlexaFluor® 647-conjugated secondary antibody (Life Technologies, 1:200 dilution in the blocking buffer) was added to the beads and incubated for 1 h at room temperature. The beads were washed and binding of the targets was analyzed by FACS.
Conjugation of ADP3 to uncoded TentaGel microspheres via Michael addition
TentaGel microspheres (0.002 g, 0.23 mmol/g) were equilibrated in DMF for 2 h. The terminal amines were capped with 3-maleimidopropionic acid NHS ester (0.01 g, 0.038 mmol) dissolved in DMF. After washing (5 × 300 μL DMF), ADP3-Cys (0.6 mg, 0.46 μmol) dissolved in 200 μL 50:50 PBS/DMF was added to the bead suspension and shaken overnight at 37 °C. The beads were washed 3 times in DMF and quenched in aqueous media (see below).
Conjugation of ADP3 to Luminex microspheres
ADP3 was immobilized onto Luminex xMAP® microspheres (Luminex Corporation) using a protocol obtained from the company with minor modifications. Briefly, 5.0 × 10⁶ microspheres were transferred to a 1.5 mL centrifuge tube and pelleted by centrifugation at 9000 × g for 2 minutes. The supernatant was removed, and the pellet was resuspended in 100 μL distilled H2O by vortex and sonication for 20 s. The microspheres were pelleted by centrifugation and the supernatant was removed using a pipette. The microspheres were resuspended in 80 μL of 100 mM monosodium phosphate, pH 6.2, by vortex and sonication for 20 s. 10 μL of 50 mg/mL Sulfo-NHS in H2O was added to the microspheres and vortexed. This was immediately followed by the addition of 10 μL of a 50 mg/mL solution of 1-ethyl-3-(3-dimethylaminopropyl)carbodiimide (EDC) diluted into H2O. The suspension was gently vortexted and rotated for 20 minutes at room temperature, with occasional vortexing. The microspheres were pelleted by centrifiguation, and the supernatant removed. The pellet was resuspended in 250 μL PBS (10 mM Na2HPO4, 1.8 mM KH2PO4, 137 mM NaCl, pH 7.2) and vortexed and sonicated for 20 s. This washing step was repeated once. After concentrating and resuspending the microspheres in 100 μL PBS, they were diluted into 150 μL PBS containing N-(2-aminoethyl)maleimide trifluoroacetate salt (1 mg, 0.004 mmol) and this suspension was shaken overnight at room temperature. The microspheres were washed twice in 250 μL PBS. A 2.5 mg/mL solution of ADP3 in PBS was added to the maleimide-activated beads and the reaction mixture was shaken overnight at 37 °C. After conjugation, the beads were quenched with 150 mM 2-mercaptoethanol, washed thoroughly (5 × 300 μL PBS), and blocked with 50% PBS Starting Block (Thermo Scientific) for 1 h. The microspheres were used immediately without further modification or stored in the blocking buffer at 4 °C. No attempts were made at optimizing the conjugation protocol.
Serological assays
Stock solutions were prepared containing either 14 μM IgY from a chicken immunized with ADP3, or 14 μM nonspecific control IgY (Santa Cruz Biotechnology, Inc.) spiked into chicken serum (2 mg/mL total protein, Sigma Aldrich) and 50% Starting Block. The stock solutions were two-fold diluted into 150 μL PBS containing 50% Starting Block in a 96-well filter plate. The quenched TentaGel or Luminex microspheres containing immobilized ADP3 were added to each well in 3 μL aliquots. After incubating the microspheres overnight at 4 °C, the beads were washed 3 times with TBS-T, and hybridized for 1 h at room temperature with a phycoerythrin (PE) anti-chicken secondary antibody (Santa Cruz Biotechnology, Inc.) diluted 200-fold in the blocking buffer. The microspheres were washed (3 × 300 μL TBS-T), and the extent of PE binding to each microsphere was measured by FACS.
Supplementary Material
Acknowledgements
This work was supported by grants from the NIH (DP3 DK094309-01 and GM-090294). We thank K. Lowe of the Scripps Florida Flow Cytometry Core for helpful discussions regarding microsphere flow cytometry. We also acknowledge technical support from L. Bohn and C. Schmid for help with confocal microscopy experiments. We thank X. Liu and B. K. Sarma for the PAFAH-1B2 serine hydrolase and M. Sarkar for providing the p53 protein.
Footnotes
Supporting Information. Digital confocal micrographs, chemical structures, binding isotherms, and additional characterization of encoded TentaGel beads. This material is available free of charge via the Internet at http://pubs.acs.org
References
- 1.MacBeath G, Koehler AN, Schreiber SL. Printing Small Molecules as Microarrays and Detecting Protein-Ligand Interactions en Masse. J. Am. Chem. Soc. 1999;121:7967–7968. [Google Scholar]
- 2.Hergenrother PJ, Depew KM, Schreiber SL. Small-Molecule Microarrays: Covalent Attachment and Screening of Alcohol-Containing Small Molecules on Glass Slides. J. Am. Chem. Soc. 2000;122:7849–7850. [Google Scholar]
- 3.Winssinger N, Ficarro S, Schultz PG, Harris JL. Profiling protein function with small molecule microarrays. Proc. Natl. Acad. Sci. USA. 2002;99:11139–11144. doi: 10.1073/pnas.172286899. [DOI] [PMC free article] [PubMed] [Google Scholar]
- 4.Sieber SA, Mondala TS, Head SR, Cravatt BF. Microarry Platform for Profiling Enzyme Activities in Complex Proteomes. J. Am. Chem. Soc. 2004;126:15640–15641. doi: 10.1021/ja044286+. [DOI] [PubMed] [Google Scholar]
- 5.Reddy MM, Kodadek T. Protein “fingerprinting” in complex mixtures with peptoid microarrays. Proc. Natl. Acad. Sci. USA. 2005;102:12672–12677. doi: 10.1073/pnas.0501208102. [DOI] [PMC free article] [PubMed] [Google Scholar]
- 6.Koehler AN, Shamji AF, Schreiber SL. Discovery of an Inhibitor of a Transcription Factor Using Small Molecule Microarrays and Diversity-Oriented Synthesis. J. Am. Chem. Soc. 2003;125:8420–8421. doi: 10.1021/ja0352698. [DOI] [PubMed] [Google Scholar]
- 7.Uttamchandani M, Walsh DP, Khersonsky SM, Huang X, Yao SQ, Chang Y-T. Microarrays of Tagged Combinatorial Triazine Libraries in the Discovery of Small-Molecule Ligands of Human IgG. J. Comb. Chem. 2004;6:862–868. doi: 10.1021/cc049900s. [DOI] [PubMed] [Google Scholar]
- 8.Astle JM, Simpson LS, Huang Y, Reddy MM, Wilson R, Connell S, Wilson J, Kodadek T. Seamless bead to microarray screening: Rapid identification of the highest affinity protein ligands from large combinatorial libraries. Chem. & Biol. 2010;17:38–45. doi: 10.1016/j.chembiol.2009.12.015. [DOI] [PMC free article] [PubMed] [Google Scholar]
- 9.Raveendra BL, Wu H, Baccala R, Reddy MM, Schilke J, Bennett JL, Theofilopoulos AN, Kodadek T. Discovery of Peptoid Ligands for Anti-Aquaporin 4 Antibodies. Chem. Biol. 2013;20:351–359. doi: 10.1016/j.chembiol.2012.12.009. [DOI] [PMC free article] [PubMed] [Google Scholar]
- 10.Kuruvilla FG, Shamji AF, Sternson SM, Hergenrother PJ, Schreiber SL. Dissecting glucose signalling with diversity-oriented synthesis and small-molecule microarrays. Nature. 2002;416:653–657. doi: 10.1038/416653a. [DOI] [PubMed] [Google Scholar]
- 11.Vegas AJ, Bradner JE, Tang W, McPherson OM, Greenberg EF, Koehler AN, Schreiber SL. Fluorous-Based Small-Molecule Microarrays for the Discovery of Histone Deacetylase Inhibitors. Angew. Chem., Int. Ed. 2007;46:7960–7964. doi: 10.1002/anie.200703198. [DOI] [PMC free article] [PubMed] [Google Scholar]
- 12.Diehnelt CW, Shah M, Gupta N, Belcher PE, Greving MP, Stafford P, Johnston SA. Discovery of high-affinity protein binding ligands--backwards. PLoS One. 2010;5:e10728. doi: 10.1371/journal.pone.0010728. [DOI] [PMC free article] [PubMed] [Google Scholar]
- 13.Robinson WH, Steinman L, Utz PJ. Protein and Peptide Array Analysis of Autoimmune Disease. BioTechniques. 2002;33:S66–S99. [PubMed] [Google Scholar]
- 14.Quintana FJ, Farez MF, Viglietta V, Iglesias AH, Merbl Y, Izquierdo G, Lucas M, Basso AS, Khoury SJ, Lucchinetti CF, Cohen IR, Weiner HL. Antigen microarrays identify unique serum autoantibody signatures in clinical and pathologic subtypes of multiple sclerosis. Proc. Natl. Acad. Sci. USA. 2008;105:18889–18894. doi: 10.1073/pnas.0806310105. [DOI] [PMC free article] [PubMed] [Google Scholar]
- 15.Price JV, Jarrell JA, Furman D, Kattah NH, Newell E, Dekker CL, Davis MM, Utz PJ. Characterization of Influenza Vaccine Immunogenecity Using Influenza Antigen Microarrays. PLoS One. 2013;8:e64555. doi: 10.1371/journal.pone.0064555. [DOI] [PMC free article] [PubMed] [Google Scholar]
- 16.Halperin RF, Stafford P, Johnston SA. Exploring antibody recognition of sequence space through random-sequence peptide microarrays. Mol Cell Proteomics. 2011;10:M110 000786. doi: 10.1074/mcp.M110.000786. [DOI] [PMC free article] [PubMed] [Google Scholar]
- 17.Restrepo L, Stafford P, Magee DM, Johnston SA. Application of immunosignatures to the assessment of Alzheimer's disease. Ann Neurol. 2011;70:286–295. doi: 10.1002/ana.22405. [DOI] [PubMed] [Google Scholar]
- 18.Disney MD, Seeberger PH. Aminoglycoside Microarrays to Explore Interactions of Antibiotics with RNAs and Proteins. Chem. Eur. J. 2004;10:3308–3314. doi: 10.1002/chem.200306017. [DOI] [PubMed] [Google Scholar]
- 19.Childs-Disney JL, Wu M, Pushechnikov A, Aminova O, Disney MD. A Small Molecule Microarray Platform to Select RNA Internal Loop-Ligand Interactions. ACS Chem. Biol. 2007;2:745–754. doi: 10.1021/cb700174r. [DOI] [PubMed] [Google Scholar]
- 20.Stanton BZ, Peng LF, Maloof N, Nakai K, Wang X, Duffner JL, Taveras KM, Hyman JM, Lee SW, Koehler AN, Chen JK, Fox JL, Mandinova A, Schreiber SL. A small molecule that binds Hedgehog and blocks its signaling in human cells. Nat. Chem. Biol. 2009;5:154–156. doi: 10.1038/nchembio.142. [DOI] [PMC free article] [PubMed] [Google Scholar]
- 21.Tsitovich PB, Pushechnikov A, French JM, Disney MD. A Chemoenzymatic Route to Diversify Aminolglycosides Enables a Microarray-Based Method to Probe Acetyltransferase Activity. ChemBioChem. 2010;11:1656–1660. doi: 10.1002/cbic.201000300. [DOI] [PMC free article] [PubMed] [Google Scholar]
- 22.Chirayil S, Chirayil R, Luebke KJ. Discovering ligands for a microRNA precursor with peptoid microarrays. Nucleic Acids Res. 2009 doi: 10.1093/nar/gkp549. [DOI] [PMC free article] [PubMed] [Google Scholar]
- 23.Alluri PG, Reddy MM, Bachhawat-Sikder K, Olivos HJ, Kodadek T. Isolation of Protein Ligands from Large Peptoid Libraries. J. Am. Chem. Soc. 2003;125:13995–14004. doi: 10.1021/ja036417x. [DOI] [PubMed] [Google Scholar]
- 24.Peng L, Liu R, Marik J, Wang X, Takada Y, Lam KS. Combinatorial chemistry identifies high-affinity peptidomimetics against alpha4beta1 integrin for in vivo tumor imaging. Nature Chem. Biol. 2006;2:381–389. doi: 10.1038/nchembio798. [DOI] [PubMed] [Google Scholar]
- 25.Hintersteiner M, Kimmerlin T, Kalthoff F, Stoeckli M, Garavel G, Seifert JM, Meisner NC, Uhl V, Buehler C, Weidemann T, Auer M. Single bead labeling method for combining confocal fluorescence on-bead screening and solution validation of tagged one-bead one-compound libraries. Chem Biol. 2009;16:724–735. doi: 10.1016/j.chembiol.2009.06.011. [DOI] [PubMed] [Google Scholar]
- 26.Liu R, Marik J, Lam KS. A Novel Peptide-Based Encoding System for “One-Bead One-Compound” Peptidomimetic and Small Molecule Combinatorial LIbraries. J. Am. Chem. Soc. 20022002 doi: 10.1021/ja026421t. [DOI] [PubMed] [Google Scholar]
- 27.Liu R, Wang X, Song A, Bao T, Lam KS. Development and Applications of Topologically Segregated Bilayer Beads in One-bead One-compound Combinatorial Libraries. QSAR Comb. Sci. 2005;24:1127–1140. doi: 10.1111/j.1399-3011.2005.00192.x. [DOI] [PubMed] [Google Scholar]
- 28.Wang X, Zhang J, Song A, Lebrilla CB, Lam KS. Encoding Method for OBOC Small Molecule Libraries Using a Biphasic Approach for Ladder Synthesis of Coding Tags. J. Am. Chem. Soc. 2004;126:5740–5749. doi: 10.1021/ja049322j. [DOI] [PubMed] [Google Scholar]
- 29.Reddy MM, Wilson R, Wilson J, Connell S, Gocke A, Hynan L, German D, Kodadek T. Identification of Candidate IgG Biomarkers for Alzheimer's Disease via Combinatorial Library Screening. Cell. 2011;144:132–142. doi: 10.1016/j.cell.2010.11.054. [DOI] [PMC free article] [PubMed] [Google Scholar]
- 30.Lim HS, Archer CT, Kim YC, Hutchens T, Kodadek T. Rapid identification of the pharmacophore in a peptoid inhibitor of the proteasome regulatory particle. Chem Commun (Camb) 2008:1064–1066. doi: 10.1039/b717861a. [DOI] [PubMed] [Google Scholar]
- 31.Song A, Zhang J, Lebrilla CB, Lam KS. A Novel and Rapid Encoding Method Based on Mass Spectrometry for “One-Bead-One-Compound” Small Molecule Combinatorial Libraries. J. Am. Chem. Soc. 2003;125:6180–6188. doi: 10.1021/ja034539j. [DOI] [PubMed] [Google Scholar]
- 32.Figliozzi GM, Goldsmith R, Ng SC, Banville SC, Zuckermann RN. Synthesis of N-Substituted Glycine Peptoid Libraries. Methods in Enzymol. 1996;267:437–447. doi: 10.1016/s0076-6879(96)67027-x. [DOI] [PubMed] [Google Scholar]
- 33.Sarma BK, Kodadek T. Submonomer Synthesis of A Hybrid Peptoid- Azapeptoid Library. ACS Comb. Sci. 2012;14:558–564. doi: 10.1021/co3000852. [DOI] [PMC free article] [PubMed] [Google Scholar]
- 34.Sarma BK, Yousufuddin M, Kodadek T. Acyl hydrazides as peptoid submonomers. Chem. Commun. 2011;47:10590–10592. doi: 10.1039/c1cc12750k. [DOI] [PMC free article] [PubMed] [Google Scholar]
Associated Data
This section collects any data citations, data availability statements, or supplementary materials included in this article.