Abstract
Entolimod (CBLB502) is a Toll-like receptor 5 agonist in development as a single-dose countermeasure against total body irradiation. Efficacy can be assessed from animal studies, but the “Animal Rule” does not apply to safety assessment. Marked elevations of serum aminotransferases (exceeding 1,000 IU/l) were observed in some human subjects receiving Entolimod in a safety study, threatening its continued development. The percentage of total hepatocytes undergoing necrosis in these subjects was estimated using a mechanistic, multiscale, mathematical model (DILIsym). The simulations suggested that no subject in the safety study experienced more than a modest loss of hepatocytes (<5%), which was comparable to estimates from a study of healthy volunteers receiving treatment with heparins. The predicted hepatocyte loss with Entolimod was lower than that required to cause liver dysfunction or that is routinely excised from volunteers donating for autologous liver transplantation and did not likely represent a serious health risk.
Introduction
Entolimod (CBLB502) is a Toll-like receptor 5 agonist currently in development by Cleveland BioLabs (http://www.cbiolabs.com) as a single-dose therapy for exposure to potentially lethal whole body irradiation during a nuclear disaster. Demonstrating efficacy of Entolimod in humans is not feasible, and the path to regulatory approval therefore comes under the US Food and Drug Administration's (FDA) “Animal rule.”1 The animal rule removes the burden of proving treatment efficacy in humans. The efficacy of Entolimod, which is a recombinant protein injected subcutaneously, has been demonstrated in multiple animal species, including mice and nonhuman primates.2 However, the animal rule does not remove the burden of proving safety in humans. Accordingly, studies were conducted in adult healthy volunteers with the sole purpose of demonstrating the safety of Entolimod. Although most of the subjects tolerated the treatment well in these studies, some subjects experienced markedly elevated serum alanine aminotransferase (ALT) and aspartate aminotransferase (AST) levels, raising questions about the risk of continued safety testing necessary to attain regulatory approval of Entolimod.
Clinical symptoms were monitored and biomarker measurements were taken to assess the underlying health status of the healthy volunteers. Interpretation of the ALT/AST results was not straightforward. Much effort has been put into the development of novel biomarkers aimed at increasing sensitivity, specificity, and thus reducing ambiguity.3,4 However, many historical biomarkers of injury or function have remained the gold standards for safety assessments in the interim. Liver transaminase levels in serum are one prime example. ALT and AST have, for decades, been the biomarkers of choice for detecting liver injury (hepatocyte death) in humans. Yet, there are relatively little data in humans that link ALT and AST to the loss of liver mass. Furthermore, ALT and AST are not entirely liver-specific, providing an additional element of uncertainty. As the scientific community continues to use historic endpoints such as ALT and AST while developing newer ones, the need for the interpretation of these safety signals still exists.
Mechanistic, mathematical models of biological systems are ideally suited for biomarker interpretation. They can provide the biological context that gives rise to endpoints such as ALT and AST. While the application of such models in clinical or preclinical situations is still in its nascent state, examples of successful application do exist.5,6 Furthermore, the FDA specifically refers to this approach as an important component of the modernization of toxicology moving forward.7 The chief advantage of using mechanistic models to better understand biomarkers is the ability to account for all the information inherently included in complicated data sets.
In this report, a mechanistic model of drug-induced liver injury (DILI) (DILIsym) was used to aid in the interpretation of the liver enzyme elevations observed in healthy volunteers receiving Entolimod. This was accomplished through a two-phase process. First, DILIsym was optimized to produce the liver enzyme profiles observed in healthy volunteers administered Entolimod. Second, the underlying level of hepatocyte loss predicted by the model to give such profiles was assessed for its relevance to the safety of the healthy volunteers.
Results
Baseline human simulations
Figure 1a shows serum ALT time course data from 100 healthy volunteers who received a single dose of Entolimod. Figure 1b shows three simulated ALT time courses that correspond to the maximum peak ALT observed, the upper 95th percentile peak ALT observed, and the median peak ALT observed (statistical descriptors for measured values provided in Supplementary Table S3). The optimization of the ALT time courses led to reasonable similarity between the simulated ALT time courses and the clinical observations. Supplementary Figure S1 shows the AST time courses that resulted from the necrosis levels necessary for the ALT data fitting.
Figure 1.
Simulation results for baseline human compared to observed responses in a clinical trial of 100 normal healthy volunteers receiving Entolimod. (a) Alanine aminotransferase (ALT) profiles for healthy volunteers are shown with the blue continuous lines. (b) The maximum ALT value observed (black line) was used along with the ALT time-course dynamics to optimize DILIsym model simulations to the maximum observation (red line). The same procedure was followed for the upper 95th percentile ALT observation and the median ALT observation. Simulation results are shown in red. ALT time courses are shown in black. (c) The maximum level of hepatocyte loss after Entolimod dosing relative to the number of healthy hepatocytes in adults was predicted with DILIsym using simulations corresponding to the maximum, 95th percentile, and median peak ALT responses measured in the clinical trial.
In Figure 1c, the peak amount of hepatocyte loss necessary in the baseline human to generate the maximum observed ALT and AST elevations, as well as the 95th percentile and median elevations, (Figure 1 and Supplementary Figure S1) is shown. For most of the healthy volunteers who received Entolimod (i.e., the median volunteer), the predicted hepatocyte loss was less than 0.5% of their baseline values. The upper 95th percentile loss value predicted was 1%. The maximum responder with an ALT peak of greater than 1,000 U/l was predicted to have lost a maximum of 3.5% of their hepatocytes.
The time required for the baseline human to regenerate the lost hepatocytes was also assessed with DILIsym version 1A (Supplementary Figure S2a). The liver regeneration time required to reach 99% of baseline hepatocyte levels for the maximum baseline responder (3.5% liver loss) was ~3 weeks. The time required for the upper 95th percentile responder to recover half the predicted hepatocyte loss (1% liver loss) was around 2 weeks. For both cases, the time required for liver regeneration was inconsequential, as the level of liver loss could probably never be experimentally distinguished from a baseline liver.
Human population sample simulations
The SimPops constructed from the parameters listed in Supplementary Table S1 was composed of 310 simulated humans. Various levels of necrosis were simulated in each individual. An example of this process is shown in Supplementary Figure S3. At each level of necrosis, simulated humans responded with an array of ALT time-course profiles. Supplementary Figure S3 includes three exemplar induced necrosis levels. Upon review of Supplementary Figure S3, it is apparent that simulated variations occur in the peak value of ALT but not in the time to reach the peak value. This is by design, as the clinical observations from Entolimod displayed extremely consistent time-to-peak profiles with different peak levels.
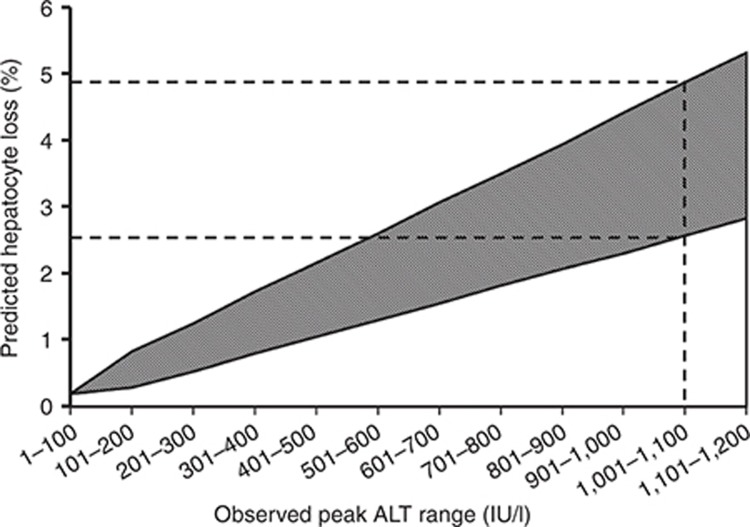
A large number of induced necrosis levels were assembled to produce Figure 2. Figure 2 serves as a look-up table (hepatocyte loss vs. peak ALT) for ALT time-course profiles that match those exhibited by the Entolimod responders. A maximum observed ALT response along the x axis of 1,001–1,100 U/l corresponds to the predicted hepatocyte loss levels ranging from 2.6 to 4.9% (upper 95th percentile ALT response (301–400 U/l) to a range of 0.8–1.7% hepatocyte loss, median response to 0–0.5% hepatocyte loss). Supplementary Table S2 includes the ranges associated with each peak ALT category shown on the x axis of Figure 2.
Figure 2.
Range of predicted hepatocyte loss (percentage of baseline) as a function of observed peak alanine aminotransferase (ALT) range in healthy volunteers. The range of hepatocyte loss was predicted using version 1A and SimPops (in silico population samples) specifically designed to replicate physiologically relevant variability in ALT response from necrosis of hepatocytes. The dashed lines indicate the predicted range of hepatocyte loss associated with a peak ALT range consistent with the maximum ALT observed in normal healthy volunteers dosed with Entolimod.
The SimPops was also used to assess variability in liver regeneration time after hepatocyte loss. The time required for liver regeneration in the simulated individuals with ALT levels corresponding to the maximum observed value in the study ranged from 2 to 9 weeks with a median value of 3 weeks. The results are displayed in Supplementary Figure S2b as a shaded region, which encompasses all simulated observations.
Discussion
Peak serum levels of liver enzymes observed in a few subjects taking Entolimod raised safety concerns, but the extent of liver injury that had occurred, and hence the safety risk to these subjects, was unclear. The levels of predicted hepatocyte loss shown in Figures 1c and 2 can generally be described as “low” for individuals receiving the single dose of Entolimod. Even the estimated range of hepatocyte loss in the maximum ALT responder (2.6–4.9%) intuitively seems modest given the enormous functional reserve of the liver and its remarkable regenerative capabilities. To put this estimated hepatocyte loss into context, three types of published studies were used or reviewed below.
Comparing Entolimod responses to heparin responses
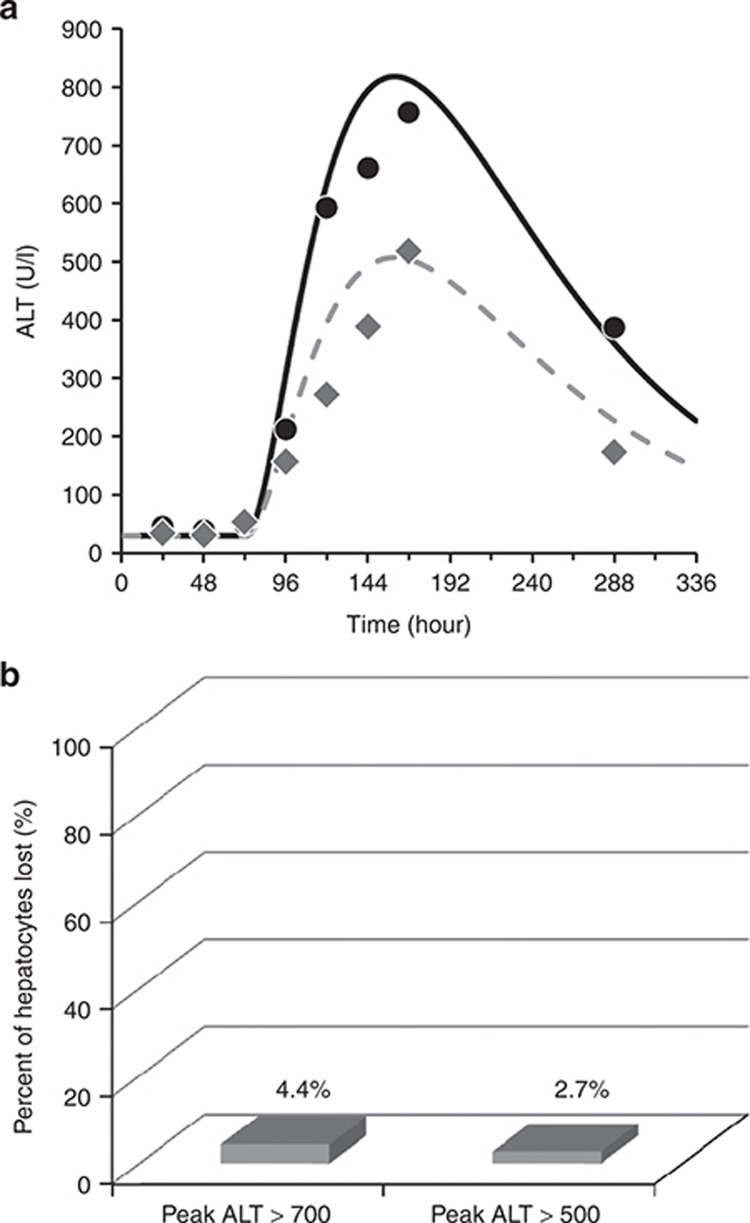
Entolimod responses were put into context regarding safety by comparing them to the responses from another agent that is generally regarded as safe for the liver. Harrill et al. analyzed serial serum samples obtained from healthy volunteers receiving several types of heparins.3 ALT elevations were observed, and experimental serum biomarkers (rises in high-mobility group box 1 and glutamine dehydrogenase with no rise in caspase-cleaved fragments of Keratin-18) supported necrosis as the underlying hepatocyte death process. Data from the two volunteers who experienced the highest observed ALT elevations during heparin treatment are shown in Figure 3a. ALT dynamics from heparins are very different when compared to Entolimod responses (Figure 1a). Figure 3a also shows two solid lines indicating DILIsym simulation results. The same parameter values used for Entolimod simulations (Table 1) were used to produce the ALT simulations that match the time-course data from the heparin study. The primary difference was the time for onset of injury, which was markedly lengthened for the heparin simulations. Figure 3b shows that baseline predictions of liver loss in the two highest ALT responders in the heparin study were 4.4% and 2.7%. The level of liver loss predicted for the heparin responders was on the same order as the maximum values predicted for the Entolimod responders. Since heparins are regarded as safe for the liver,3,8 this comparison supports the conclusion that the hepatocyte loss predicted with Entolimod can occur with other therapeutic agents without posing a significant safety risk to those treated.
Figure 3.
Clinical data and simulation results related to alanine aminotransferase (ALT) elevations observed in healthy volunteers receiving various heparins.3 (a) The two volunteers who exhibited the highest observed ALT elevations (data points) in a previously published clinical study utilizing heparins,3 and DILIsym simulation results (solid lines) from a model optimization designed to fit the heparin observations. (b) The predicted maximum percentage of hepatocytes lost for the two heparin responders using slow injury onset and fast ALT transport (see Figure 5). Data reprinted with permission.
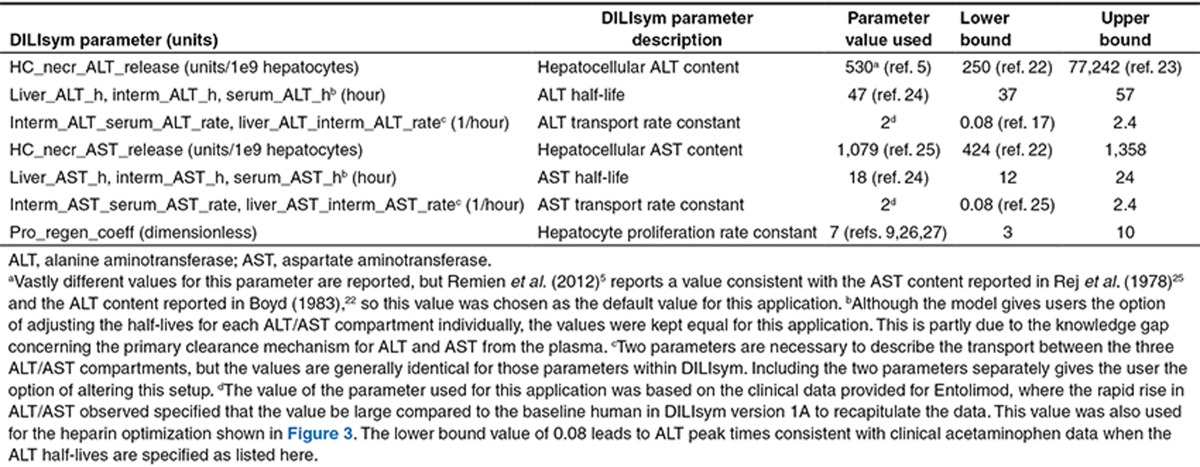
Table 1. Key DILIsym version 1A parameters related to the Entolimod application.
Comparing predicted hepatocyte loss levels to historical data
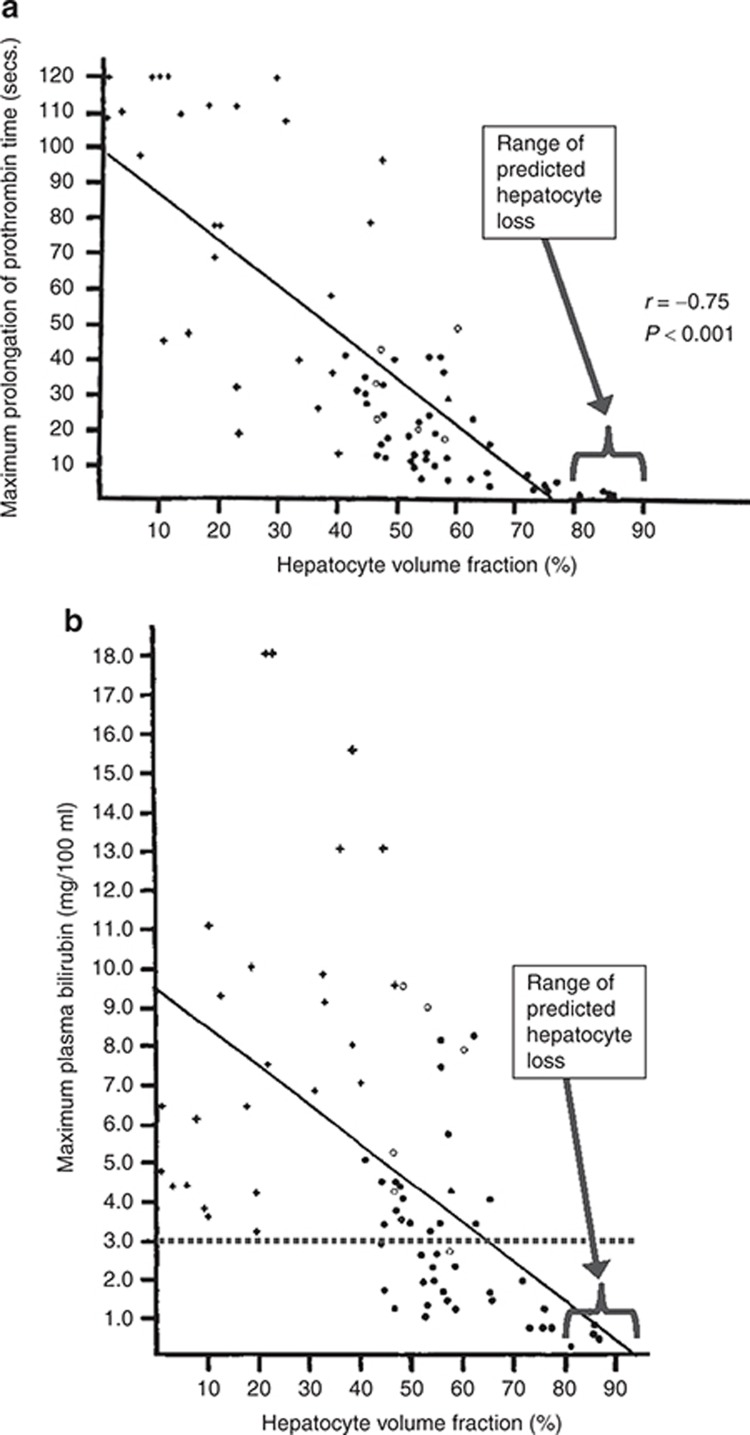
A direct comparison between predicted levels of liver loss for Entolimod and levels of liver loss that lead to clinically significant symptoms of liver dysfunction was conducted using published data.9 Figure 4 shows prothrombin time and bilirubin as a function of hepatocyte volume fraction for adults. Also, illustrated in Figure 4 are the levels of hepatocyte volume fraction predicted for the Entolimod responders (note that not all liver volume is composed of hepatocytes, so the levels indicated on the x axis are lower than the predicted percentage of hepatocytes lost). The levels of loss implicated for Entolimod are below the threshold for detectable liver dysfunction (Figure 4a,b), which is consistent with expectation, since there were no elevations in serum protime observed in the clinical study. Transient and minor bilirubin elevations were observed in some of the volunteers, but there was no correlation between peak serum bilirubin levels and peak ALT values (Supplementary Figure S4), suggesting a mechanism independent of liver cell death. The subject with the highest ALT elevation had a serum bilirubin peak that never reached or exceeded 1 mg/dl, which is below the upper limit of normal (ULN). Furthermore, bilirubin elevations never exceeded 2 X ULN in any volunteer, the typical cut off for clinical concern.10 Accordingly, these observations support the conclusion that the maximum hepatocyte loss experienced in the clinical study was far short of the extent necessary to detectably interfere with liver function.
Figure 4.
Symptoms of hepatocyte loss relative to the magnitude of loss. (a) Relationship between the maximum prolongation of prothrombin time in the first 10 days after acetaminophen overdose and the hepatocyte volume fraction in 76 patients.9 (b) Relationship between the maximum plasma bilirubin in the first 10 days after acetaminophen overdose and the hepatocyte volume fraction in 75 patients.9 The dashed line represents a significant clinical bilirubin elevation of 3 mg/dl. Figures reprinted with permission. The range of predicted hepatocyte volume fraction for the volunteers exposed to Entolimod is also indicated in both figures.
Liver excision in healthy adults
One practical way to provide context to liver loss predictions is through comparisons to liver excision levels in healthy donors for the purpose of autologous transplantation. For healthy adult donors participating in adult-to-pediatric liver transplantation, removal of the left lateral segment of the liver, which constitutes roughly 20% of the total liver volume, is considered of “no concern with regard to the donor's remnant size.”11 Furthermore, when left or right lobes are used for adult-to-adult living donor liver transplantation, roughly 40–60% of the living donor's liver volume is removed, respectively.12 A clean excision of liver tissue for transplantation is different than DILI in many ways. Nonetheless, the large masses of liver loss occurring during transplantation provide some context for the loss of 5% predicted for the most extreme responder to Entolimod in the healthy volunteer study. It is also interesting to note that such donations of liver by healthy volunteers is considered ethical, which supports the idea that continued evaluation of Entolimod in healthy volunteers may also be ethical with appropriate informed consent.
Interpreting liver enzyme signals in the context of safety
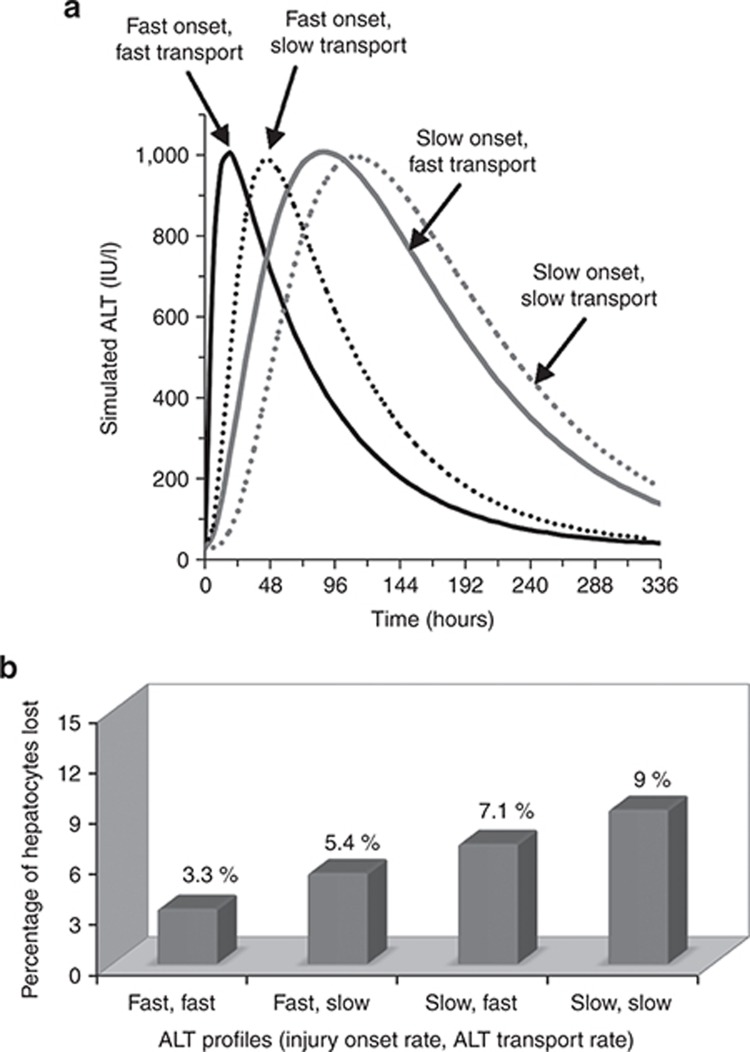
In this example, the liver enzyme elevations from healthy volunteers (Figure 1 and Supplementary Figure S1) appeared rapidly and disappeared rapidly. However, if another compound gave a similar peak ALT but a different ALT kinetic profile, it could alter the potential conclusions from tools such as DILIsym. To better illustrate the factors that should be considered when examining liver enzyme kinetics, DILIsym was used to produce four simulated ALT profiles (Figure 5a). Two rates or parameter values were set for each of the four scenarios shown, and necrosis was then induced (“tuned”) until the peak ALT value reached 1,000 U/l. The two rates set were (i) rate of injury onset, which is dictated by the time course for drug exposure and injury progression and (ii) the rate of ALT transport from necrosing cells into plasma, which could be affected by the mode of cell death. Note the clear differences in kinetics between the four curves despite similar peak levels. Figure 5b contains the four peak hepatocyte loss predictions corresponding to the four ALT time courses in Figure 5a. Each ALT time course demonstrates a unique profile and a unique level of liver loss. Accordingly, some key factors to consider when examining liver enzyme elevations can be ascertained from the figure:
ALT peak height: this is an important component but clearly not sufficient to distinguish between levels of liver loss, as Figure 5b demonstrates.
Area under the curve: Figure 5a shows that both curves for fast onset have lower area under the curve (AUC) values than the curves for slow onset. While AUC can thus be correlated to hepatocyte loss, the predicted loss levels are also different between the fast curves, and between the slow curves, despite similar AUC values. Therefore, AUC is an important component for the interpretation of the liver enzyme time courses but is not sufficient alone.
Time between the initiation of liver enzyme elevations and the point at which the maximum observed value is reached: This time lapse depends on both the onset and transport rates and is the final component necessary to estimate hepatocyte loss from the liver enzyme profiles. Note how the injury extent predicted in Figure 5b gradually increases as this time lapse increases in Figure 5a.
Figure 5.
Alternate parameter combinations yielding simulated alanine aminotransferase (ALT) profiles with similar peak values but different time-course dynamics and the simulated peak hepatocyte loss associated with each ALT profile. (a) Four simulated ALT profiles are shown. The ALT profile most similar to the profiles from Entolimod responders (solid black line) was generated with fast injury onset and fast transport of ALT out of necrotic cells into plasma. Fast injury onset and slow transport into the plasma (dotted black line) is also shown. The profile most similar to the heparin observations shown in Figure 5 was simulated with slow injury onset and fast ALT transport (solid gray line). An alternative profile that is also consistent with the heparin observations includes slow injury onset and slow ALT transport (dashed gray line). (b) Simulated peak percentages of hepatocytes lost from the DILIsym model corresponding to the profiles shown in a.
These observations and Figure 5a,b demonstrate the value of considering the full depth of information obtained from time-course profiles of biomarkers. They also highlight the importance of the exact time-course profiles observed for Entolimod. Had the Entolimod healthy volunteers exhibited liver enzyme profiles similar to the ones seen for heparin responders with maximum observations near 1,000 U/l, the liver loss predictions would have been roughly threefold higher than the current predictions, supporting a greater safety concern.
While the connection between hepatocyte death and liver enzyme leakage, as well as the use of time-course profile information to interpret liver enzyme elevations may seem intuitive in the context of this example, it must be noted that the current FDA guidelines surrounding the assessment of DILI in clinical trials lack any mechanistic or physiological basis.10 For example, the FDA guidance recommendation to stop investigational drug treatment if a subject experiences a rise in ALT exceeding 8 X ULN on one occasion, or exceeding 5 X ULN for more than 2 weeks10 is empirical. The methods for analyzing liver enzyme elevations outlined herein, together with estimations of the relative contribution of necrosis and apoptosis that can now be obtained from mechanistic biomarkers, could represent a significant advancement in regulatory science in the future.
Limitations
Mathematical models include approximations that limit their accuracy. Clinical experience should weigh heavily on conclusions regarding safety. Furthermore, the selection of model parameters to create population samples for variability predictions could lead to parameter value combinations that are not biologically reasonable. In this example, a small number (four) of seemingly independent parameters were used to create the SimPops, and those parameters were directly tied to observed measurements.
In this case study, the goal was to answer one primary question: how much liver loss would have to occur to result in the given ALT/AST profiles? As a result, the specific mechanisms of Entolimod induced enzyme elevations were neglected. Specific pathways for inducing cell death by Entolimod could also be explored with DILIsym if the appropriate time and data were available. Necrosis was assumed to have occurred as the primary mode of cell death. While this assumption does seemingly provide the most conservative approach, alternative hypotheses, such as apoptosis, could lead to different conclusions regarding hepatocyte loss. Had serum been available from the Entolimod studies, it would have been helpful to assay serum biomarkers capable of distinguishing cell death by necrosis and apoptosis.3 In the future, application of these biomarkers in clinical trials would provide very valuable input for modeling exercises aimed at improving liver safety assessment.
Finally, this case study was a retrospective analysis of data collected during two healthy volunteer studies involving Entolimod. The simulations and associated conclusions were meant to aid in determining the implications of those liver signals for the healthy volunteers involved but were not meant to prospectively predict or be applied to the safety of different healthy volunteers or patients chosen for future studies. This is especially true in light of the lack of mechanistic detail included for the simulation of liver enzyme increases in plasma by Entolimod.
Summary and conclusions
In conclusion, DILIsym version 1A predicted hepatocyte loss levels of less than 1% for most of the healthy volunteers receiving Entolimod in the completed clinical trials. The maximum responder's loss was predicted to fall between 2.6% and 4.9%. In light of heparin data, historical patient biopsy information, and liver excision practices, the amount of hepatocyte loss experienced by the volunteers was unlikely to have represented a significant health threat. DILIsym version 1A also demonstrated the importance of considering the dynamics of liver enzyme data. The three most important factors to consider include the maximum value observed, the AUC, and the time elapsing between the start of enzyme elevation and when the maximum value was observed.
Methods
Safety studies in healthy volunteers.
The sponsor of Entolimod conducted two safety studies in healthy adult volunteers. They included 50 individuals (dosing range of less than 5 µg up to 50 µg as a single dose) and 100 individuals (dosing range of 25–35 µg). The results presented in Figure 1 are constrained to the larger study, where the most significant ALT elevations were observed (patient demographics in Supplementary Table S4.
The primary endpoints analyzed were biomarkers (ALT, AST, and serum bilirubin) measured from serial serum samples. The focus of the modeling effort was ALT because liver safety concerns were based on these measurements. The main goal of this exercise was to use the aminotransferase data to estimate the percentage of hepatocytes lost in the livers of the healthy volunteers following the dose of Entolimod. The mode of induced hepatocyte loss by Entolimod, which may be related to its properties as a Toll-like receptor 5 agonist, were not included in the simulations, nor were the pharmacokinetics of the drug represented. Rather, this study focused on the modeled relationships between hepatocyte necrosis, the resulting release of hepatocyte ALT and AST, and its distribution to and clearance from the plasma compartment. With this representation, simulations were used to predict the level of hepatocyte death that would lead to the observed elevations in ALT and AST.
DILIsym version 1A.
The DILI-sim Initiative is a collaboration between the Hamner Institutes for Health Sciences and the pharmaceutical industry. The goals of the DILI-sim Initiative include developing DILIsym software, a predictive, mechanistic, mathematical model of DILI (http://www.DILIsym.com). The method for model design is best described as “middle out.” The “middle out” approach involves starting at the organ level (liver in this case) and working down to the molecular level or up to the organism level when necessary.13 The model is organized into various smaller submodels, but all submodels are mathematically integrated to simulate an organism level response. Supplementary Figure S5 shows several of the key components of DILIsym version 1A and how they exist as submodels but also interact. More information on DILIsym version 1A is available through several previously published articles.6,14,15 DILIsym is available to industry through membership in the DILI-sim Initiative. Academic and nonprofit groups may access the model by contacting the Hamner Institutes for Health Sciences or the corresponding author.
ALT and AST submodels of DILIsym version 1A.
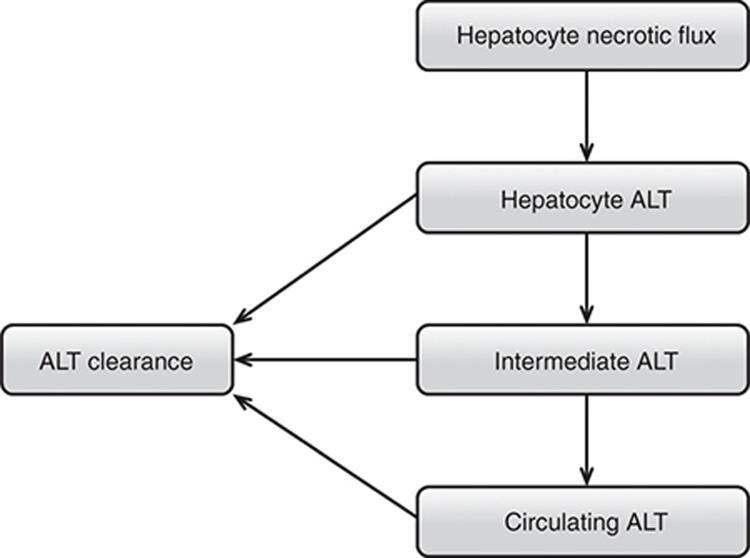
This exercise used the hepatocellular life-cycle and biomarker components of DILIsym version 1A (Supplementary Figure S5, more detail including equations in Supplementary Materials and Methods). The ALT submodel was the principle focus. The AST submodel, which contains an identical structure with different parameter values, was also used. The ALT submodel is shown in Figure 6. The necrosis of hepatocytes leads to ALT release.16 The mass of ALT per cell is specified. Three compartments (modeled with ordinary differential equations) make up the ALT model. In Figure 6, the compartments are labeled “Hepatocyte,” “Intermediate,” and “Circulating.” The “Hepatocyte” compartment represents temporary association of ALT with cells as necrosis occurs. The “Circulating” compartment represents systemic circulation. The “Intermediate” compartment was required to optimize observed serum ALT profiles with other model hepatotoxicants and may represent the ALT in interstitial space, the Space of Disse, or possibly the liver sinusoids. As shown in Figure 6, clearance of ALT occurs in all three compartments. This structure was implemented based on ALT dynamics observed in response to several hepatotoxic compounds.4,17,18,19 Note that the clearance of ALT occurs in all three compartments, as the exact mechanism and location of liver enzyme clearance is not yet elucidated.20,21
Figure 6.
Diagram showing the structure of the alanine transaminase (ALT) biomarker submodel within DILIsym version 1A.
Table 1 shows several of the key parameter values for the ALT and AST submodels used to match the ALT responses observed in healthy volunteers given the single dose of Entolimod.5,9,17,22,23,24,25,26,27 The values used for the response in the baseline (average) human, as well as the range of values derived from the literature, are shown. The time to reach peak ALT/AST values was much faster with Entolimod than with previous exemplar hepatotoxic compounds modeled (e.g., acetaminophen, furosemide, aflatoxin).6,14,28 This is most likely due to the different mechanisms of toxicity for the previous exemplars compared to Entolimod. Based on the ALT profiles and assuming the ALT and AST were hepatocyte-derived,16 hepatocyte death and liver enzyme release appeared rapid. As a result, the transport dynamics were adjusted to match the observed profiles.
Baseline human simulations: ALT and AST.
To assess the level of liver injury necessary to produce the liver enzyme responses seen with Entolimod, hepatocyte necrosis was simulated in DILIsym. Hepatocyte necrosis was chosen as the mode of cell death because the sponsor of Entolimod lacked any specific biomarker data implicating a specific mode of cell death in the human studies (such as serum high-mobility group box 1 assessments).3,4 The rapid nature of the liver enzyme responses observed in serum also made necrosis seem most plausible. The health consequences of necrosis, which could include activation of an innate immune response, are potentially more dire compared to hepatocyte death by apoptosis. Necrosis was thus the logical and conservative choice for this analysis.
The mechanisms operative before the onset of necrosis (e.g., pharmacokinetics, adenosine triphosphate (ATP) depletion, oxidative stress, etc.) were not considered herein. The method for simulating necrosis was a direct necrosis signal. The amount of necrosis was the starting place for the optimization in this example. Necrosis was tuned to achieve similar time-course profiles as observed for the maximum, upper 95th percentile, and median peak ALT level responses to Entolimod. The overall maximum, upper 95th percentile, and median response levels were calculated from the peak ALT values from the entire group of trial participants. The parameter values shown in Table 1 were used and the amount of necrosis was adjusted until simulated ALT profiles were consistent with the clinical data. The magnitude of the ALT responses were the optimization data set. Simultaneously, AST levels were simulated with DILIsym to ensure a reasonable prediction of the magnitudes of both enzymes. The AST responses were the confirmation data set. Next, the simulated percentage of hepatocytes lost corresponding to each of the three enzyme profiles was inferred from the simulation results.
Assessing variability with a human population sample.
The simulation process above assumes that the interpatient variation in serum ALT profile only reflects variation in the extent of necrosis. In order to account for potential intersubject differences in the model parameters, a population sample (SimPops) was constructed using parameters that would cause variability in ALT response from a given level of necrosis. A parameter related to liver regeneration capacity was also used, since this could theoretically affect the peak loss of hepatocytes while not affecting the serum ALT profile. A population sample with 310 simulated humans was created and used in the final analysis. Various levels of necrosis were then induced for each simulated human and the simulated variability in ALT response was measured. This information was used to construct Figure 2.
Details related to the construction of the SimPops, including the specific parameters varied for this application, can be found in the Supplementary Materials and Methods. Further details on the methods are also in the supporting materials of Howell et al. (2012)14 and Woodhead et al. (2012).6
Author contributions
B.A.H., S.Q.S., L.K.M.S., and P.B.W. wrote the manuscript. B.A.H., S.Q.S., Y.Y., J.L.W., and P.B.W. designed the research. S.Q.S. and L.K.M.S. analyzed the data. B.A.H., S.Q.S., and J.L.W. performed the research.
Conflict of Interest
The Hamner Institutes was compensated by Cleveland BioLabs for this analysis. P.B.W. was also compensated by Cleveland BioLabs as an independent liver safety expert. This analysis was conducted without bias towards the outcome. The other authors declare no conflict of interest.
Study Highlights
Acknowledgments
The authors acknowledge the members of the DILI-sim Initiative for their support of this research, as well as Cleveland BioLabs for sponsoring this project involving Entolimod. For more information on the DILI-sim Initiative, see http://www.DILIsym.com.
Supplementary Material
References
- US Food and Drug Administration. New Drug and Biological Drug Products: Evidence Needed to Demonstrate Effectiveness of New Drugs When Human Efficacy Studies Are Not Ethical or Feasible . < http://www.gpo.gov/fdsys/pkg/FR-2002-05-31/pdf/02-13583.pdf > ( 2002 [PubMed]
- Burdelya L.G., et al. An agonist of toll-like receptor 5 has radioprotective activity in mouse and primate models. Science. 2008;320:226–230. doi: 10.1126/science.1154986. [DOI] [PMC free article] [PubMed] [Google Scholar]
- Harrill A.H., et al. The effects of heparins on the liver: application of mechanistic serum biomarkers in a randomized study in healthy volunteers. Clin. Pharmacol. Ther. 2012;92:214–220. doi: 10.1038/clpt.2012.40. [DOI] [PMC free article] [PubMed] [Google Scholar]
- Antoine D.J., et al. Molecular forms of HMGB1 and keratin-18 as mechanistic biomarkers for mode of cell death and prognosis during clinical acetaminophen hepatotoxicity. J. Hepatol. 2012;56:1070–1079. doi: 10.1016/j.jhep.2011.12.019. [DOI] [PMC free article] [PubMed] [Google Scholar] [Retracted]
- Remien C.H., Adler F.R., Waddoups L., Box T.D., Sussman N.L. Mathematical modeling of liver injury and dysfunction after acetaminophen overdose: early discrimination between survival and death. Hepatology. 2012;56:727–734. doi: 10.1002/hep.25656. [DOI] [PubMed] [Google Scholar]
- Woodhead J.L., et al. An analysis of N-acetylcysteine treatment for acetaminophen overdose using a systems model of drug-induced liver injury. J. Pharmacol. Exp. Ther. 2012;342:529–540. doi: 10.1124/jpet.112.192930. [DOI] [PubMed] [Google Scholar]
- US Food and Drug Administration. Advancing Regulatory Science at FDA . < http://www.fda.gov/regulatoryscience > ( 2011
- Sonnenblick M., Oren A., Jacobsonn W. Hyper-transaminasemia with heparin therapy. Br. Med. J. 1975;3:77. doi: 10.1136/bmj.3.5975.77. [DOI] [PMC free article] [PubMed] [Google Scholar]
- Portmann B., Talbot I.C., Day D.W., Davidson A.R., Murray-Lyon I.M., Williams R. Histopathological changes in the liver following a paracetamol overdose: correlation with clinical and biochemical parameters. J. Pathol. 1975;117:169–181. doi: 10.1002/path.1711170307. [DOI] [PubMed] [Google Scholar]
- US Food and Drug Administration. Guidance for Industry Drug-Induced Liver Injury: Premarketing Clinical Evaluation . < http://www.fda.gov/downloads/Drugs/.../Guidances/UCM174090.pdf > ( 2009
- Florman S., Miller C.M. Live donor liver transplantation. Liver Transpl. 2006;12:499–510. doi: 10.1002/lt.20754. [DOI] [PubMed] [Google Scholar]
- Hashikura Y., et al. Successful living-related partial liver transplantation to an adult patient. Lancet. 1994;343:1233–1234. doi: 10.1016/s0140-6736(94)92450-3. [DOI] [PubMed] [Google Scholar]
- Shoda L., et al. The Type 1 Diabetes PhysioLab Platform: a validated physiologically based mathematical model of pathogenesis in the non-obese diabetic mouse. Clin. Exp. Immunol. 2010;161:250–267. doi: 10.1111/j.1365-2249.2010.04166.x. [DOI] [PMC free article] [PubMed] [Google Scholar]
- Howell B.A., et al. In vitro to in vivo extrapolation and species response comparisons for drug-induced liver injury (DILI) using DILIsym™: a mechanistic, mathematical model of DILI. J. Pharmacokinet. Pharmacodyn. 2012;39:527–541. doi: 10.1007/s10928-012-9266-0. [DOI] [PubMed] [Google Scholar]
- Bhattacharya S., et al. Modeling drug- and chemical-induced hepatotoxicity with systems biology approaches. Front. Physiol. 2012;3:462. doi: 10.3389/fphys.2012.00462. [DOI] [PMC free article] [PubMed] [Google Scholar]
- Kim W.R., Flamm S.L., Di Bisceglie A.M., Bodenheimer H.C. Public Policy Committee of the American Association for the Study of Liver Disease Serum activity of alanine aminotransferase (ALT) as an indicator of health and disease. Hepatology. 2008;47:1363–1370. doi: 10.1002/hep.22109. [DOI] [PubMed] [Google Scholar]
- Schiødt F.V., Rochling F.A., Casey D.L., Lee W.M. Acetaminophen toxicity in an urban county hospital. N. Engl. J. Med. 1997;337:1112–1117. doi: 10.1056/NEJM199710163371602. [DOI] [PubMed] [Google Scholar]
- Prescott L.F., Illingworth R.N., Critchley J.A., Stewart M.J., Adam R.D., Proudfoot A.T. Intravenous N-acetylcystine: the treatment of choice for paracetamol poisoning. Br. Med. J. 1979;2:1097–1100. doi: 10.1136/bmj.2.6198.1097. [DOI] [PMC free article] [PubMed] [Google Scholar]
- Singer A.J., Carracio T.R., Mofenson H.C. The temporal profile of increased transaminase levels in patients with acetaminophen-induced liver dysfunction. Ann. Emerg. Med. 1995;26:49–53. doi: 10.1016/s0196-0644(95)70237-7. [DOI] [PubMed] [Google Scholar]
- Smit M.J., Duursma A.M., Bouma J.M., Gruber M. Receptor-mediated endocytosis of lactate dehydrogenase M4 by liver macrophages: a mechanism for elimination of enzymes from plasma. Evidence for competition by creatine kinase MM, adenylate kinase, malate, and alcohol dehydrogenase. J. Biol. Chem. 1987;262:13020–13026. [PubMed] [Google Scholar]
- Murayama H., Ikemoto M., Fukuda Y., Tsunekawa S., Nagata A. Serum level of ornithine carbamoyltransferase is influenced by the state of Kupffer cells. Clin. Chim. Acta. 2007;380:170–174. doi: 10.1016/j.cca.2007.02.006. [DOI] [PubMed] [Google Scholar]
- Boyd J.W. The mechanisms relating to increases in plasma enzymes and isoenzymes in diseases of animals. Vet. Clin. Pathol. 1983;12:9–24. doi: 10.1111/j.1939-165x.1983.tb00609.x. [DOI] [PubMed] [Google Scholar]
- Lindblom P., et al. Isoforms of alanine aminotransferases in human tissues and serum–differential tissue expression using novel antibodies. Arch. Biochem. Biophys. 2007;466:66–77. doi: 10.1016/j.abb.2007.07.023. [DOI] [PubMed] [Google Scholar]
- Nicoll D., Lu C.M., Pignone M., McPhee S. J. Pocket Guide to Diagnostic Tests, Sixth Edition. McGraw-Hill Medical; 2012. [Google Scholar]
- Rej R. Aspartate aminotransferase activity and isoenzyme proportions in human liver tissues. Clin. Chem. 1978;24:1971–1979. [PubMed] [Google Scholar]
- Aoki T., et al. Convergence process of volumetric liver regeneration after living-donor hepatectomy. J. Gastrointest. Surg. 2011;15:1594–1601. doi: 10.1007/s11605-011-1590-y. [DOI] [PubMed] [Google Scholar]
- Haga J., et al. Liver regeneration in donors and adult recipients after living donor liver transplantation. Liver Transpl. 2008;14:1718–1724. doi: 10.1002/lt.21622. [DOI] [PubMed] [Google Scholar]
- Shen H.M., Shi C.Y., Lee H.P., Ong C.N. Aflatoxin B1-induced lipid peroxidation in rat liver. Toxicol. Appl. Pharmacol. 1994;127:145–150. doi: 10.1006/taap.1994.1148. [DOI] [PubMed] [Google Scholar]
Associated Data
This section collects any data citations, data availability statements, or supplementary materials included in this article.


