Abstract
Tobramycin powder for inhalation (TOBI Podhaler or TIP) is approved for the treatment of Pseudomonas aeruginosa airway infection in patients with cystic fibrosis (CF). A population pharmacokinetic model for tobramycin inhalation powder (TIP) in CF patients was developed to characterize the effect of covariates including body mass index (BMI) and lung function (forced expiratory volume in 1 s as percent of the predicted value (FEV1% predicted) at baseline) on the serum exposure parameters.
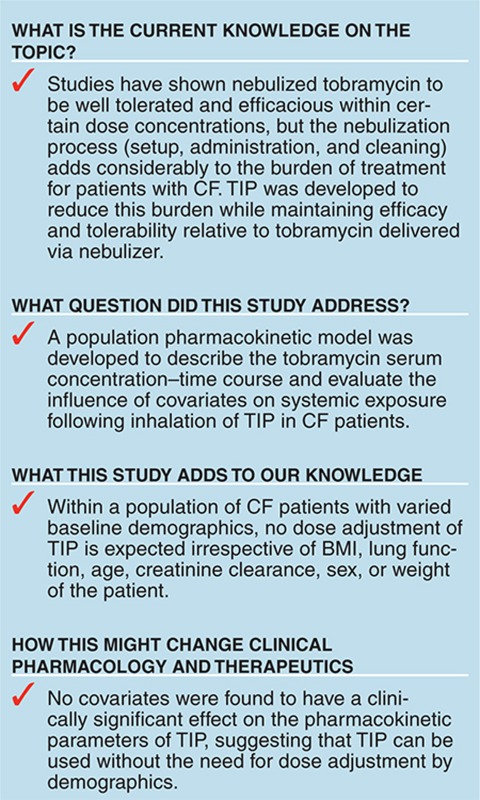
A two-compartment model with first-order elimination and first-order absorption was developed. Across a range of baseline demographic values in the study population, the predicted mean values for the maximum (Cmax) and trough (Ctrough) plasma concentrations at steady state were at least 7.5 and 5-fold lower, respectively, than the recommended thresholds for tobramycin toxicity (12 µg/ml for Cmax and 2 µg/ml for Ctrough). This model adequately described the tobramycin serum concentration–time course in CF patients following inhalation of TIP. The results indicate that no BMI- or FEV1-based dose adjustment is needed for use of TIP in CF patients.
The major cause of morbidity and mortality in patients with cystic fibrosis (CF) is progressive deterioration of lung function.1 By adolescence, the majority of individuals with CF develop an endobronchial infection with Pseudomonas aeruginosa.2 Chronic infection with this pathogen is associated with accelerated progression of obstructive lung disease, increased morbidity, and increased risk of death.1,3,4,5
Tobramycin is an effective antibacterial agent used for the treatment of P. aeruginosa infection, but it can cause nephrotoxicity and ototoxicity at high systemic concentrations.6 The advent of tobramycin inhalation solution (TIS; (TOBI)) provided an effective way of delivering a high concentration of tobramycin to the infected airways while avoiding the toxicity associated with systemic administration. Both US and European treatment guidelines for CF recommend the use of TIS for the treatment of P. aeruginosa infections in patients aged ≥6 years.7,8 TIS is administered b.i.d. via a nebulizer, a process that takes ~15–20 min per dose, including additional time for nebulizer setup and cleaning.9 This time burden could be one of the major reasons for poor adherence to treatment in patients with CF, which may lead to poor clinical outcomes.10,11,12,13
Tobramycin powder for inhalation (TOBI Podhaler or TIP) has been developed to enhance the delivery of tobramycin to the lung and shorten administration time. This may lead to improved patient adherence and a better clinical outcome. Tobramycin inhalation powder (TIP) is manufactured using an emulsion-based spray-drying process that yields spherical hollow porous particles designed to be delivered via the TOBI Podhaler (Novartis Pharmaceuticals, San Carlos, CA), a dry powder inhaler that is light, portable, and requires no power source.14 Furthermore, drug administration time is reduced to 4–6 min for TIP via the Podhaler, compared with 15–20 min for TIS, improving the convenience for patients.9,15 Clinical data have shown that 112 mg TIP administered b.i.d. was effective and well tolerated in CF patients with P. aeruginosa infection and were consistent with data reported for the currently approved TIS formulation.15,16 TIP improved lung function, decreased sputum P. aeruginosa density, reduced respiratory-tract-related hospitalizations, and reduced the use of other antipseudomonal antibiotics.16 Additionally, it has been demonstrated that the systemic exposure following 112 mg tobramycin delivered via Podhaler is comparable with that from TIS and is well below known systemic toxicity levels.16
Topical delivery of aerosol to the lung is highly variable among individuals and is known to be affected by patient factors such as age, upper and lower airway anatomy, and inspiratory breathing pattern.17 The aim of this study was to develop a pharmacokinetic model to characterize pharmacokinetic profile for TIP in CF patients, and to characterize the effects of patients' baseline characteristics, including age, body mass index (BMI), creatinine clearance, sex, lung function (as forced expiratory volume in 1 s as percent of the predicted value (FEV1% predicted)) and weight, on the model parameters, if any. Only pharmacokinetic data from TIP were used in this population pharmacokinetic model.
Results
Demographics
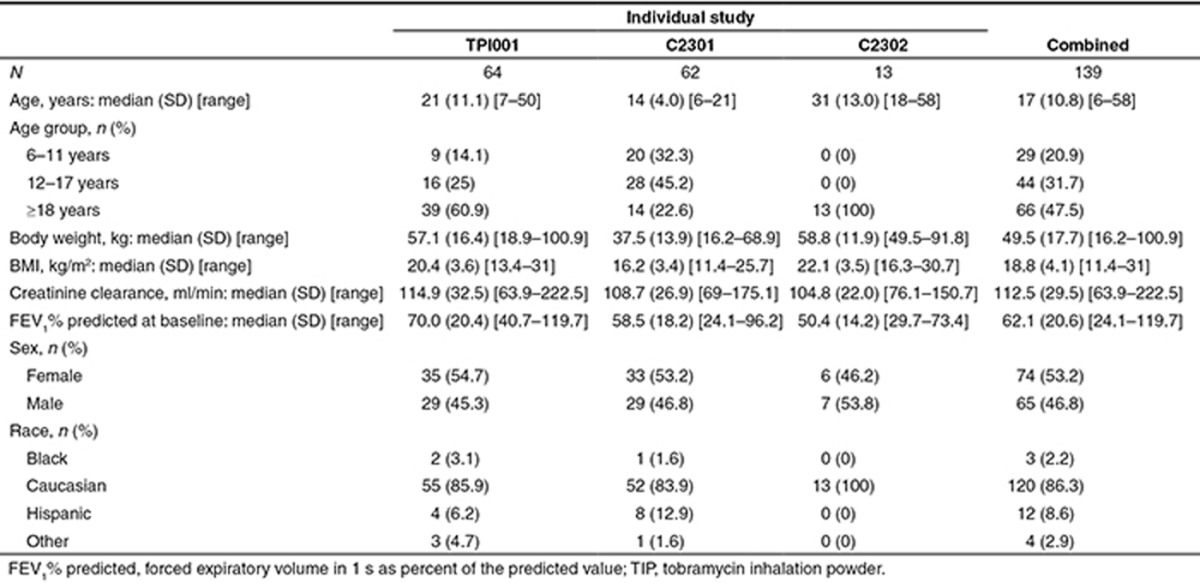
The demographic information on the analysis population from the three individual studies and the combined one is summarized in Table 1.
Table 1. Demographic description of the TIP population.
Population pharmacokinetic model
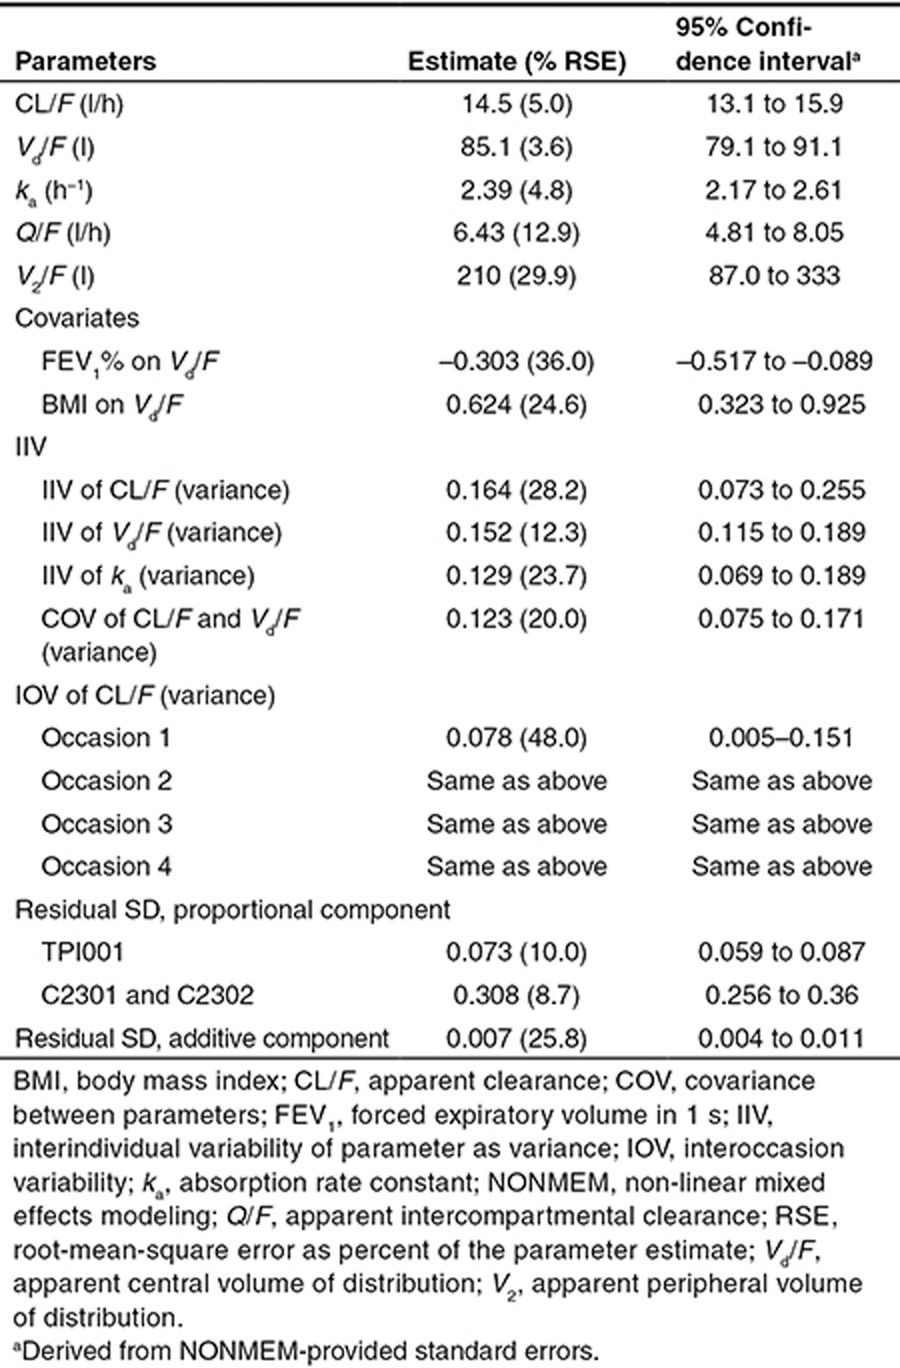
The final population pharmacokinetic model developed was a two-compartment disposition model with first-order elimination and first-order absorption. Interindividual variability (IIV) was estimated on apparent clearance (CL/F), apparent central volume of distribution (Vd/F), and absorption rate constant (ka). Interoccasion variability was estimated on CL/F. The residual error was modeled to be a combination of proportional and additive errors. The proportional residual variability of study C2301 and study C2302 was more than threefold higher than that in study TPI001, reflecting the many doses and sampling times that were not recorded in the two phase III studies and had to be imputed. The parameter estimates are listed in Table 2. The final covariates identified on the model were BMI and FEV1% predicted on Vd/F. The relationship between Vd/F with FEV1% predicted and BMI was defined as follows:
 |
Table 2. Summary of the final model parameter estimates.
None of the other investigated variables were found to be statistically significant covariates in the model.
Visual predictive checks and goodness-of-fit plots
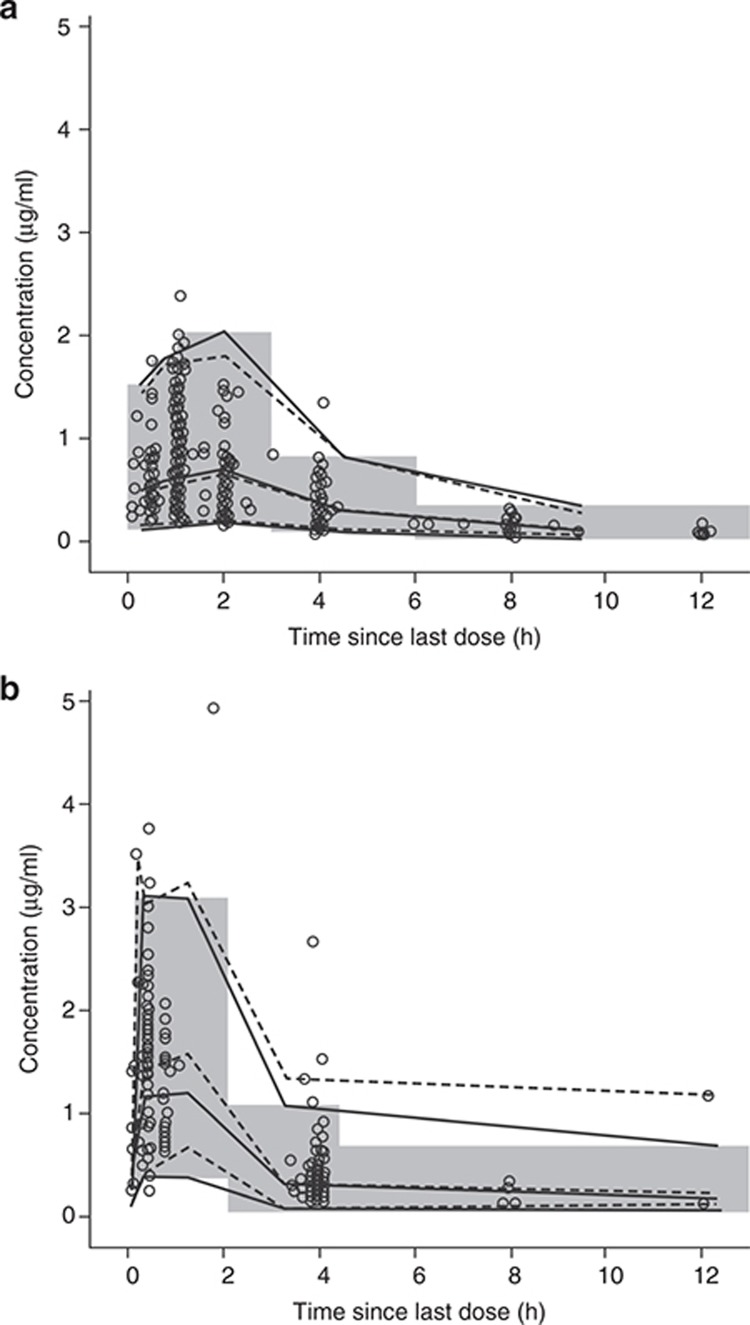
For single doses, the central trend predicted by the model matched the central trend of observed data in visual predictive check plots (Figure 1). The variability observed in the data was adequately captured by the model. In general, observed data at multiple doses were also matched well by the model at the 5th to 95th percentiles (Figure 1b), although the median value of the maximum plasma concentration at steady state (Cmax) was slightly underpredicted. For multiple doses, for the time interval 13–60 h, the 97.5th percentile was underpredicted, which may be explained by the small amount of data (six concentration observations), including one at a significantly higher concentration than the others. Similarly, at the time interval 6–13 h, the observed data at the 97.5th percentile was also not well matched by the model because of observations of high concentrations (in the range of 1–3 µg/ml) compared with the majority (less than 1 µg/ml). Goodness-of-fit plots (see Supplementary Figures S1 and S2) also indicate that the model described the data reasonably well. Plots of population and individual predictions against observations showed good agreement between population predictions and data, as indicated by the overlay of unity line and locally weighted scatter plot smoothing (LOESS) line, with a slight underestimation at high concentrations. The residual error model was also found to be appropriate (comparing individual predictions against individual weighted residuals) and there was no bias in the model predictions against time.
Figure 1.
Visual predictive check of the model for tobramycin concentrations. (a) Visual predictive check of the model for tobramycin concentrations at first visit of each cycle. The shaded area indicates 2.5th and 97.5th percentiles for bins over time of simulated concentrations. Open circles show observed concentrations. Solid and dashed lines indicate medians and the 2.5th and 97.5th percentiles over simulated and observed concentrations, respectively. (b) Visual predictive check of the model for tobramycin concentrations at second visit of each cycle. Open circles show observed concentrations. Dashed lines indicate medians and the 2.5th and 97.5th percentiles over observed concentrations. The solid lines indicate medians and the 2.5th and 97.5th percentiles over simulated concentrations, and the shaded rectangles illustrate binned time intervals over which the percentiles were evaluated.
Covariate effect on exposure
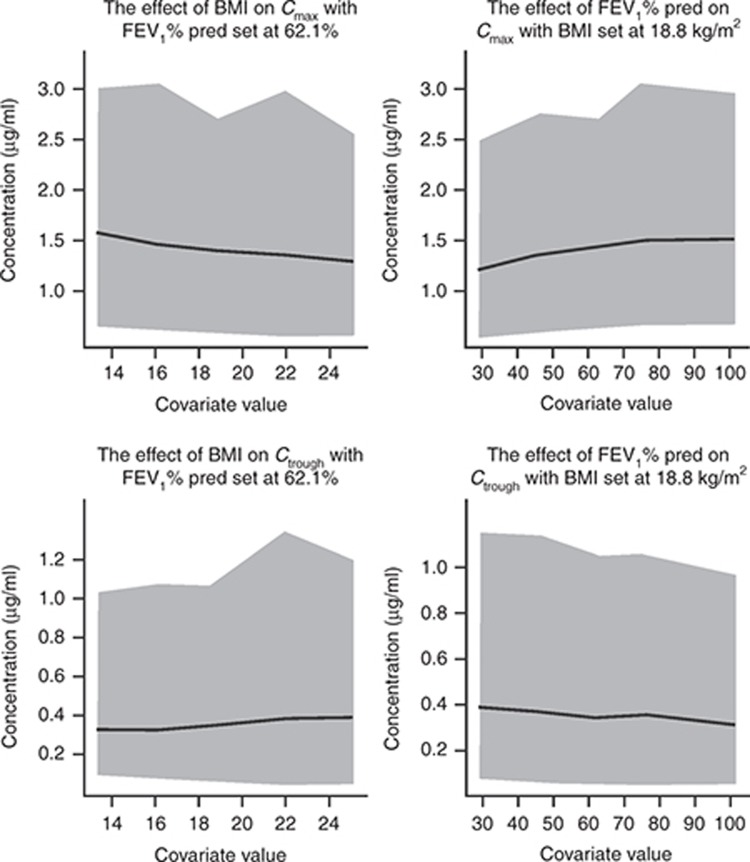
The model-predicted mean Cmax and Ctrough values at steady state for a typical CF patient either with 62.1% FEV1% predicted at baseline (the population median) and different values of BMI or with 18.8 kg/m2 BMI (the population median) and different values of FEV1% predicted at baseline are shown in Figure 2 and Supplementary Tables S1 and S2.
Figure 2.
Effect of the covariates body mass index (BMI) and forced expiratory volume in 1 s as percent of the predicted value (FEV1% pred) at baseline on tobramycin serum Cmax and Ctrough with 95% predictive interval (PI)*, assuming a typical cystic fibrosis patient with FEV1% predicted of 62.1% and BMI of 18.8 kg/m2. Gray area represents 95% PI, and solid line represents mean tobramycin concentration. *Obtained by simulation with interindividual variability in pharmacokinetics; PI values are presented for each covariate value, not for the slope of best fit. Cmax, maximum plasma concentration at steady state; Ctrough, trough plasma concentration at steady state.
Simulations showed that when BMI decreases from the 95th percentile (25.1 kg/m2) to the 5th percentile (13.3 kg/m2) of the study population distribution, Cmax increases 21% from 1.3 to 1.57 µg/ml, whereas Ctrough decreases 16% from 0.38 to 0.32 µg/ml. When FEV1% predicted at baseline increases from the 5th percentile (29.7% predicted) to the 95th percentile (102.5% predicted) of the study population distribution, Cmax increases 21% from 1.22 to 1.48 µg/ml, whereas Ctrough decreases 18% from 0.39 to 0.32 µg/ml. Across the range of values of BMI or FEV1% predicted at baseline evaluated, the predicted mean Ctrough values were at least fivefold lower than the recommended maximum Ctrough(2 µg/ml) for avoidance of tobramycin-associated toxicity (Figure 2).6 These results illustrate that the effect of BMI and FEV1% predicted on the concentration of tobramycin after administration of TIP 112 mg b.i.d are not expected to be clinically relevant.
The highest value of the upper end point of the 95% predictive interval for Cmax is 3.08 μg/ml and for Ctrough is 1.33 μg/ml. The Cmax and Ctrough levels are 7.5- and 5-fold lower than the maximum recommended concentrations of serum tobramycin (12 μg/ml for Cmax and 2 μg/ml for Ctrough), with 97.5% of patients predicted to have Cmax and Ctrough values 4- and 1.5-fold lower than the maximum recommended levels.6 This inference is applicable to patient populations with baseline values of BMI and FEV1% predicted similar to the values in the study populations.
Influence of excluded data
The final structural model developed was rerun after reintroducing concentrations that were excluded due to lack of FEV1 measurements as described previously, and the difference in the parameter values was examined. There was little change in all the parameter estimates after inclusion of these concentrations, suggesting no influential observations or subjects in these data records. The final model was also rerun with the outliers included, and the difference in the parameter values was not deemed significant (data not shown). There was no pronounced change in the fixed-effects parameter estimates except for the estimate of the apparent peripheral volume of distribution (V2/F), which increased from 162 to 313 l, resulting in a longer terminal half-life. This increase is probably due to the fact that some of the outliers were measured at more than 20 h after the previous dose but still had detectable concentration levels. However, this change is not considered clinically relevant as the second phase dose not contribute significantly to the overall kinetics or accumulation.
Discussion
Population pharmacokinetic modeling is an established method for identifying the sources of variability in drug exposure in a target population receiving clinically relevant doses of a drug.18 Some patient or disease characteristics, e.g., weight, renal function, and FEV1, may alter dose–concentration relationships. Modeling approaches have been used to characterize the pharmacokinetics of inhalation solutions for use in nebulizers or aerosols (e.g., (R)-albuterol and (S)-albuterol inhalation solutions in pediatric patients with asthma,19 levofloxacin inhalation solution for patients with CF).20
Systemic Cmax and Ctrough of tobramycin above 12 and 2 µg/ml, respectively, are associated with higher risk of nephrotoxicity and ototoxicity in CF patients and should be carefully monitored.6 A population pharmacokinetic model was therefore developed to describe the tobramycin serum concentration–time course in CF patients following inhalation of TIP, which demonstrates that systemic levels of tobramycin via TIP inhalation are well below the known toxicity levels associated with nephrotoxicity and ototoxicity. Although the systemic Cmaxof 12 µg/ml is a general guidance for intravenous tobramycin, the recommended Cmax for CF patients are similar (8–12 µg/ml) for t.i.d. tobramycin regimen; no specific recommended Cmax value is available for q.d. regimen.21 Therefore, for conservative estimation of toxicity risk, a 12-µg/ml threshold was used for Cmax in this study.
In the present study, BMI and FEV1% predicted were found to be statistically significant covariates for Vd/F. Previously, patients with CF and low BMI measurements have been found to be six times more likely to have severely impaired FEV1 values (<40% predicted) than those with a “normal” BMI.22 In addition, low FEV1% predicted associated with worsening lung disease in CF has been shown to increase total lung deposition of aerosols, mainly to the central airways and areas of obstruction.17 This would likely account for the increased Vd/F observed with decreasing FEV1% predicted in this population. Despite this effect on Vd/F, however, model-based simulation showed that neither Cmax nor Ctrough were substantially affected by change in BMI or FEV1% predicted at baseline. Across the range of baseline BMI or FEV1% predicted values assessed, the predicted mean Cmax and Ctrough values were low relative to the maximum systemic concentrations recommended for avoidance of tobramycin-associated toxicity.6 Cmax and Ctrough values were at least 7.5- and 5-fold lower, respectively, than the maximum recommended Cmax (12 μg/ml) and Ctrough (2 μg/ml).6 Hence, the effect of BMI and FEV1% predicted at baseline on the concentration of tobramycin after administration of TIP 112 mg b.i.d. are not expected to be clinically relevant with regard to systemic toxicity.
After adjustment for the effect of BMI, there was no influence of age on the pharmacokinetics of tobramycin. These findings are consistent with the results of previous studies23,24 or of other inhaled therapies and consistent with the concept that lung dose increases with age but is proportional to body size. Thus, TIP can be dosed at fixed doses (with no dose adjustment necessary) in adults and children above 6 years of age, with an acceptable safety margin due to low systemic exposure. Although tobramycin is known to be eliminated via the renal route and its clearance is dependent on renal function, the current population pharmacokinetic model indicated that creatinine clearance did not affect the pharmacokinetics of tobramycin after TIP administration. This is likely due to the fact that only patients with normal renal function or mild renal impairment were included in the study population (minimum creatinine clearance was 63.9 ml/min in the pharmacokinetic population). Similar to TIS, monitoring of serum tobramycin concentration is recommended if TIP is used in patients with renal dysfunction.
We recognize that different ways of handling concentrations that are below the lower limit of quantification (LLOQ) may influence the final model.25,26 Common ways of handling data below the limit of quantification (BLOQ) include excluding them from the model, replacing them with a value of LLOQ/2, replacing them with a value of zero, and estimating likelihood of BLOQ and all other observations by maximum likelihood estimation method, to name a few.25 Although we acknowledge that a potential issue in excluding the BLOQ observations may create bias in the model fit because the lower remaining observations are selectively too high,25 the extent of such bias is variable and would depend on the structural model and relative proportion of BLOQ data.27 For example, Xu et al.27 demonstrated that ignoring ≤10% of BLOQ data has minimal impact on the model parameter estimates for one-compartment models, whereas more pronounced impact on the estimation of peripheral compartment parameters (Vp, Q, and their associated IIV) becomes apparent when the percentage of BLOQ data is >5%, but with limited impact on precision of estimates on the central parameters such as CL, Vd, and ka. Considering that the assay for tobramycin concentrations is sensitive, with a LLOQ of 0.05 µg/ml, the BLOQ values were low in incidence (6.8%) and observed at times well into the terminal clearance phase, and because the terminal phase contributes minimally to the relevant exposure metrics, excluding the BLOQ concentrations from the model is not expected to affect the final model significantly.
Population pharmacokinetic modeling plays an important role in drug development, enabling the investigation of factors that may explain some of the variability of the data and leading to a better prediction of clinical response in individual patients,18,28 even when sampling is minimal. Two previous population pharmacokinetic modeling studies of inhaled products have looked at the variability of pharmacokinetic parameters caused by demographic variables.20,29 The population pharmacokinetic model of an inhalation solution of levofloxacin for use via a nebulizer in patients with CF showed overlap in pharmacokinetic exposure with each dose of levofloxacin, representing interpatient variability,20 whereas modeling of an inhaled powder form of zanamivir for patients with influenza showed that demographic variables or levels of infection did not affect the variability of pharmacokinetic parameters.29 Here we have developed a population pharmacokinetic model to describe the serum concentration–time course of tobramycin in CF patients following inhalation of TIP. Our results demonstrate a statistically significant effect of BMI and FEV1% predicted on Vd/F but no clinically significant impact on tobramycin Cmax or Ctrough in CF patients.
Methods
Included studies
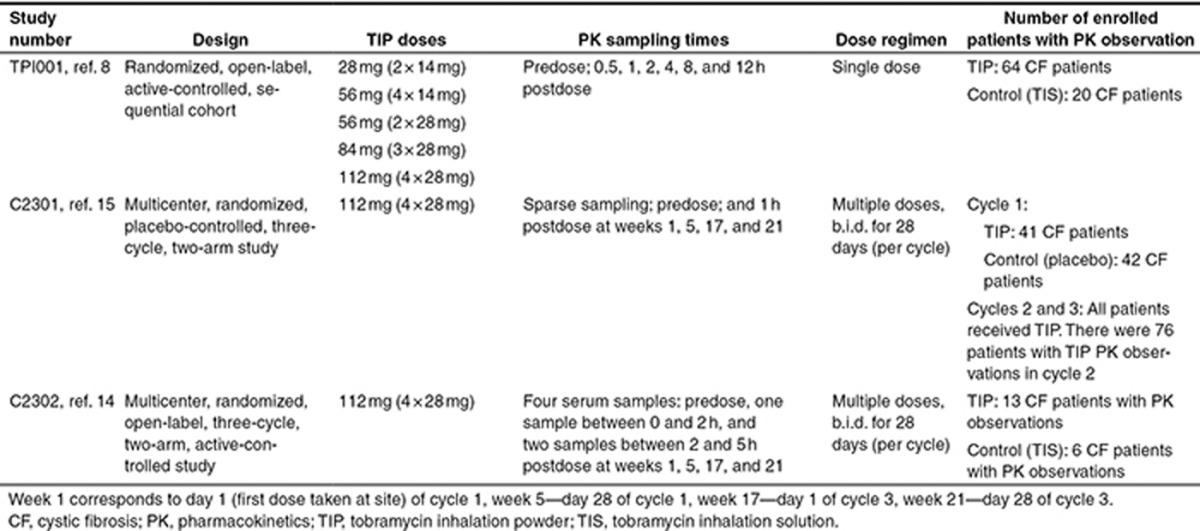
Serum concentration data for TIP from three clinical studies (one phase I (TPI001) and two phase III studies (C2301 and C2302)) were pooled to generate a pharmacokinetic analysis data set for modeling (Table 3).9,15,16 After exclusion of missing data, 662 concentration–time observations from 139 CF patients dosed with 28, 56, 84, or 112 mg single dose, as well as 112 mg b.i.d. multiple doses, were included.
Table 3. Summary of included studies.
Missing and outlying data
Missing sampling time was imputed from the corresponding dose–time course if the study protocol specified the sampling time schedule. Missing values for FEV1% predicted were replaced with the most recent previous value. In total, 28/1,031 tobramycin concentration observations were omitted from analysis due to missing sampling time or dose information.
In study C2301, 72 tobramycin concentrations from 21 subjects did not have FEV1% assessment information. All 72 concentration records were excluded from the analysis. After the above exclusions, there were a total of 931 concentration records left in the analysis data set, with 6.8% of them (63 concentrations) below LLOQ. After exclusion of concentrations below LLOQ and outlying concentrations identified from the original report, there were 859 concentrations in the analysis data set before exclusion of samples beyond validated stability storage period in study C2302. After exclusion of affected C2302 samples, there were 662 concentration values from 139 subjects in the population pharmacokinetic analysis data set.
Outlying data were identified by visual inspection and excluded from the analysis. Four subjects from study TPI001 were excluded, either because they did not receive the dose or because they received less than a full dose of tobramycin. Three outliers in study C2301 and six outliers in study C2302 (incorrect sample dates/times or discrepancy between elapsed time and visit) were excluded.
Data analysis and modeling methods
The model was developed using the nonlinear mixed-effects modeling (NONMEM) software program NONMEM VI Version 2 (Reagents of the University of California, San Francisco, CA) Standard and the first-order conditional estimation method with interaction (NONMEM coding provided in Supplementary Appendix). The change in the NONMEM objective function value and goodness-of-fit plots were used to guide the model development. One- and two-compartment disposition models with first-order absorption and first-order elimination were evaluated based on the previous knowledge of the pharmacokinetic properties of the compound from a single-dose study.9 IIV was assessed on all structural model parameters, as was interoccasion variability (the occasion variable was derived based on the visit number: it was assumed that concentrations measured at different study visits represented distinct occasions). The pharmacokinetic parameters (ka, volumes, and clearances) were assumed to be log-normally distributed around the population mean, but the random effects to describe both IIV and interoccasion variability were assumed to be distributed with a mean of zero. The effects of covariates (age, BMI, creatinine clearance, sex, FEV1% predicted at baseline, and weight) on the pharmacokinetic model were investigated once an adequate structural and stochastic model had been finalized. Age was categorized into three groups: 6–11, 12–17, and ≥18 years. Each covariate was tested individually against the key structural model parameters ka, Vd/F, and CL/F in a stepwise fashion (forward inclusion). After each step, the strongest covariate relationship was incorporated into the model, and the others sequentially and individually retested, until no further covariates could be added with statistical significance. The inclusion of a covariate term was considered statistically significant if it produced a difference of 3.84 (P = 0.05, given a single degree of freedom) in the NONMEM objective function value during the forward inclusion and if it produced an objective function value difference of 6.64 (P = 0.01, given a single degree of freedom) during the backward elimination. A combination of proportional and additive error models was used. The visual predictive check was used to provide an assessment of the model's ability to describe the data and the model's suitability for simulation. For the covariates identified after the stepwise process, 1,000 simulations were performed to evaluate their effect on the drug exposure at steady state using the following metrics: Cmax and Ctrough. The sensitivity of each metric to a given covariate was evaluated by simulation using different percentile values of the covariate distribution in the pharmacokinetic population, while keeping values of the other identified covariates in the model fixed at their median values in the pharmacokinetic population. These simulations were undertaken using the population parameter estimates from the final model and the IIV values of pharmacokinetic parameters, and they yielded the metrics of interest and their 95% predictive intervals. Further details of the modeling methods can be found in the Supplementary Appendix.
Author Contributions
L.T., S.A., S.G.B., R.R., P.T., and D.E.G. wrote the manuscript. L.T. and S.G.B. designed the research. L.T. and S.G.B. performed the research. S.A., R.R., and L.T. analyzed the data.
Conflict of Interest
This research was sponsored by Novartis Pharma AG, Basel, Switzerland, who had involvement in the study design; the collection, analysis, and interpretation of data; writing of the report; and the decision to submit the paper. D.E.G. has received income from Aptalis, Genentech, KaloBios, and Novartis Pharmaceuticals, for consulting activities (in the past 12 months), and from Novartis and Vertex for speaking engagements. S.A., S.G.B., L.T., R.R., and P.T. are employees of Novartis.
Study Highlights
Acknowledgments
The authors thank the participants with CF and their families who took part in these studies, as well as the investigators and coordinators at each study site. The authors acknowledge Ivan Demin from Novartis and former Novartis employees Srikumar Sahasranaman, Kai Wu, and Alison Carter for their scientific contribution to the research. The authors were assisted in the preparation of the manuscript by Mary Sayers and Naomi Marshall, professional medical writers contracted to CircleScience (Macclesfield, UK), and Mark Fedele (Novartis). Writing support was funded by the study sponsor.
Supplementary Material
References
- Ballmann M., Rabsch P., von der Hardt H. Long-term follow up of changes in FEV1 and treatment intensity during Pseudomonas aeruginosa colonisation in patients with cystic fibrosis. Thorax. 1998;53:732–737. doi: 10.1136/thx.53.9.732. [DOI] [PMC free article] [PubMed] [Google Scholar]
- Cystic Fibrosis Foundation. Cystic Fibrosis Foundation Patient Registry Annual Data Report. <http://www.cff.org/UploadedFiles/research/ClinicalResearch/Patient-Registry-Report-2009.pdf > Accessed 26 September 2011.
- Emerson J., Rosenfeld M., McNamara S., Ramsey B., Gibson R.L. Pseudomonas aeruginosa and other predictors of mortality and morbidity in young children with cystic fibrosis. Pediatr. Pulmonol. 2002;34:91–100. doi: 10.1002/ppul.10127. [DOI] [PubMed] [Google Scholar]
- Henry R.L., Mellis C.M., Petrovic L. Mucoid Pseudomonas aeruginosa is a marker of poor survival in cystic fibrosis. Pediatr. Pulmonol. 1992;12:158–161. doi: 10.1002/ppul.1950120306. [DOI] [PubMed] [Google Scholar]
- Kosorok M.R., et al. Acceleration of lung disease in children with cystic fibrosis after Pseudomonas aeruginosa acquisition. Pediatr. Pulmonol. 2001;32:277–287. doi: 10.1002/ppul.2009.abs. [DOI] [PubMed] [Google Scholar]
- Sweetman S.C. The Complete Drug Reference. Pharmaceutical Press; London; 2009. [Google Scholar]
- Döring G., Hoiby N. Consensus Study Group Early intervention and prevention of lung disease in cystic fibrosis: a European consensus. J. Cyst. Fibros. 2004;3:67–91. doi: 10.1016/j.jcf.2004.03.008. [DOI] [PubMed] [Google Scholar]
- Flume P.A., et al. Cystic Fibrosis Foundation, Pulmonary Therapies Committee Cystic fibrosis pulmonary guidelines: chronic medications for maintenance of lung health. Am. J. Respir. Crit. Care Med. 2007;176:957–969. doi: 10.1164/rccm.200705-664OC. [DOI] [PubMed] [Google Scholar]
- Geller D.E., Konstan M.W., Smith J., Noonberg S.B., Conrad C. Novel tobramycin inhalation powder in cystic fibrosis subjects: pharmacokinetics and safety. Pediatr. Pulmonol. 2007;42:307–313. doi: 10.1002/ppul.20594. [DOI] [PubMed] [Google Scholar]
- Dodd M.E., Webb A.K. Understanding non-compliance with treatment in adults with cystic fibrosis. J. R. Soc. Med. 2000;93 suppl. 38:2–8. [PMC free article] [PubMed] [Google Scholar]
- Briesacher B.A., Quittner A.L., Saiman L., Sacco P., Fouayzi H., Quittell L.M. Adherence with tobramycin inhaled solution and health care utilization. BMC Pulm. Med. 2011;11:5. doi: 10.1186/1471-2466-11-5. [DOI] [PMC free article] [PubMed] [Google Scholar]
- Sawicki G.S., Sellers D.E., Robinson W.M. High treatment burden in adults with cystic fibrosis: challenges to disease self-management. J. Cyst. Fibros. 2009;8:91–96. doi: 10.1016/j.jcf.2008.09.007. [DOI] [PMC free article] [PubMed] [Google Scholar]
- Zemanick E.T., et al. Measuring and improving respiratory outcomes in cystic fibrosis lung disease: opportunities and challenges to therapy. J. Cyst. Fibros. 2010;9:1–16. doi: 10.1016/j.jcf.2009.09.003. [DOI] [PMC free article] [PubMed] [Google Scholar]
- Geller D.E., Weers J., Heuerding S. Development of an inhaled dry-powder formulation of tobramycin using PulmoSphere™ technology. J. Aerosol Med. Pulm. Drug Deliv. 2011;24:175–182. doi: 10.1089/jamp.2010.0855. [DOI] [PMC free article] [PubMed] [Google Scholar]
- Konstan M.W., et al. Safety, efficacy and convenience of tobramycin inhalation powder in cystic fibrosis patients: the EAGER trial. J. Cyst. Fibros. 2011;10:54–61. doi: 10.1016/j.jcf.2010.10.003. [DOI] [PMC free article] [PubMed] [Google Scholar]
- Konstan M.W., Geller D.E., Minic P., Brockhaus F., Zhang J., Angyalosi G. Tobramycin inhalation powder for P. aeruginosa infection in cystic fibrosis: the EVOLVE trial. Pediatr. Pulmonol. 2011;46:230–238. doi: 10.1002/ppul.21356. [DOI] [PMC free article] [PubMed] [Google Scholar]
- Geller D.E. The science of aerosol delivery in cystic fibrosis. Pediatr Pulmonol. 2008;43:S5–S17. [Google Scholar]
- Bonate P.L. Recommended reading in population pharmacokinetic pharmacodynamics. AAPS J. 2005;7:E363–E373. doi: 10.1208/aapsj070237. [DOI] [PMC free article] [PubMed] [Google Scholar]
- Maier G., Rubino C., Hsu R., Grasela T., Baumgartner R.A. Population pharmacokinetics of ®-albuterol and (S)-albuterol in pediatric patients aged 4-11 years with asthma. Pulm. Pharmacol. Ther. 2007;20:534–542. doi: 10.1016/j.pupt.2006.05.003. [DOI] [PubMed] [Google Scholar]
- Rubino C., Griffith D.C., Forrest A. Sputum and serum population pharmacokinetics (PPK) after administration of MP-376 (Levofloxacin Inhalation Solution; Aeroquin®) to cystic fibrosis (CF) patients enrolled in a Phase 2 clinical trial. Pediatr. Pulmonol. 2010;2010 suppl. 33:339–340. [Google Scholar]
- UK Cystic Fibrosis Trust Antibiotic Working Group. Antibiotic treatment for Cystic fibrosis.
- Kerem E., et al. on behalf of the ECFS Patient Registry Steering Group Factors associated with FEV1 decline in cystic fibrosis: analysis of the data of the ECFS Patient Registry. Eur. Respir. Je-pub ahead of print 18 April 2013. [DOI] [PubMed]
- Onhøj J., Thorsson L., Bisgaard H. Lung deposition of inhaled drugs increases with age. Am. J. Respir. Crit. Care Med. 2000;162:1819–1822. doi: 10.1164/ajrccm.162.5.2002132. [DOI] [PubMed] [Google Scholar]
- Peng A.W., Hussey E.K., Rosolowski B. Pharmacokinetics and tolerability of a single inhaled dose of zanamivir in children. Curr. Ther. Res. Clin. Exp. 2000;61:36–46. [Google Scholar]
- Beal S.L. Ways to fit a PK model with some data below the quantification limit. J. Pharmacokinet. Pharmacodyn. 2001;28:481–504. doi: 10.1023/a:1012299115260. [DOI] [PubMed] [Google Scholar]
- Dorababu M. Pharmacokinetic modeling of data with below quantification limit. J. Bioequiv. Availab. 2012;4:2–3. [Google Scholar]
- Xu X.S., Dunne A., Kimko H., Nandy P., Vermeulen A. Impact of low percentage of data below the quantification limit on parameter estimates of pharmacokinetic models. J. Pharmacokinet. Pharmacodyn. 2011;38:423–432. doi: 10.1007/s10928-011-9201-9. [DOI] [PubMed] [Google Scholar]
- Tett S.E., Holford N.H.G., McLachlan A.J. Population pharmacokinetics and pharmacodynamics: an underutilized resource. Drug Inf. J. 1998;32:693–710. [Google Scholar]
- Peng A.W., Hussey E.K., Moore K.H. A population pharmacokinetic analysis of zanamivir in subjects with experimental and naturally occurring influenza: effects of formulation and route of administration. J. Clin. Pharmacol. 2000;40:242–249. doi: 10.1177/00912700022008900. [DOI] [PubMed] [Google Scholar]
Associated Data
This section collects any data citations, data availability statements, or supplementary materials included in this article.


