Abstract
Cyclosporine, everolimus, and tacrolimus are the cornerstone of immunosuppressive therapy in renal transplantation. These drugs are characterized by narrow therapeutic windows, highly variable pharmacokinetics (PK), and metabolism by CYP3A enzymes. Recently, the decreased activity allele, CYP3A4*22, was described as a potential predictive marker for CYP3A4 activity. This study investigated the effect of CYP3A4*22, CYP3A5*3, and CYP3A combined genotypes on cyclosporine, everolimus, and tacrolimus PK in renal transplant patients. CYP3A4*22 carriers showed a significant lower clearance for cyclosporine (−15%), and a trend was observed for everolimus (−7%) and tacrolimus (−16%). Patients carrying at least one CYP3A5*1 allele had 1.5-fold higher tacrolimus clearance compared with noncarriers; however, CYP3A5*3 appeared to be nonpredictive for everolimus and cyclosporine. CYP3A combined genotype did not significantly improve prediction of clearance compared with CYP3A5*3 or CYP3A4*22 alone. These data suggest that dose individualization of cyclosporine, everolimus, or tacrolimus therapy based on CYP3A4*22 is not indicated.
Cyclosporine, everolimus, and tacrolimus are the cornerstone of maintenance immunosuppressive therapy in renal transplantation. These drugs are characterized by a small therapeutic window and highly variable pharmacokinetics (PK), which makes therapeutic drug monitoring (TDM) essential for maintaining adequate exposure and preventing serious drug-related toxicities.1,2,3
Cyclosporine, everolimus, and tacrolimus are primarily metabolized by cytochrome P450 enzymes, CYP3A4 and CYP3A5.4,5,6,7 Differences in activity of these metabolizing enzymes are likely to be responsible for a significant part of the interindividual variability in PK.8,9 Genetic polymorphisms in genes encoding these metabolizing enzymes have previously been found to explain a part of the variability in PK of these immunosuppressive drugs.1,10,11,12,13,14 Recently, the decreased activity allele CYP3A4*22 was identified as a novel predictive marker for tacrolimus PK;15,16 however, these findings have not been successfully reproduced.11 CYP3A4*22 has also been investigated to a less extent in cyclosporine PK, but its effect on everolimus PK is still unknown.15,16,17 CYP3A5*3 was studied before in relation to PK of everolimus, tacrolimus, and cyclosporine,10,18,19,20 but the CYP3A combined genotype (CYP3A4 and CYP3A5), which most likely better reflect CYP3A activity, has only been evaluated for tacrolimus.15
The studies investigating the effect of CYP3A4*22 on tacrolimus PK were limited by the use of trough concentrations and lack of data on comedications, and did not use population PK analysis. Such an approach enables to differentiate between interpatient and intrapatient variability, which results in enhanced statistical power to identify factors influencing PK. Therefore, we investigated the effect of CYP3A4*22, CYP3A5*3, and CYP3A combined genotype on cyclosporine, everolimus, and tacrolimus PK using a population PK analysis.
Results
Clinical details
Cyclosporine. The cyclosporine data set consisted of 298 adult renal transplant recipients, 187 men and 111 women. The majority of patients (88%) were of Caucasian origin. Mean age was 51 ± 13 years (range: 18–73 years) and mean weight was 77 ± 15 kg (range: 41–141 kg). A total of 6,800 blood samples were collected.
Everolimus. A total of 97 adult renal transplant recipients, 62 men and 35 women, were included. The majority of patients (86%) were of Caucasian origin. Mean age was 51 ± 13 years (range: 22–71 years) and mean weight was 79 ± 15 kg (range: 50–129 kg). The data set consisted of 1,807 blood samples.
Tacrolimus. A total of 101 adult renal transplant recipients, 56 men and 45 women, were included in this analysis. The majority of patients (77%) were of Caucasian origin. Mean age was 51 ± 14 years (range: 15–77 years) and mean weight was 76 ± 9 kg (range: 40–114 kg). The data set consisted of 921 blood samples.
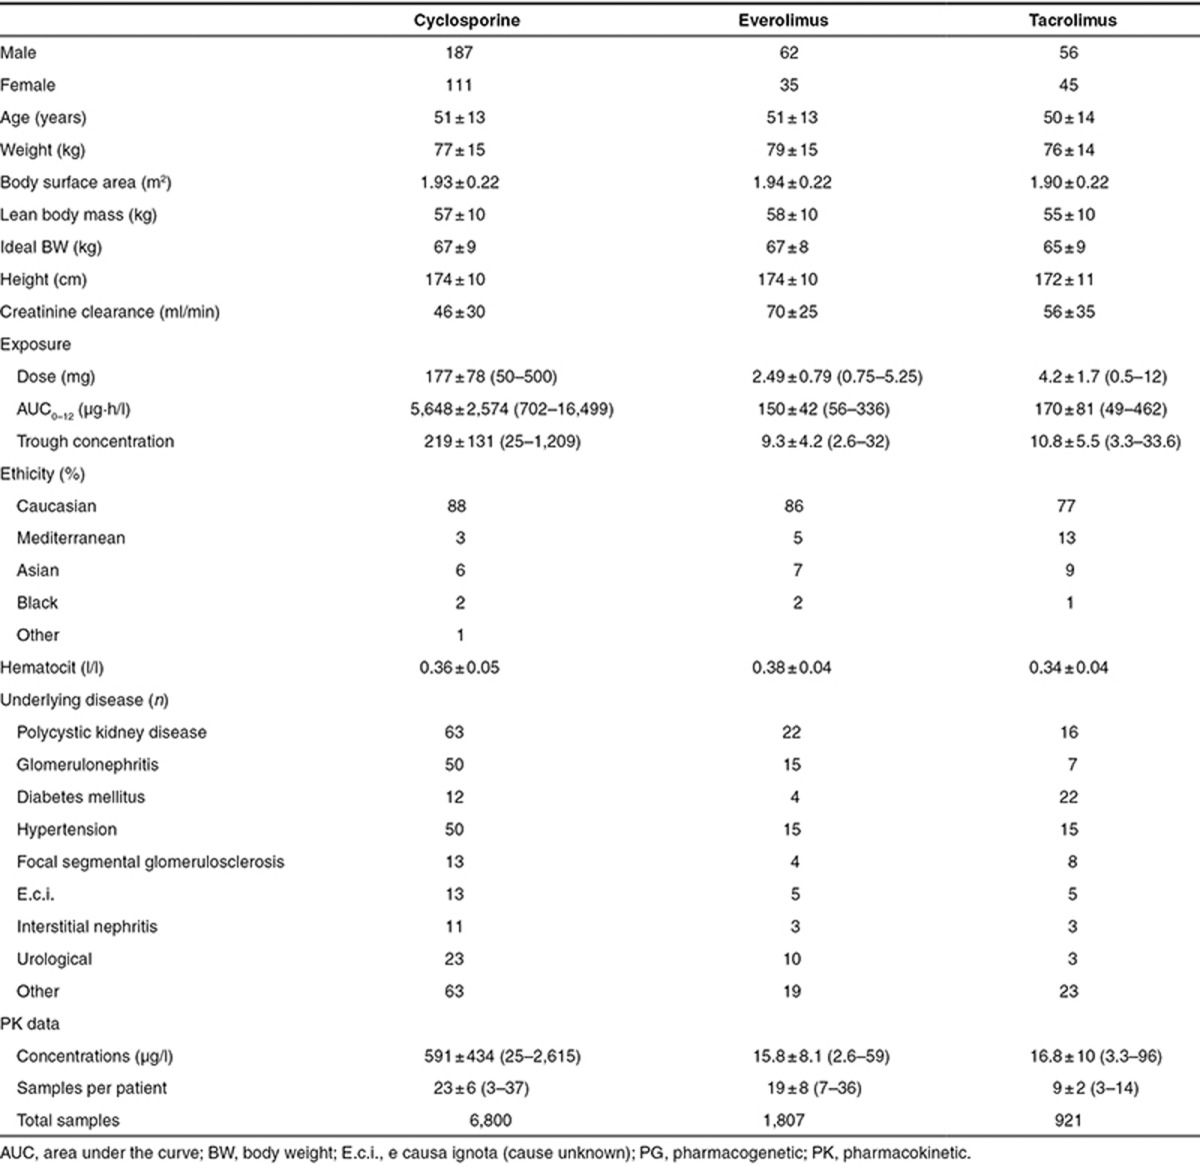
The concentration–time data were reviewed for completeness and consistency of sampling and dosing times. All measured concentrations were above the lower limit of quantification. Baseline characteristics of the included patients are presented in Table 1.
Table 1. Baseline characteristics of the patients included in the population PK/PG analyses.
Genotyping
The distributions of all single-nucleotide polymorphisms were in Hardy–Weinberg equilibrium. The distributions of the investigated CYP3A5 and CYP3A4 polymorphisms are listed in Table 2. Allele frequencies found in our data set corresponded with those published previously.15,21,22 To investigate the combined effect of CYP3A4*22 and CYP3A5*3, genotype clusters were made as follows:
Table 2. Genotype distribution in study population.
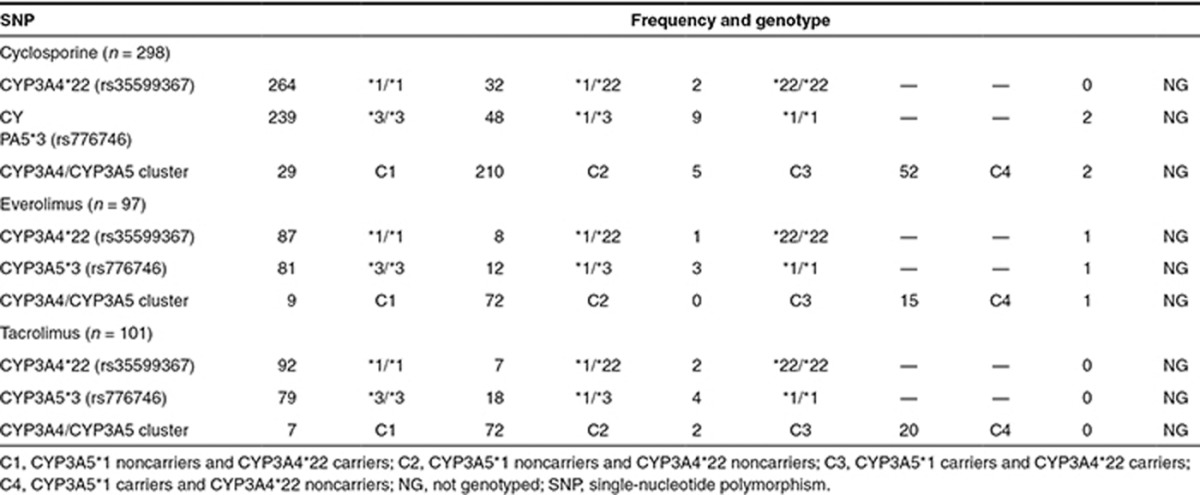
Slow metabolizers (C1): no CYP3A5 activity (CYP3A5*3/*3) and at least one decreased activity allele in CYP3A4 (CYP3A4*22/*22 or CYP3A4*1/*22); intermediate metabolizers group 1 (C2): no CYP3A5 activity (CYP3A5*3/*3) and no decreased activity allele in CYP3A4 (CYP3A4*1/*1); intermediate metabolizers group 2 (C3): carriers of at least one increased activity allele in CYP3A5 (CYP3A5*1/*1 or CYP3A5*1/*3) and at least one decreased activity allele in CYP3A4 (CYP3A4*22/*22 or CYP3A4*1/*22); and extensive metabolizers (C4): carriers of at least one increased activity allele in CYP3A5 (CYP3A5*1/*1 or CYP3A5*1/*3) and no decreased activity allele in CYP3A4 (CYP3A4*1/*1).
Concomitant medication
An overview of concomitant immunosuppressive and nonimmunosuppressive medication with possible interaction of PK in the different groups is presented in Supplementary Table I.
Population PK modeling
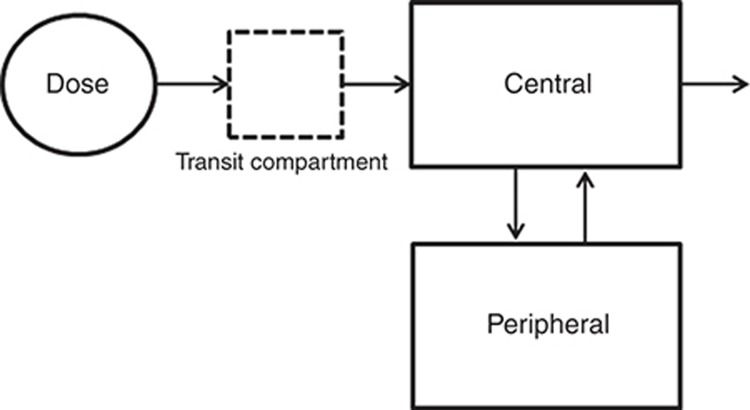
The PK data of cyclosporine, everolimus, and tacrolimus were best described by a two-compartmental model with first-order absorption and first-order elimination from the central compartment. The delayed absorption of everolimus and tacrolimus was best described with a lag time, and the delayed absorption of cyclosporine was best described with a transit compartment, using a first-order rate constant describing the transfer from the dose compartment into the transit compartment and subsequently into the central compartment (Figure 1). Random-effect parameters for interindividual variability in clearance (CL) and volume of central compartment (Vc) were identified for all three drugs. Random-effect parameters for interindividual variability in the rate of absorption (Ka) were identified for cyclosporine and everolimus. For tacrolimus, a random-effect parameter for interindividual variability was identified for bioavailability. Variability between occasions (interoccasion variability) was best described with a random effect on (fixed) bioavailability (F) for cyclosporine, everolimus, and tacrolimus. For everolimus also interoccasion variability on Ka was identified. The random effects were tested for structural relationship with dose and time to create a model with unbiased and randomly distributed random effects for covariate analysis.
Figure 1.
Schematic representation of the linear two-compartment model with first-order absorption and elimination of cyclosporine, including the transit compartment to describe the absorption phase.
The structural PK model of cyclosporine indicated an apparent clearance (CL/F) of 15.9 l/h, with the bioavailability term fixed to 0.5, an apparent central distribution volume (Vc/F) of 59.6 l, and an apparent peripheral distribution volume of 99.7 l. The absorption rate constant was 2.1 h−1. Intercompartmental clearance was 13.1 l/h. Interoccasion variability was estimated for the fixed bioavailability term and not for clearance because of a better model fit.
The structural PK model of everolimus indicated an apparent clearance (CL/F) of 16.7 l/h, with the bioavailability term fixed to 1, an apparent central distribution volume (Vc/F) of 144 l, and an apparent peripheral distribution volume of 348 l. The absorption rate constant was 7.36 h−1. Intercompartmental clearance was 42.7 l/h, and lag time was 0.71 h. Interoccasion variability was estimated for the fixed bioavailability term and not for clearance because of a better model fit.
A dose–clearance relationship was observed showing an increase in apparent clearance with increasing dose according to typical value of clearance (TVCL) = {[dose/2.5]*0.34}. This relationship improved the model fit in terms of objective function. The effect appeared to be caused by strict TDM. Patients with high everolimus blood levels (i.e., with a lower clearance) were titrated to receive lower doses and vice versa to reach the stable target area under the curve (AUC)0−12h of 120 μg·h/l. Subsequently, an apparent dose–clearance relationship emerges. Additional tests described by Ahn et al.23 were performed, and it was confirmed that this effect was caused by strict TDM. Since two different assays were used for the determination of everolimus blood concentrations (liquid chromatography–tandem mass spectrometry and fluorescent polymerization immunoassay (FPIA)), a residual error for each assay was incorporated in the model. The model improved by adding an additive error to the FPIA data. This overestimation of FPIA was expected as investigated previously.24
The structural PK model of tacrolimus indicated an apparent clearance (CL/F) of 5.7 l/h, with the bioavailability term fixed to 0.23, an apparent central distribution volume (Vc/F) of 20.5 l, and an apparent peripheral distribution volume of which was fixed to 500 l. The absorption rate constant was 0.55 h−1. Intercompartmental clearance was 17.2 l/h, and lag time was 0.809 h. Interoccasion variability was estimated for the fixed bioavailability term. The PK data of cyclosporine showed interindividual variability in CL/F of 23.5% and interoccasion variability (22.7%). Everolimus data revealed an interindividual variability in CL/F of 28.8% and interoccasion variability (26.4%). Tacrolimus showed considerably higher interindividual variability in CL/F of 42.2% and interoccasion variability (35.5%).
Covariate analysis
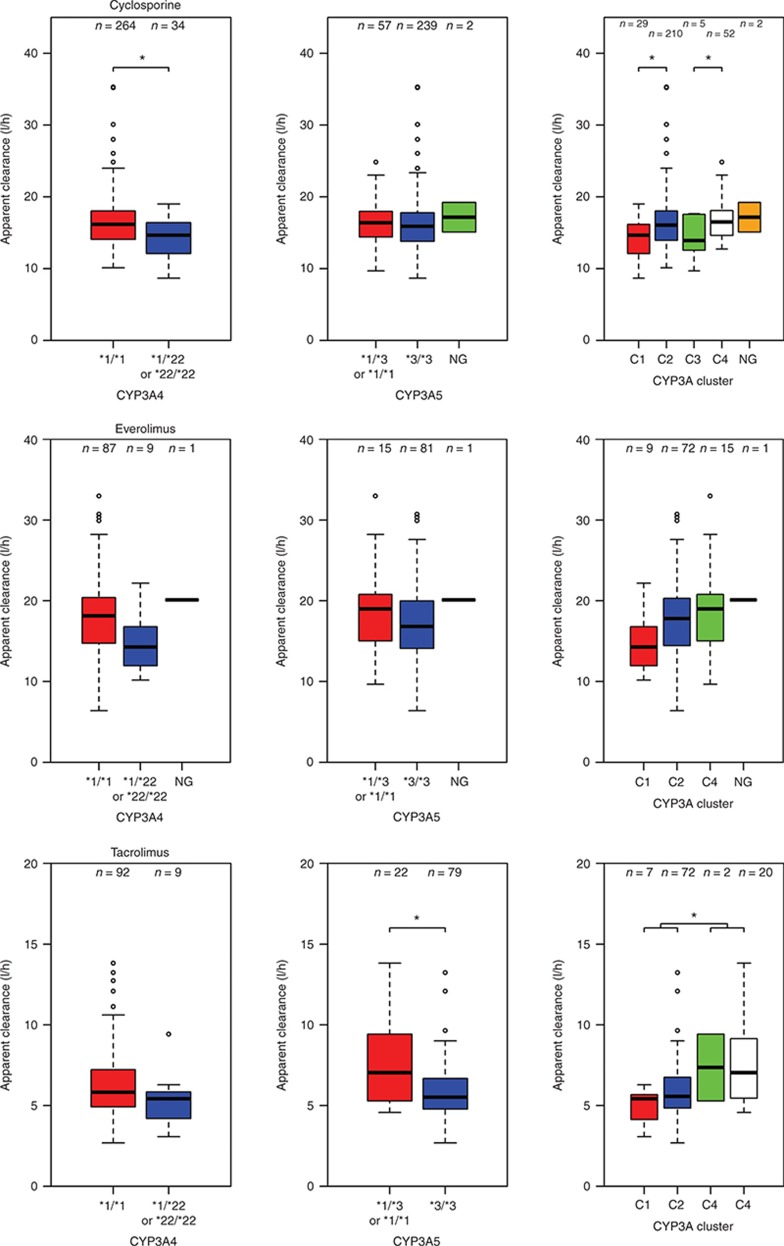
Pharmacogenetics. In Table 3, the summary of the univariate pharmacogenetic covariate analysis is presented. CYP3A4*22 was significantly associated with cyclosporine CL/F, and patients who carried at least one decreased activity allele in CYP3A4*22 had a 15% lower clearance compared with noncarriers. CYP3A combination showed a significant effect; C1, C2, and C3 showed lower clearance compared with C4 (−16, −2, and −12%, respectively). Everolimus PK did not reveal a significant relation with CYP3A5*3 and CYP3A4*22, nor the CYP3A genotype combination. For tacrolimus, CYP3A5*3 was significantly associated with tacrolimus CL/F. Carriers of at least one CYP3A5*1 allele had 53% higher clearance compared with noncarriers. In contrast, CYP3A4*22 as covariate on CL/F did not result in a significant objective function drop (P = 0.218). Although not significant, a trend of 16% lower tacrolimus clearance was observed for CYP3A4*22 allele carriers. CYP3A combination showed a significant effect on tacrolimus clearance. C1, C2, and C3 showed lower clearance compared with C4 (−47, −33, and −3%, respectively). Although significant, the genetic covariates explained variability in clearance to a limited degree. In Figure 2, box plots of clearance vs. genotype are presented for cyclosporine, everolimus, and tacrolimus, and the figure also shows the significant variability within the genotype groups.
Table 3. Summary of CYP3A4 and CYP3A5 covariate analysis.
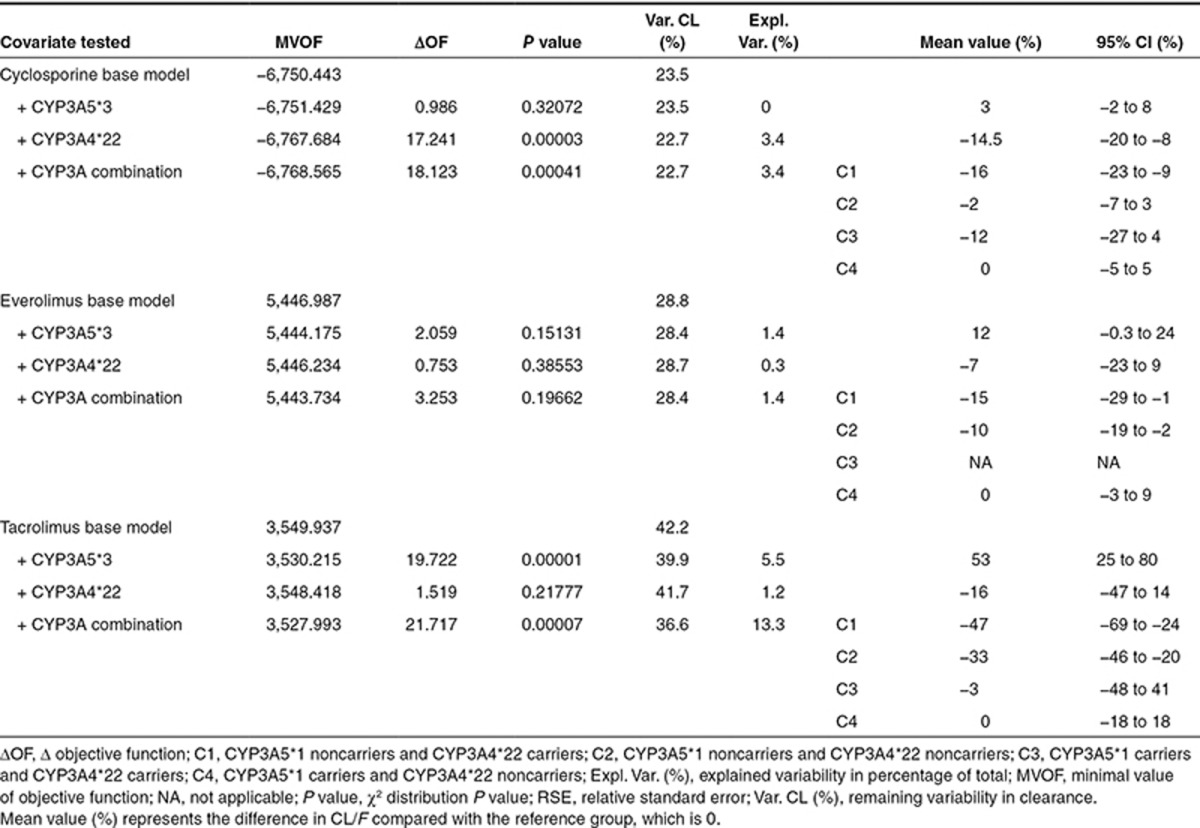
Figure 2.
Box plots representing the average cyclosporine, everolimus, and tacrolimus apparent clearance (l/h) of the different genotype groups with error bars and the number of patients in each group. CYP3A4 (*1/*1 = CYP3A4*22 noncarriers, *1/*22 or *22/*22 = CYP3A4*22 carriers, NG = not genotyped), CYP3A5 (*1/*3 or *1/*1 = CYP3A5*1 carriers, *3/*3 = CYP3A5*1 noncarriers, NG = not genotyped), and CYP3A cluster: (C1: CYP3A5*3/*3 and CYP3A4*22/*22 or CYP3A4*1/*22, C2: CYP3A5*3/*3 and CYP3A4*1/*1, C3: CYP3A5*1/*1 or CYP3A5*1/*3 and CYP3A4*22/*22 or CYP3A4*1/*22, and C4: CYP3A5*1/*1 or CYP3A5*1/*3 and CYP3A4*1/*1, NG = not genotyped). *P < 0.01. Apparent clearance was calculated using the base model.
Demographics. The demographic covariates that showed a possible relation with the PK of the drugs in the diagnostic plots were evaluated in the covariate analysis. Univariate analysis (P < 0.05) on cyclosporine showed significant associations for the following demographic covariates: body weight (BW) on CL/F and Vc/F, prednisolon dose ≥20 mg on Ka and F for cyclosporine, ideal BW on Vc/F and hematocrit on CL/F for everolimus. Significant demographic covariates for tacrolimus were prednisolone dose ≥25 mg on F and hematocrit on CL/F. The remaining demographic covariates such as ethnicity and other comedication that were evaluated in this study were not significant on CL/F, Vc/F, or Ka.
After the forward inclusion and backward elimination step, the following covariates remained significant (P < 0.01):
Cyclosporine: BW on CL/F and Vc/F, prednisolon dose ≥20 mg on Ka and F (better model fit and objective function drop compared with prednisolon dose on CL/F), and CYP3A4*22 on CL/F. Interindividual variability of CL/F decreased from 23.5 to 22.6%. In Supplementary Table II, all significant covariates improving model fit together with their effects on observed variability are presented for cyclosporine, everolimus, and tacrolimus. Everolimus: ideal BW centered on the population median as exponential function on Vc/F improved the model, reducing the random variability between individuals in Vc/F by 12%. Hematocrit was lost in the forward elimination step (P > 0.01) and was, therefore, not incorporated in the final model. Significant covariates for tacrolimus were found in prednisolone dose ≥25 on F (higher objective function drop compared with prednisolon dose on CL/F), CYP3A5*3 and hematocrit on tacrolimus CL/F. Incorporation of these covariates decreased the interindividual variability of CL/F from 42.2 to 39.1%, and the interoccasion variability was reduced from 35.5 to 29.3%.
The population PK parameters obtained with the base and final models are presented in Table 4 (Supplementary Models 1-3). Evaluation of the precision of the PK parameters of all three models was performed with 1,000 bootstrap replications. The percentage of successful runs was 99% for cyclosporine, 82% for everolimus, and 96% for tacrolimus. Moreover, the parameter estimates of the nonsuccessful runs were analyzed and did not deviate from the parameter estimates of the successful runs. The mean values for all fixed-effect parameters were within 15% of those obtained by the final model, indicating good reliability. Since different dosages were used during the study, the performance of the model was evaluated with a prediction-corrected visual predictive check (VPC).25 Predictive and observed intervals (10%, 90%, and median) are almost identical showing good predictive performance of the final models (Figure 3).
Table 4. Summary of model parameter estimates cyclosporine, everolimus, and tacrolimus.
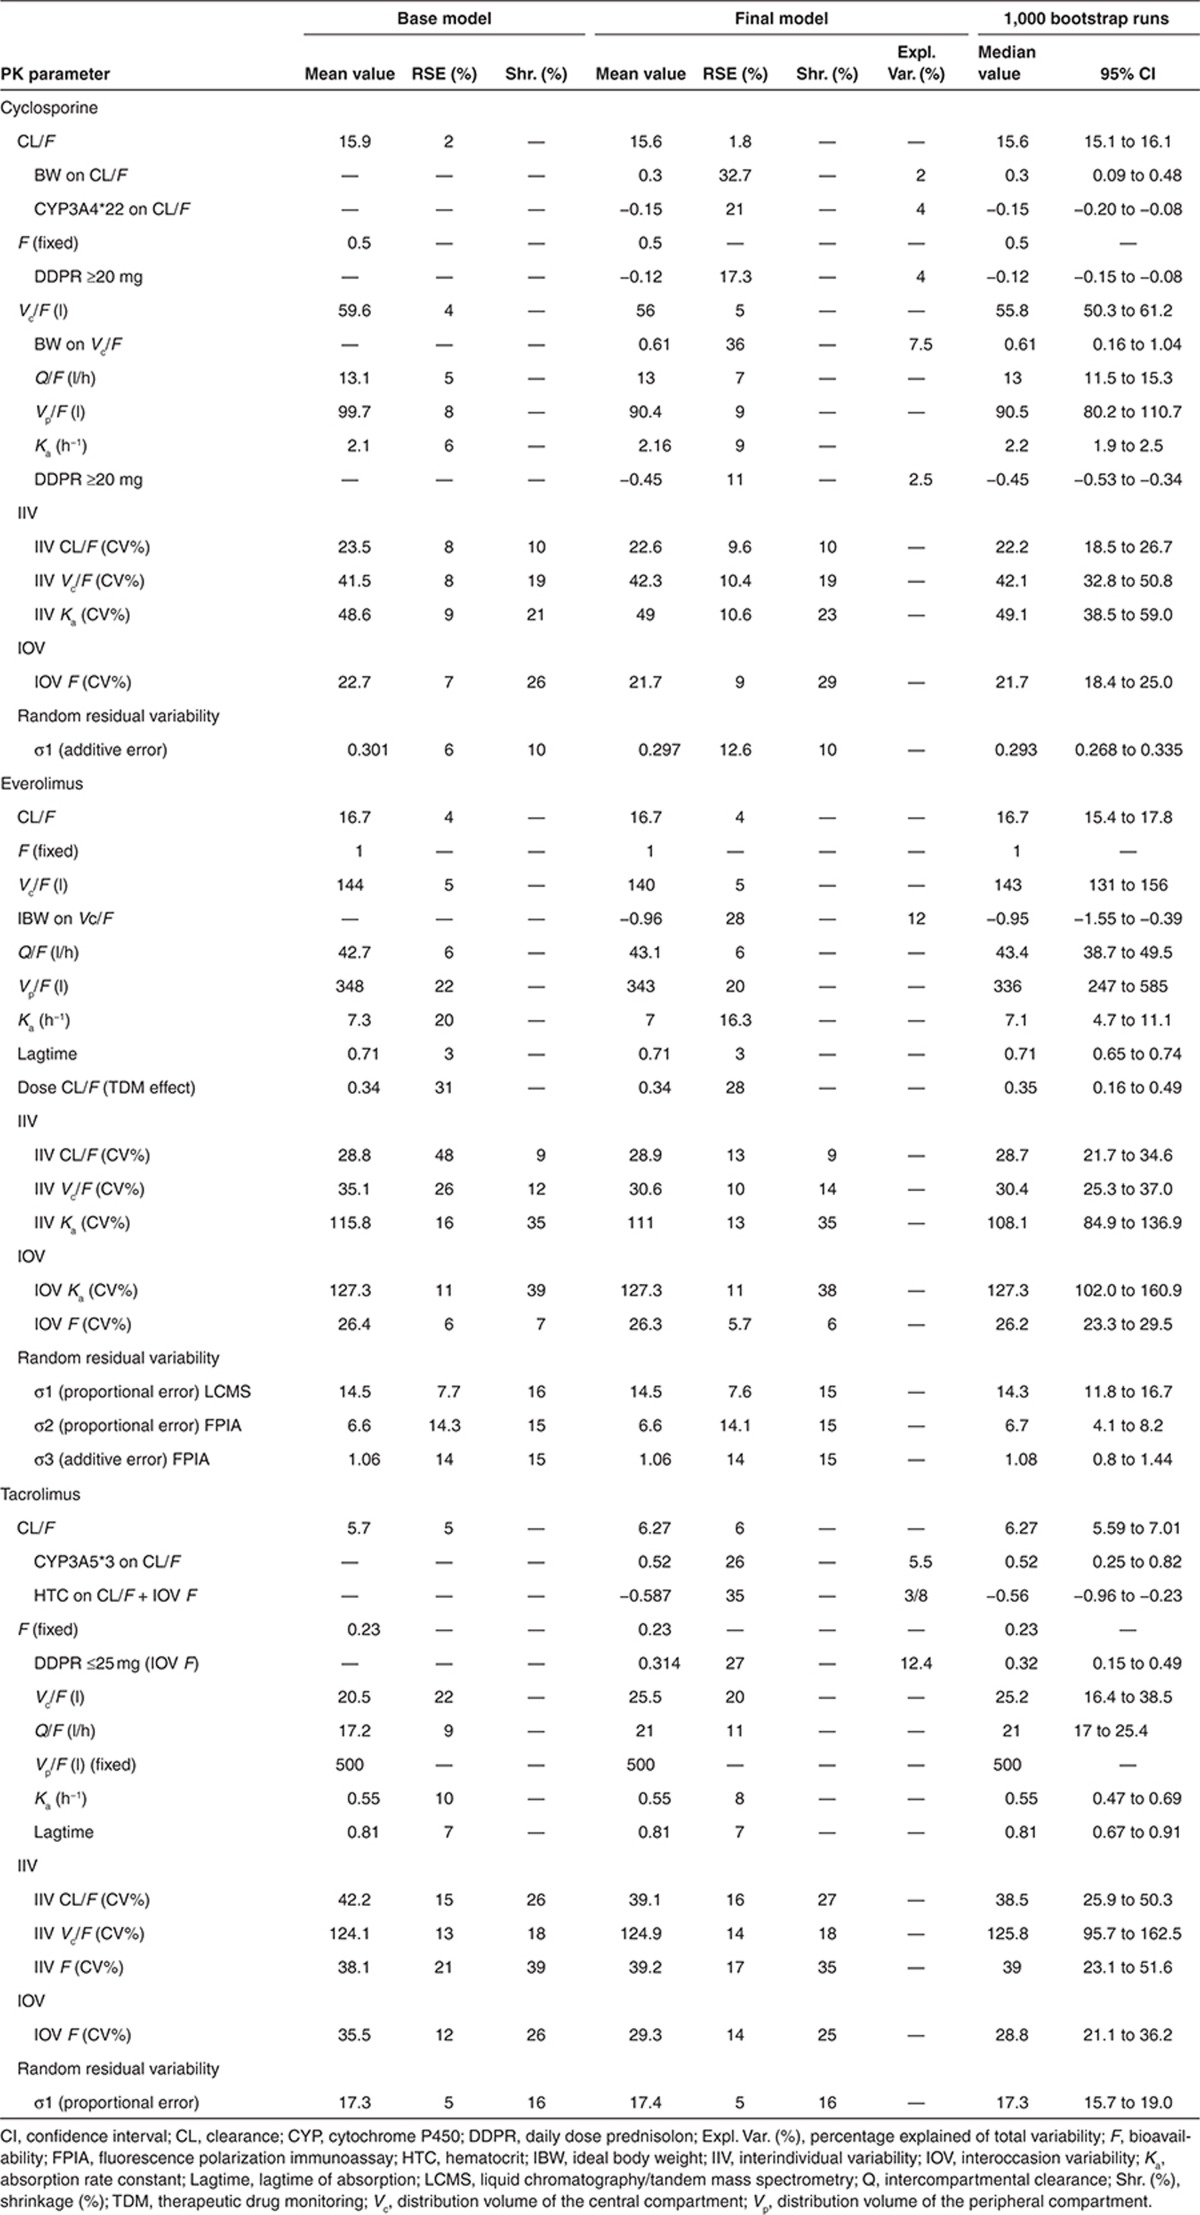
Figure 3.
Prediction-corrected visual predictive checks with 80% prediction interval of cyclosporine, everolimus, and tacrolimus. The observed concentrations are shown as solid circles. The solid lines with open circles represent the observation intervals. The solid lines represent the prediction interval. The shaded areas around the prediction intervals represent the 95% confidence interval around each of the prediction interval.
Discussion
This is the first comprehensive study investigating the influence of CYP3A4*22 and CYP3A5*3 variant alleles and its combined clusters on the PK of the three main kidney transplant immunosuppressive drugs cyclosporine, everolimus, and tacrolimus. This study demonstrates that carriership of the CYP3A4*22 allele is significantly associated with a decreased cyclosporine clearance. Carriers of the CYP3A4*22 allele showed 15% lower cyclosporine clearance as compared with noncarriers. Moreover, CYP3A genotype clusters were significantly associated with cyclosporine and tacrolimus clearance but not with everolimus clearance. Finally, this study also demonstrates that patients carrying at least one CYP3A5*1 allele have on average 53% higher tacrolimus clearance compared with noncarriers.
Cyclosporine, everolimus, and tacrolimus are primarily eliminated by CYP3A enzymes,4,5,6,26 and as shown before in in vitro and in vivo studies, CYP3A4 is involved in their PK.5,27,28 CYP3A4 is most likely predominant in cyclosporine and everolimus metabolic clearance, and CYP3A5 contributes more significantly to tacrolimus metabolic clearance compared with CYP3A4.5,6 In contrast to CYP3A5, CYP3A4 lacked a reliable genetic marker for prediction of CYP3A4 expression, which was suitable for dosing adjustments;29 however, CYP3A4*22 was recently marked as a potential reliable marker.15,16 In contrast, as part of our analysis, only a significant influence of CYP3A4*22 on cyclosporine PK was found, but a trend was also seen in tacrolimus (16% lower clearance (95% confidence interval: −47 to 14%)) and everolimus PK (7% lower clearance (95% confidence interval: −23 to 9%)). This effect is not high enough to justify dose modification based on CYP3A4*22. In clinical practice, only an effect of at least 20% on clearance will lead to dose adjustments, since these drugs also possess a considerable degree of intraindividual variability. Since the clinical studies from which all data were derived were not primarily designed to identify a genotype effect and the fact that we found no clinically relevant genotype effect for CYP3A4*22, we had to confirm afterwards that our study had enough power. Therefore, we performed a posterior power calculation using the stochastic simulation and estimation tool of the PsN toolkit to determine the power (95 and 99% confidence) of our study to find a clinically relevant genotype effect (at least 20%) on cyclosporine, everolimus, and tacrolimus PK.30,31 With the most unfavorable genotype distribution (CYP3A4*22) and the least amount of data (tacrolimus), we found a power of 95% (α = 0.01) and 91% (α = 0.01) in detecting a clinically relevant genotype (at least 20%) effect. It is therefore highly unlikely that our analysis was underpowered and missed a clinically relevant effect of the investigated genotypes due to limited sample size.
In contrast to our findings, the studies of Elens et al.15,32 and Gijsen et al.16 showed that CYP4A4*22 allele carriers required up to 30% lower tacrolimus doses compared with CYP3A4*1/*1 to reach target trough concentration. However, these exploratory findings have not been confirmed by another research group. Moreover, more recently, Santoro et al.11 presented a study in 140 renal transplant patients showing that independent effects of CYP3A4*22 on tacrolimus dose requirements could not be verified. The studies of Elens et al.15,32 had some limitations such that the data were not corrected for corticosteroid use or hematocrit levels. Corticosteroid and hematocrit levels are known to influence tacrolimus exposure12,33 and could therefore have influenced their results. The study of Gijsen et al.16 performed on a small data set had the limitation that they could not correct their results for comedication. Both studies15,16 only used trough levels in their analysis, which do not give a full insight in PK. The more recent study of Elens et al.32, in contrast, used an additional 59 whole PK curves to support their conclusion; however, since they were collected only on one occasion, intraindividual variability could not be assessed. To investigate whether shrinkage could have been the cause of the lack of significance of the CYP3A4*22 effect in this study, we also performed the univariate genetic covariate analysis with only the first PK profiles to be able to compare the results in more details with Elens et al. (see Supplementary Table III). The results were the same as with the complete data set, so therefore, the results found in the study of Elens et al.32 could not be replicated in our study. In another study by Elens et al.,17 no significant effect was found for cyclosporine trough concentrations and CYP3A4*22 carriership. Our analysis was based on an extensive amount of data consisting of AUCs. Moreover, a wide range of factors possibly influencing PK, including demographic factors and comedication, was also investigated.
The difference in tacrolimus clearance between CYP3A5*1 carriers and noncarriers found in the current analysis was similar to what was published previously.10,12 We confirmed with our study that dosing adjustments based on CYP3A5*3 could be indicated to quickly reach target exposure; however, the variability explained by CYP3A5*3 is limited, and the variability within the CYP3A5 genotype groups remains significant, and therefore, close TDM remains essential. The absence of a clinically relevant influence of CYP3A5*3 on cyclosporine and everolimus PK is in line with previous studies.29,34,35
Using CYP3A combined genotype of CYP3A4 and CYP3A5 as a predictor for cyclosporine, everolimus, or tacrolimus clearance does not seem to be an improvement compared with the individual polymorphisms. As shown in the results, the combined analysis did not further improve identification groups of slow metabolizers, intermediate metabolizers, and extensive metabolizers. For cyclosporine, the differences in average clearance between the groups remain less than 16%. For tacrolimus, a difference of 14% is introduced for noncarriers of the CYP3A5*1 allele by the effect of CYP3A4*22 carriership, which makes a further differentiation unnecessary.
Up to now, the only suggested clinically relevant polymorphisms in CYP3A enzymes relevant for kidney transplantation are CYP3A5*3 and CYP3A5*6 for tacrolimus, which are primarily found in Africans and have low allelic frequencies in the Caucasian population. CYP3A5*6 was left out of this analysis because of too low allele frequency (<6%). CYP3A4*22 is able to predict CYP3A4 activity; however, the clinical relevancy seems to be limited. The search for a reliable and clinically relevant predictive biomarker for CYP3A4 is still open, although CYP3A4 phenotyping shows more promising results as recently published by de Jonge et al.14
The demographic covariates that were identified in this study have been reported in previous studies.10,19,36,37 The clinical relevancy of the different identified covariates is limited since the explained variability by the individual covariates did not exceed 12%. The effect of prednisolone dose on cyclosporine and tacrolimus bioavailability (high dose, lower bioavailability) can be explained by CYP3A induction in the intestine and has been reported before.10,37,38 The cutoff values were chosen based on literature10,37,38 and highest objective function drop. The PK parameter estimates of the three models were in agreement with those found in previous studies,19,36,39 when taking the effect of differences in fixed bioavailability terms, patient population, and TDM assays into account. In contrast to a number of other studies, we fixed the bioavailability term to 0.5 for cyclosporine and 0.23 for tacrolimus instead of 1, which leads to an apparent clearance twice lower for cyclosporine and 4.3 times lower for tacrolimus. The variability in PK was high in tacrolimus, although as known from literature,1 around 20% of this could be explained by the fact that the majority of the data used in the current analysis were collected within 2 weeks after transplantation. Unstable renal transplant patients show much higher variability in PK.1
Cyclosporine absorption was best described with a transit compartment as we previously described.37 As found in our smaller study, ideal BW significantly correlates with Vc/F of everolimus.19 Since everolimus is primarily partitioned into red blood cells and 75% of the plasma fraction is bound to plasma proteins, this relationship can be physiologically explained since length and sex are incorporated in the ideal weight formula.2,40 The significant effect of hematocrit on everolimus clearance in the univariate covariate analysis could also be explained by the same mechanism. Ethnicity could not be identified as a covariate on clearance of everolimus or cyclosporine as was found previously by Kovarik et al.41 and Hesselink et al.36 This difference could be explained by the lack of black patients in our cohort. Although theoretically plausible, we did not find an effect of concomitant medication such as statins, calcium antagonists, sulfamethoxazole/trimethoprim, or proton pump inhibitors on CL/F. This is in accordance with what has previously been described in literature.8,41 Comedications known to have a potent effect on the PK of the drugs were avoided for safety reasons.42 The remaining variability in clearance between patients of our final model was 22.6% for cyclosporine, 28.8% for everolimus, and 38.9% for tacrolimus, which could reflect the wide interindividual variability in CYP3A4 expression.43
Our study has some limitations: fatty food intake, nonadherence, or diarrhea could not be quantified, although these factors could contribute to the observed variability since previously published studies reported food interactions with the investigated drugs.8,9,44 Furthermore, Ka of everolimus was difficult to estimate since the data set had low number of blood samples collected between 0 and 1 h after dose intake, but is unlikely that this would have influenced the genotype covariate analysis on clearance.
In conclusion, CYP3A4*22 does not influence cyclosporine, everolimus, or tacrolimus PK to a clinically relevant extent. This study confirmed that CYP3A5*3 is only suitable as a predictive marker for tacrolimus clearance, but close TDM remains essential due to the remaining variability between patients with the same genotype. The CYP3A4 and CYP3A5 combined genotypes do not further improve the predictive performance compared with the predictive performance of the polymorphisms alone. Therefore, the newly discovered CYP3A4*22 or CYP3A combined genotypes are not indicative to be used for dose adjustments in clinical practice to further improve immunosuppressive therapy of cyclosporine, tacrolimus, or everolimus in the investigated patient population.
Methods
Cyclosporine.
Clinical data from 298 renal transplant recipients treated with a immunosuppressive regimen cyclosporine (Neoral, Novartis, Basel, Switzerland), prednisolone, and mycophenolate sodium participating in a run in phase of a prospective, open, randomized, multicenter study were studied up to 6 months after transplantation.42 Induction therapy consisted of two doses of 20 mg basiliximab (Simulect Novartis, Basel, Switzerland) before transplantation and on day 4, rapidly tapered prednisolone dose (50 mg twice daily (b.i.d.) intravenously tapered to daily 10 mg oral prednisolone). Cyclosporine therapy was started at an oral dose of 4 mg/kg b.i.d. and was supported by routine TDM based on AUC0–12 h. TDM was aimed at a target of 5,400 μg·h/l the first 6 weeks and 3,250 μg·h/l thereafter. Cyclosporine concentrations were obtained at steady state at clinical visits, which were scheduled at 1, 5, 12, and 24 weeks after transplantation.
Everolimus.
Clinical data from 97 stable renal transplant recipients treated with immunosuppressive duotherapy consisting of everolimus (Certican, Novartis) and prednisolone, participating in a prospective, open, randomized, multicenter study were studied from 6 to 24 months after transplantation.42 During the first 6 months, patients were treated with an immunosuppressive regimen cyclosporine, prednisolone, and mycophenolate; thereafter, a scheduled biopsy was performed. Patients whose biopsy showed no sign of rejection were included. Subsequently, cyclosporine and mycophenolate were discontinued. Everolimus therapy was started at an oral dose of 3 mg b.i.d. and was supported by routine TDM based on AUC0–12 h. TDM was aimed at a target of 120 μg·h/l. Everolimus concentrations were obtained at steady state at regular clinical visits scheduled at 32, 52, 78, and 104 weeks after transplantation.
Tacrolimus.
Clinical data from 101 renal transplant patients on an immunosuppressive regimen of tacrolimus (Prograft, Astellas, Leiden, The Netherlands), prednisolone, and mycophenolate mofetil were studied for first two TDM moments after transplantation. Induction therapy consisted of two doses of 20 mg basiliximab (Simulect) before transplantation and, on day 4, rapidly tapered prednisolone dose (50 mg b.i.d. intravenously tapered to daily 10 mg oral prednisolone). Tacrolimus therapy was started at a fixed oral dose of 5 mg b.i.d. and was supported by routine TDM based on AUC0–12 h. TDM was aimed at a target of 160 μg·h/l the first 6 weeks and 120 μg·h/l thereafter. Tacrolimus concentrations were obtained at steady state from 1 to 66 weeks after transplantation with a median of 2 weeks.
The study was approved by the Medical Ethics Committee of Leiden University Medical Center, and patients gave written informed consent.
Bioanalytics.
TDM was performed on the basis of Bayesian estimation (cyclosporine45 and tacrolimus46) or trapezoidal rule (everolimus) (blood concentration at t = 0, 1, 2, 3, 4, 5, and 6 h (everolimus and tacrolimus) up to 12 h for some patients (cyclosporine) or t = 0, 1, 2, 3, 4 h (in a small number of visits in the everolimus data set)) using MW/Pharm 3.5 (Mediware, Groningen, The Netherlands).47 TDM samples were determined in whole blood by a validated liquid chromatography-mass spectrometric method in two laboratories24,48 or by FPIA (Abbott Laboratories, Abbott Park, IL). Tacrolimus blood concentrations were all determined with liquid chromatography–mass spectrometry/tandem mass spectrometry, everolimus with liquid chromatography–mass spectrometry/tandem mass spectrometry and FPIA, and cyclosporine with FPIA alone. Table 1 shows the samples distribution of the blood concentrations used in this study.
Genotyping assays.
DNA was isolated from blood from ethylene diamine tetraacetic acid blood collection tubes collected from patients. CYP3A4*22 was determined with TaqMan 7500 (Applied Biosystems, Nieuwerkerk a.d. IJssel, The Netherlands) with predesigned assays, according to the manufacturers' protocol. CYP3A5*3 was determined with Pyrosequencer 96MA (Isogen, IJsselstein, The Netherlands). Further details with regard to the genotyping protocol are provided in Supplementary Table IV. No inconsistencies were observed. All allele frequencies were in Hardy–Weinberg equilibrium.
PK modeling.
Nonlinear mixed effect modeling was used to estimate PK parameters from blood concentration–time data. NONMEM (v7.2.1, Icon Development Solutions, Ellicott City, MD) was used for modeling, using PsN toolkit 3.4.2 and Piranã version 2.8.0 (ref. 49) as modeling environment. Results were analyzed using statistical software package R (v2.15.2) and RStudio (v0.97.248; Boston, MA). First-order conditional estimation method with interaction was used throughout the analysis. Model selection was based on statistical significance, goodness of fit, and stability. Throughout the model building process, an altered model was chosen over a precursor model if the difference in the objective functions (−2 log likelihood) was >6.63 (P < 0.01, with 1 degree of freedom, assuming χ2 distribution) .
Base model.
The model was initially developed strictly PK without covariates. Since only data after oral and not after intravenous administration were available, the absolute oral bioavailability could not be determined. Therefore, the value for bioavailability was fixed. Plots of observed concentration–time data were examined. One- and two-compartmental PK models with first-order elimination were compared to find the best fit of the concentration–time data. The use of transit compartments and a lag time for drug absorption were explored. After building the base model, demographic and genetic covariates were explored.
Covariate analysis.
Diagnostic plots were constructed of the random effects of clearance, volume, Ka, and F vs. the demographic (age, BW, sex, ethnicity, length, lean BW, ideal BW, body surface area (BSA), BMI (formulas in Supplementary Table V), hematocrit, underlying disease, and comedications (also weighted residuals vs. comedication plots)) and pharmacogenetic (CYP3A4*22 and CYP3A5*3) characteristics. Polymorphisms were selected based on theoretical relationship and minimal allele frequency (>6%) to assure detection of clinically relevant effect on PK. Based on these diagnostic plots, further testing in the pharmacostatistical model was performed. Subsequently, selected covariate relationships were evaluated by forward inclusion and backward deletion procedure. A covariate effect was only maintained in the model, if the inclusion resulted in a reduction in random variability and improved model fit.
VPC with prediction correction.
Performance of candidate and final models for cyclosporine, everolimus, and tacrolimus PK models was evaluated using prediction-corrected VPCs, by simulation of 500 simulated data sets. A prediction-corrected VPC differs from a traditional VPC in that both observations and the model predictions are normalized for the typical model prediction in each bin of independent variables.50
Author Contributions
D.J.A.R.M., J.J.S., J.den H., T.van der S., J.J.H. van der H., J.S.S., F.J.B., J.W. de F., and H.-J. G. wrote the manuscript. D.J.A.R.M., J.J.S., J.den H., T.van der S., J.J.H. van der H., F.J.B., J.W. de F., and H.-J. G. designed the research. D.J.A.R.M., J.J.S., J.den H., T.van der S., F.J.B., J.W. de F., and H.-J. G. performed the research. D.J.A.R.M., J.J.S., J.den H., T.van der S., J.W. de F., and H.-J. G. analyzed the data. J.den H., T.van der S., J.S.S., and J.W. de F. contributed analytical tools.
Conflict of Interest
The authors declared no conflict of interest.
Study Highlights
Acknowledgments
A part of this study was financially supported by Novartis Pharma.
Supplementary Material
References
- Kuypers D.R., de Jonge H., Naesens M., Lerut E., Verbeke K., Vanrenterghem Y. CYP3A5 and CYP3A4 but not MDR1 single-nucleotide polymorphisms determine long-term tacrolimus disposition and drug-related nephrotoxicity in renal recipients. Clin. Pharmacol. Ther. 2007;82:711–725. doi: 10.1038/sj.clpt.6100216. [DOI] [PubMed] [Google Scholar]
- Kovarik J.M., et al. Everolimus Phase 2 Study Group Longitudinal assessment of everolimus in de novo renal transplant recipients over the first post-transplant year: pharmacokinetics, exposure-response relationships, and influence on cyclosporine. Clin. Pharmacol. Ther. 2001;69:48–56. doi: 10.1067/mcp.2001.112969. [DOI] [PubMed] [Google Scholar]
- Morse G.D., Holdsworth M.T., Venuto R.C., Gerbasi J., Walshe J.J. Pharmacokinetics and clinical tolerance of intravenous and oral cyclosporine in the immediate postoperative period. Clin. Pharmacol. Ther. 1988;44:654–664. doi: 10.1038/clpt.1988.208. [DOI] [PubMed] [Google Scholar]
- Kirchner G.I., Meier-Wiedenbach I., Manns M.P. Clinical pharmacokinetics of everolimus. Clin. Pharmacokinet. 2004;43:83–95. doi: 10.2165/00003088-200443020-00002. [DOI] [PubMed] [Google Scholar]
- Jacobsen W., Serkova N., Hausen B., Morris R.E., Benet L.Z., Christians U. Comparison of the in vitro metabolism of the macrolide immunosuppressants sirolimus and RAD. Transplant. Proc. 2001;33:514–515. doi: 10.1016/s0041-1345(00)02116-3. [DOI] [PubMed] [Google Scholar]
- Dai Y., et al. Effect of CYP3A5 polymorphism on tacrolimus metabolic clearance in vitro. Drug Metab. Dispos. 2006;34:836–847. doi: 10.1124/dmd.105.008680. [DOI] [PubMed] [Google Scholar]
- Lown K.S., et al. Role of intestinal P-glycoprotein (mdr1) in interpatient variation in the oral bioavailability of cyclosporine. Clin. Pharmacol. Ther. 1997;62:248–260. doi: 10.1016/S0009-9236(97)90027-8. [DOI] [PubMed] [Google Scholar]
- Christians U., Jacobsen W., Benet L.Z., Lampen A. Mechanisms of clinically relevant drug interactions associated with tacrolimus. Clin. Pharmacokinet. 2002;41:813–851. doi: 10.2165/00003088-200241110-00003. [DOI] [PubMed] [Google Scholar]
- Knops N., Levtchenko E., van den Heuvel B., Kuypers D. From gut to kidney: transporting and metabolizing calcineurin-inhibitors in solid organ transplantation. Int. J. Pharm. 2013;452:14–35. doi: 10.1016/j.ijpharm.2013.05.033. [DOI] [PubMed] [Google Scholar]
- Press R.R., et al. Explaining variability in tacrolimus pharmacokinetics to optimize early exposure in adult kidney transplant recipients. Ther. Drug Monit. 2009;31:187–197. doi: 10.1097/FTD.0b013e31819c3d6d. [DOI] [PubMed] [Google Scholar]
- Santoro A.B., Struchiner C.J., Felipe C.R., Tedesco-Silva H., Medina-Pestana J.O., Suarez-Kurtz G. CYP3A5 genotype, but not CYP3A4*1b, CYP3A4*22, or hematocrit, predicts tacrolimus dose requirements in Brazilian renal transplant patients. Clin. Pharmacol. Ther. 2013;94:201–202. doi: 10.1038/clpt.2013.68. [DOI] [PubMed] [Google Scholar]
- Zhao W., et al. Population pharmacokinetics and pharmacogenetics of tacrolimus in de novo pediatric kidney transplant recipients. Clin. Pharmacol. Ther. 2009;86:609–618. doi: 10.1038/clpt.2009.210. [DOI] [PubMed] [Google Scholar]
- Thervet E., et al. Optimization of initial tacrolimus dose using pharmacogenetic testing. Clin. Pharmacol. Ther. 2010;87:721–726. doi: 10.1038/clpt.2010.17. [DOI] [PubMed] [Google Scholar]
- de Jonge H., de Loor H., Verbeke K., Vanrenterghem Y., Kuypers D.R. In vivo CYP3A4 activity, CYP3A5 genotype, and hematocrit predict tacrolimus dose requirements and clearance in renal transplant patients. Clin. Pharmacol. Ther. 2012;92:366–375. doi: 10.1038/clpt.2012.109. [DOI] [PubMed] [Google Scholar]
- Elens L., et al. A new functional CYP3A4 intron 6 polymorphism significantly affects tacrolimus pharmacokinetics in kidney transplant recipients. Clin. Chem. 2011;57:1574–1583. doi: 10.1373/clinchem.2011.165613. [DOI] [PubMed] [Google Scholar]
- Gijsen V.M., et al. CYP3A4*22 and CYP3A combined genotypes both correlate with tacrolimus disposition in pediatric heart transplant recipients. Pharmacogenomics. 2013;14:1027–1036. doi: 10.2217/pgs.13.80. [DOI] [PubMed] [Google Scholar]
- Elens L., Bouamar R., Hesselink D.A., Haufroid V., van Gelder T., van Schaik R.H. The new CYP3A4 intron 6 C>T polymorphism (CYP3A4*22) is associated with an increased risk of delayed graft function and worse renal function in cyclosporine-treated kidney transplant patients. Pharmacogenet. Genomics. 2012;22:373–380. doi: 10.1097/FPC.0b013e328351f3c1. [DOI] [PubMed] [Google Scholar]
- Fanta S., et al. Pharmacogenetics of cyclosporine in children suggests an age-dependent influence of ABCB1 polymorphisms. Pharmacogenet. Genomics. 2008;18:77–90. doi: 10.1097/FPC.0b013e3282f3ef72. [DOI] [PubMed] [Google Scholar]
- Moes D.J., Press R.R., den Hartigh J., van der Straaten T., de Fijter J.W., Guchelaar H.J. Population pharmacokinetics and pharmacogenetics of everolimus in renal transplant patients. Clin. Pharmacokinet. 2012;51:467–480. doi: 10.2165/11599710-000000000-00000. [DOI] [PubMed] [Google Scholar]
- Yates C.R., et al. The effect of CYP3A5 and MDR1 polymorphic expression on cyclosporine oral disposition in renal transplant patients. J. Clin. Pharmacol. 2003;43:555–564. [PubMed] [Google Scholar]
- van Schaik R.H., van der Heiden I.P.,, van den Anker J.N., Lindemans J. CYP3A5 variant allele frequencies in Dutch Caucasians. Clin. Chem. 2002;48:1668–1671. [PubMed] [Google Scholar]
- Kuypers D.R., Claes K., Evenepoel P., Maes B., Vanrenterghem Y. Long-term pharmacokinetic study of the novel combination of tacrolimus and sirolimus in de novo renal allograft recipients. Ther. Drug Monit. 2003;25:447–451. doi: 10.1097/00007691-200308000-00005. [DOI] [PubMed] [Google Scholar]
- Ahn J.E., Birnbaum A.K., Brundage R.C. Inherent correlation between dose and clearance in therapeutic drug monitoring settings: possible misinterpretation in population pharmacokinetic analyses. J. Pharmacokinet. Pharmacodyn. 2005;32:703–718. doi: 10.1007/s10928-005-0083-6. [DOI] [PubMed] [Google Scholar]
- Moes D.J., Press R.R., de Fijter J.W., Guchelaar H.J., den Hartigh J. Liquid chromatography-tandem mass spectrometry outperforms fluorescence polarization immunoassay in monitoring everolimus therapy in renal transplantation. Ther. Drug Monit. 2010;32:413–419. doi: 10.1097/FTD.0b013e3181e5c656. [DOI] [PubMed] [Google Scholar]
- Bergstrand M., Hooker A.C., Wallin J.E., Karlsson M.O.Prediction corrected visual predictive checks. < http://www.go-acop.org/acop2009/posters {ACOP.} = 2009 >. [DOI] [PMC free article] [PubMed]
- Murray B., Hawes E., Lee R.A., Watson R., Roederer M.W. Genes and beans: pharmacogenomics of renal transplant. Pharmacogenomics. 2013;14:783–798. doi: 10.2217/pgs.13.68. [DOI] [PubMed] [Google Scholar]
- Kovarik J.M., Kalbag J., Figueiredo J., Rouilly M., Frazier O.L., Rordorf C. Differential influence of two cyclosporine formulations on everolimus pharmacokinetics: a clinically relevant pharmacokinetic interaction. J. Clin. Pharmacol. 2002;42:95–99. doi: 10.1177/0091270002042001011. [DOI] [PubMed] [Google Scholar]
- Lemahieu W.P., Maes B.D., Verbeke K., Vanrenterghem Y. CYP3A4 and P-glycoprotein activity in healthy controls and transplant patients on cyclosporin vs. tacrolimus vs. sirolimus. Am. J. Transplant. 2004;4:1514–1522. doi: 10.1111/j.1600-6143.2004.00539.x. [DOI] [PubMed] [Google Scholar]
- Staatz C.E., Goodman L.K., Tett S.E. Effect of CYP3A and ABCB1 single nucleotide polymorphisms on the pharmacokinetics and pharmacodynamics of calcineurin inhibitors: part I. Clin. Pharmacokinet. 2010;49:141–175. doi: 10.2165/11317350-000000000-00000. [DOI] [PubMed] [Google Scholar]
- Kang D., Schwartz J.B., Verotta D. Sample size computations for PK/PD population models. J. Pharmacokinet. Pharmacodyn. 2005;32:685–701. doi: 10.1007/s10928-005-0078-3. [DOI] [PubMed] [Google Scholar]
- Bertrand J., Comets E., Laffont C.M., Chenel M., Mentré F. Pharmacogenetics and population pharmacokinetics: impact of the design on three tests using the SAEM algorithm. J. Pharmacokinet. Pharmacodyn. 2009;36:317–339. doi: 10.1007/s10928-009-9124-x. [DOI] [PMC free article] [PubMed] [Google Scholar]
- Elens L., et al. Impact of CYP3A4*22 allele on tacrolimus pharmacokinetics in early period after renal transplantation: toward updated genotype-based dosage guidelines. Ther. Drug Monit. 2013;35:608–616. doi: 10.1097/FTD.0b013e318296045b. [DOI] [PubMed] [Google Scholar]
- van Duijnhoven E.M., Boots J.M., Christiaans M.H., Stolk L.M., Undre N.A., van Hooff J.P. Increase in tacrolimus trough levels after steroid withdrawal. Transpl. Int. 2003;16:721–725. doi: 10.1007/s00147-003-0615-1. [DOI] [PubMed] [Google Scholar]
- Kniepeiss D., et al. The role of CYP3A5 genotypes in dose requirements of tacrolimus and everolimus after heart transplantation. Clin. Transplant. 2011;25:146–150. doi: 10.1111/j.1399-0012.2009.01198.x. [DOI] [PubMed] [Google Scholar]
- Picard N., Rouguieg-Malki K., Kamar N., Rostaing L., Marquet P. CYP3A5 genotype does not influence everolimus in vitro metabolism and clinical pharmacokinetics in renal transplant recipients. Transplantation. 2011;91:652–656. doi: 10.1097/TP.0b013e31820ae4ac. [DOI] [PMC free article] [PubMed] [Google Scholar]
- Hesselink D.A., et al. Population pharmacokinetics of cyclosporine in kidney and heart transplant recipients and the influence of ethnicity and genetic polymorphisms in the MDR-1, CYP3A4, and CYP3A5 genes. Clin. Pharmacol. Ther. 2004;76:545–556. doi: 10.1016/j.clpt.2004.08.022. [DOI] [PubMed] [Google Scholar]
- Press R.R., et al. Explaining variability in ciclosporin exposure in adult kidney transplant recipients. Eur. J. Clin. Pharmacol. 2010;66:579–590. doi: 10.1007/s00228-010-0810-9. [DOI] [PMC free article] [PubMed] [Google Scholar]
- Antignac M., Barrou B., Farinotti R., Lechat P., Urien S. Population pharmacokinetics and bioavailability of tacrolimus in kidney transplant patients. Br. J. Clin. Pharmacol. 2007;64:750–757. doi: 10.1111/j.1365-2125.2007.02895.x. [DOI] [PMC free article] [PubMed] [Google Scholar]
- Benkali K., et al. Population pharmacokinetics and Bayesian estimation of tacrolimus exposure in renal transplant recipients on a new once-daily formulation. Clin. Pharmacokinet. 2010;49:683–692. doi: 10.2165/11535950-000000000-00000. [DOI] [PubMed] [Google Scholar]
- Bonate P.L. Pharmacokinetic-Pharmacodynamic Modeling and Simulation. Springer Science and Business Media, New York, 2006.
- Kovarik J.M., Hsu C.H., McMahon L., Berthier S., Rordorf C. Population pharmacokinetics of everolimus in de novo renal transplant patients: impact of ethnicity and comedications. Clin. Pharmacol. Ther. 2001;70:247–254. doi: 10.1067/mcp.2001.118022. [DOI] [PubMed] [Google Scholar]
- Bemelman F.J., et al. Minimization of maintenance immunosuppression early after renal transplantation: an interim analysis. Transplantation. 2009;88:421–428. doi: 10.1097/TP.0b013e3181af1df6. [DOI] [PubMed] [Google Scholar]
- Finnström N., Ask B., Dahl M.L., Gadd M., Rane A. Intra-individual variation and sex differences in gene expression of cytochromes P450 in circulating leukocytes. Pharmacogenomics J. 2002;2:111–116. doi: 10.1038/sj.tpj.6500086. [DOI] [PubMed] [Google Scholar]
- Kovarik J.M., et al. Effect of food on everolimus absorption: quantification in healthy subjects and a confirmatory screening in patients with renal transplants. Pharmacotherapy. 2002;22:154–159. doi: 10.1592/phco.22.3.154.33542. [DOI] [PubMed] [Google Scholar]
- Cremers S.C., et al. A compartmental pharmacokinetic model of cyclosporin and its predictive performance after Bayesian estimation in kidney and simultaneous pancreas-kidney transplant recipients. Nephrol. Dial. Transplant. 2003;18:1201–1208. doi: 10.1093/ndt/gfg065. [DOI] [PubMed] [Google Scholar]
- Scholten E.M., et al. AUC-guided dosing of tacrolimus prevents progressive systemic overexposure in renal transplant recipients. Kidney Int. 2005;67:2440–2447. doi: 10.1111/j.1523-1755.2005.00352.x. [DOI] [PubMed] [Google Scholar]
- Proost J.H., Meijer D.K. MW/Pharm, an integrated software package for drug dosage regimen calculation and therapeutic drug monitoring. Comput. Biol. Med. 1992;22:155–163. doi: 10.1016/0010-4825(92)90011-b. [DOI] [PubMed] [Google Scholar]
- Koster R.A., Dijkers E.C., Uges D.R. Robust, high-throughput LC-MS/MS method for therapeutic drug monitoring of cyclosporine, tacrolimus, everolimus, and sirolimus in whole blood. Ther. Drug Monit. 2009;31:116–125. doi: 10.1097/FTD.0b013e318192304c. [DOI] [PubMed] [Google Scholar]
- Keizer R.J., van Benten M., Beijnen J.H., Schellens J.H., Huitema A.D. Piraña and PCluster: a modeling environment and cluster infrastructure for NONMEM. Comput. Methods Programs Biomed. 2011;101:72–79. doi: 10.1016/j.cmpb.2010.04.018. [DOI] [PubMed] [Google Scholar]
- Karlsson M.O., Holford N. A tutorial on visual predictive checks. PAGE. Abstracts of the Annual Meeting of the Population Approach Group in Europe. ISSN 1871–6032.
Associated Data
This section collects any data citations, data availability statements, or supplementary materials included in this article.


