

Abstract
The default network of the human brain has drawn much attention due to its relevance to various brain disorders, cognition, and behavior. However, its functional components and boundaries have not been precisely defined. There is no consensus as to whether the precuneus, a hub in the functional connectome, acts as part of the default network. This discrepancy is more critical for brain development and aging studies: it is not clear whether age has a stronger impact on the default network or precuneus, or both. We used Generalized Ranking and Averaging Independent Component Analysis by Reproducibility (gRAICAR) to investigate the lifespan trajectories of intrinsic functional networks. By estimating individual-specific spatial components and aligning them across subjects, gRAICAR measures the spatial variation of component maps across a population without constraining the same components to appear in every subject. In a cross-lifespan fMRI dataset (N=126, 7-85 years old), we observed stronger age dependence in the spatial pattern of a precuneus-dorsal posterior cingulate cortex network compared to the default network, despite the fact that the two networks exhibit considerable spatial overlap and temporal correlation. These results remained even when analyses were restricted to a subpopulation with very similar head motion across age. Our analyses further showed that the two networks tend to merge with increasing age. Post-hoc analyses of functional connectivity confirmed the distinguishable cross-lifespan trajectories between the two networks. Based on these observations, we proposed a dynamic model of cross-lifespan functional segregation and integration between the two networks, suggesting that the precuneus network may have a different functional role than the default network, which declines with age. These findings have implications for understanding the functional roles of the default network, gaining insight into its dynamics throughout life, and guiding interpretation of alterations in brain disorders.
Keywords: default network, precuneus, independent component analysis, lifespan trajectory, functional connectome, gRAICAR
INTRODUCTION
The default network, or default mode network (DMN), has emerged as an important signature for characterizing human brain function (Bullmore and Sporns, 2012; Raichle et al., 2001; Raichle and Snyder, 2007) especially during unconstrained mental activity (Andrews-Hanna et al., 2010). It is controlled by genetic factors (Glahn et al., 2010) and targeted by various neurodegenerative and psychiatric diseases (Broyd et al., 2009; Zhang and Raichle, 2010). The posterior cingulate cortex (PCC) has been proposed as a hub region connecting subsystems in the DMN (Andrews-Hanna et al., 2010; Buckner et al., 2008). The PCC shows extensive anatomical projections to an adjacent structure, the precuneus (PCU). Together with the retrosplenial cortex, these two regions form a structural and functional hub in the brain connectome (Fransson and Marrelec, 2008; Hagmann et al., 2008).
Due to apparent anatomical and functional proximity of the PCU and PCC, most resting-state fMRI studies consider these two regions together as a posterior element of the DMN. Nonetheless, Buckner et al. (2008) suggested that the PCU (BA 7m) may not be a part of the DMN because the medial temporal lobe regions in the DMN that strongly connect to the PCC show minimal connections to BA 7m (Cavada and Goldman-Rakic, 1989; Leichnetz, 2001). Indeed, a growing number of studies have demonstrated a potential differentiation between PCU- and PCC-based networks. ICA-based studies such as Zuo et al. (2010; Appendix C) and Stevens et al. (Stevens et al., 2009) have demonstrated the presence of differentiable networks at PCU. More fine-grained parcellations of the PCU and DMN have also been accomplished using graph-theoretical approaches (Andrews-Hanna et al., 2010), seed-based correlation analysis (Cauda et al., 2010; Margulies et al., 2009; Zhang and Li, 2012) and data-driven clustering approaches (Power et al., 2011; Yeo et al., 2011).
While the functional dissociation between the PCU and DMN is becoming clearer in healthy young populations, discrepancies regarding the roles of PCU and DMN are present in the literature on brain development (Power et al., 2010) and aging (Andrews-Hanna et al., 2007). While a large body of literature showed aging effects on overall DMN functional connectivity (Damoiseaux et al., 2008; Esposito et al., 2008; Koch et al., 2010; Mevel et al., 2013; Sala-Llonch et al., 2012), some studies demonstrated that these changes may in fact be localized as part of the DMN, especially the PCC and PCU (Schlee et al., 2012; Tomasi and Volkow, 2012; Zuo et al., 2012). Since the PCU strongly co-varies with the PCC in resting-state fMRI data and thus is frequently interpreted as a posterior component of the DMN, it is not clear whether age has stronger impact on the DMN or PCU, or both. Importantly, an 8-year follow-up PET study with measure of cerebral blood flow showed that the PCU exhibited longitudinally decreased activity with normal aging, while activity in core regions of the DMN, including the PCC and medial prefrontal cortex, remained stable (Beason-Held et al., 2009). These findings suggest that the functional activity of the DMN and PCU may have different chronological dynamics across the human lifespan. Therefore, a more thorough investigation is necessary to disentangle the lifespan trajectories of the PCU and DMN.
In this study, we conducted a systematic investigation of the lifespan dynamics of the PCU and DMN using 126 subjects (aged 7 to 85) scanned at a single site. Two major challenges in the investigation of lifespan changes of functional networks are: first, the functional boundary between the PCU and PCC is not clear-cut, so that there is no pre-defined regions of interest for a direct comparison; second, the degree of network segregation between the PCU and DMN, as well as the number of networks present in a given subject, cannot be assumed identical across the lifespan. Thus, averaging data from a group of subjects is not the proper (or at least not the best) strategy. To address these challenges, we used a network-mining tool, generalized ranking and averaging independent component analysis by reproducibility (gRAICAR) (Yang et al., 2008; Yang et al., 2012). A strength of gRAICAR is that it calculates spatial components for each subject separately and then uses an efficient network-matching algorithm to infer the correspondence of the spatial components between subjects. This feature allows gRAICAR to quantify the consistency of spatial components across a group of subjects without making any assumptions about which brain regions should connect with which others at the group level.
Applying gRAICAR to the lifespan dataset, we present the first evidence showing that the functional segregation of a PCU-dominated intrinsic connectivity network from the DMN is age-dependent. We further present complementary functional connectivity analyses to confirm and interpret this finding.
METHODS
NKI Lifespan Sample and MR Imaging
The initial release of the Nathan Kline Institute/Rockland Sample (NKI-RS) (Nooner et al., 2012) included 207 participants who all underwent multimodal brain scans, semi-structured diagnostic psychiatric interviews, and a battery of psychiatric assessments (http://fcon_1000.projects.nitrc.org/indi/pro/nki.html). In the current study, 126 right-handed subjects (age range: 7-85 years; 68 males) were selected from the NKI-RS sample after excluding subjects with diagnosed mental disorders or unusable anatomical images due to excessive head motion. For functional images, only subjects with estimated mean frame-wise displacement (meanFD, Power et al. 2012a) < 0.5 mm were used.
The data were collected according to protocols approved by the institutional review board of the Nathan Kline Institute. MRI data were acquired on a 3.0T SIEMENS Trio scanner. Each subject completed a 10-min resting state fMRI scan using an echo-planar imaging (EPI) sequence (TR/TE = 2500/30 ms, FA = 80°, FOV = 216 mm, matrix = 64 × 64, slices = 38, thickness = 3.0 mm, 260 volumes). High-resolution T1-weighted images were also acquired for each subject using the magnetization-prepared rapid gradient echo (MPRAGE) sequence (TR/TE = 2500/3.5 ms, FA = 8°, thickness = 1.0 mm, slices = 192, matrix = 256 × 256, FOV = 256 mm). fMRI and T1-weighted images were preprocessed using the Connectome Computation System (CCS: http://lfcd.psych.ac.cn/ccs.html) (Zuo et al., 2013).
T1 Image Preprocessing
Individual T1 images were first processed with a spatially adaptive non-local mean filter (Zuo and Xing, 2011) and submitted into the recon-all routine in FreeSurfer 5.1 (http://surfer.nmr.mgh.harvard.edu) to extract the brain tissues. All individual anatomical brain images were transformed into the MNI152 standard space (using FNIRT in FSL) and averaged to generate a group-specific anatomical template. To account for individual differences in geometric configuration of the brain across the lifespan, this group-specific template was used to refine the registration.
Resting-state fMRI Preprocessing
Resting-state fMRI image processing consisted of 1) discarding the first 5 EPI volumes from each scan to allow for MRI signal equilibration; 2) correcting for slice timing differences; 3) correcting for rigid head motion; 4) estimating a rigid transformation from individual functional space to the corresponding anatomical space (using FLIRT in FSL) and conducting a non-linear transformation between individual anatomical space to the group-specific anatomical template; 5) normalizing the 4D data to a global mean intensity of 10000; and 6) band-pass temporal filtering (0.01-0.1 Hz). The preprocessed data were used in subsequent individual-level ICA analyses in gRAICAR. For functional connectivity analyses, prior to the band-pass temporal filtering, the mean time series from the white matter and ventricle (estimated from FreeSurfer anatomical parcellations) were regressed out from the time series on each voxel in the data for each subject. Furthermore, to reduce the impact of head motion on functional connectivity analysis, the Friston 24-parameter model (Yan et al., 2013) was used to regress out the head motion time series estimated in step 3).
gRAICAR Network Mining Analysis
The algorithm of gRAICAR (Yang et al., 2012) was applied to the preprocessed data for the purpose of finding a one-to-one correspondence between component maps across different subjects. The rationale of the one-to-one mapping is that ICA should detect similar spatial patterns in component maps if the activity sources in the data are similar. This method measures how strong the one-to-one correspondence is, so that it helps to reveal variations of brain maps across subjects. For each subject, the data were decomposed into spatial components using MELODIC (Beckmann and Smith, 2004), and the spatial maps of the components were transformed into the MNI152 space. gRAICAR then takes the spatial components from individual subjects and matches them across all subjects to produce a set of group-level aligned components (ACs). For each AC, the spatial similarity metrics between the matched components, each from a subject, are depicted in a “maximal similarity matrix”1, reflecting how individuals or populations exhibit particular ACs. As applied here, gRAICAR can identify systematic changes in the spatial consistency of component maps across age and the nature of these changes can then be more directly probed with seed based connectivity analyses.
The specific calculation steps are demonstrated in Figure 1 and more details, including the rationale and performance evaluations for this approach have been described in Yang et al. (2012). In the following, we briefly outline this approach.
Figure 1. A graphical illustration of the gRAICAR algorithm on three exemplar subjects.

(A) The full similarity matrix (FSM) containing normalized mutual information (NMI) metrics between every possible pair of independent components (ICs) from different subjects. The purple lines separate ICs from different subjects, forming subject blocks in the FSM. ICs from different subjects are labeled using different colors. (B) The NMI metrics in the FSM are standardized into Z-scores within each row in each subject block. The resultant matrix, Zrow, is an asymmetric matrix. (C) The maximal values within each row in each subject block are identified, and all other values are set to zeros, forming a matrix Zmax. (D) Zmax is multiplied by its transpose, yielding a matrix W. In this step, the NMI values are set to zero in uni-directional correspondence cases, such as IC3 of subject 1 has the maximal similarity to IC3 among all components in subject 2, but the IC3 of subject 2 has the maximal similarity to IC2 among all from subject 1, as demonstrated in (C). The symmetric matrix W reflects only bi-directional correspondence between ICs from different subjects. Summing up the values in W along each row gives a value of popularity for each component, indicating its consistency across all subjects in terms of strength of bi-directional correspondence. The ICs from all subjects are ranked according to this popularity value. (E) The Zrow matrix in (B) is added to its own transpose to yield the matrix in (E), which contains (A) standardized NMI (SNMI), a metric reflecting the specificity of each NMI similarity value within all values within a subject block. The component with top popularity from (D), which is represented using a red line in this SNMI matrix, is used to align ICs from different subjects. (F) The local maximum in each subject block along the red line (top ranked component) is identified, as indicated by orange lines. The ICs corresponding to the local maxima are labeled at the edges of the matrix, with each color indicating a different subject. (G) The SNMI between every pair of the matched ICs is found in the cross between red and orange lines. (H) The SNMI values between the identified ICs are collected in the matrix, generating a maximal similarity matrix for the current group-level aligned component (AC). The selected ICs are then removed from the rank in (D) and the SNMI matrix in (E). The search continues from (E), until the component popularity rank is empty.
The similarities between every possible pair of spatial components across the 126 subjects were collected into a full similarity matrix (Figure 1A). Our similarity measure was normalized mutual information (NMI) (Maes et al., 1997).
The NMI values were standardized (SNMI) so that the similarity strengths could be reliably compared across different pairs of subjects and to make the results more robust against noise (Figure 1B and 1E; Yang et al., 2012).
The components were given “popularity ranks” according to a centrality measure of the subject community. The purpose of ranking the components was so that, it starts the process with components that are more likely to be found across all subjects in the population when the next step matches the most similar components across subjects. Details of this step are presented in Appendix A.
For each subject, we identified the component with the highest SNMI to the initial component – the highest ranked component in step 3 (Figure 1E and 1F). The identified components and the initial components composed an aligned component (AC). The SNMI values between these components were extracted from the full similarity matrix to generate the “maximal similarity matrix” for this AC (Figure 1G and 1H), which depicts how robust this AC can be found in each subject. These components were excluded from further searching iterations regardless of their “popularity rank”. This searching processing was then repeated with the highest remaining ranked component until all components ranked with popularity were aligned to ACs.
The spatial map of each AC was obtained by averaging the individual component maps, weighted by their mean SNMI values in the maximal similarity matrix (Figure 1H) of the given AC.
Since gRAICAR forces spatial components to be aligned to ACs, a nonparametric permutation test was conducted to estimate the confidence level of assigning a component to an AC, based on which all subjects were categorized into “significant” or “insignificant” in their contributions to the AC. Details of this step are presented in Appendix B.
Network stability across the Lifespan
To examine the variation of an AC across the lifespan, we first examined the change of the subject centrality with increasing age across all subjects using a regression model. Since there was significant correlation between head motion and age (see Figure S2A), we included the meanFD and sex of the subjects as nuisance regressors in the model. Furthermore, we grouped all 126 subjects into five age groups, including <15, 16-25, 26-45, 46-65, and >65 groups, to allow for an examination of the age-related changes of inter-subject reproducibility. The corresponding sample size for each group is: 20, 35, 28, 25, and 18. For a given age group, the within-group maximal similarity matrix was extracted from the original maximal similarity matrix for the AC by including all SNMI values between every pair of subjects within this age range. The mean of all the SNMI values within this group-wise maximal similarity matrix led to a precise measure of within-group reproducibility for the AC. We also computed the Ratio of Significant Subjects (RSS) within each age group. The change of this value across the five age groups reflected the trend in fractions of subjects who possess the given network. The above two measures were used to examine the lifespan changes for each AC derived by gRAICAR, motivating and providing targets for further trajectory examination of the functional connectome architecture across the lifespan.
Post-hoc analyses
Once gRAICAR identified networks with significant age effects, several post-hoc analyses were performed. A direct comparison of components exhibiting different lifespan trajectories was conducted to infer their cross-lifespan interaction. The robustness of the findings was further examined using subject-specific ICA analyses with varying numbers of components. To further confirm and interpret the findings from ICA, voxel-based correlation comparisons were performed to test whether the age effects remained in the relationships between regional time series. Details for each of these analyses are described with the results.
RESULTS
In this report we refer to the ICA components in our gRAICAR analyses as “intrinsic connectivity networks” – sometimes shortened to “networks”. Intrinsic connectivity networks are defined as spatially distributed network of regions exhibiting a moderate to high degree of temporally correlated spontaneous (intrinsic) fluctuations (Kelly et al., 2012, Box 1). ICA decomposes the brain into spatial maps (components) whose constituent regions share common temporal fluctuations. While we limit our use of the term “network” to spatial components largely distributed within the gray matter to avoid the confusion of calling a noise component (e.g., white matter or cerebrospinal fluid) as a functional network, we recognize the limitation of the terminology. The intrinsic connectivity networks estimated from gRAICAR aren’t required to contain distinct spatial locations. To address this limitation, we further conducted a series of post-hoc analyses to verify the observation of spatially distinct “networks” by quantifying their temporal correlations.
gRAICAR Uncovers Lifespan Dynamics of the Functional Connectome and Differentiates the PCU and DMN
gRAICAR detected five ACs that were reliably found in nearly all of the subjects (i.e., RSS > 97%) and 13 ACs with a RSS between 10% and 80%, amongst which 12 demonstrated brain regions that were distributed across gray matter (Figure S1). Amongst these 12 ACs, we found two spatially overlapping networks that differed with respect to age dependence. One network was the DMN, and the other was composed of the PCU and the dorsal PCC (referred as PCU-dPCC network). A comparison between the DMN and the PCU-dPCC network is presented in Figure 2. With a threshold of |Z| > 2 (i.e., the weighted average Z score of individual spatial maps) and cluster size > 540 mm3, a cluster in the ventral PCU (vPCU) was detected in both networks. Beyond this cluster, the PCU-dPCC network (Figure 2A) encompassed two additional clusters: the dorsal PCU (dPCU) and the dPCC; the DMN (Figure 2B) was found to contain four clusters: the ventral PCC, the ventral medial prefrontal cortex, and the left and right inferior parietal cortex. These seven clusters are labeled in Figure 2C. The inter-subject maximal similarity matrix for each network (left-bottom panels in Figure 2A, B) depicts cross-subject consistency by showing similarity measures between every pair of individual component maps for the corresponding network.
Figure 2. Different lifespan dynamics in the PCU-dPCC network and the DMN revealed by gRAICAR.
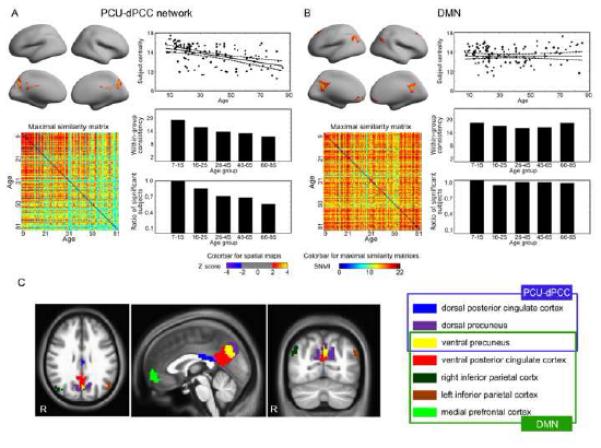
(A) The PCU-dPCC network dominated by the dorsal and ventral precuneus and the dorsal posterior cingulate cortex; (B) the DMN consisting of the ventral posterior cingulate cortex, ventral precuneus, left and right inferior parietal cortex, and medial prefrontal cortex. In both (A) and (B), the group level spatial maps representing the intrinsic connectivity networks are shown on the top-left corners. The maps are thresholded at |Z| > 2 (i.e., the weighted average score from the Z scores of the individual spatial maps). The reproducibility matrices depicting the inter-subject consistency are shown on the bottom-left corners, where the subjects represented in both horizontal and vertical axes are sorted according to age. While the PCU-dPCC network shows decreasing consistency with age, the DMN does not show such a tendency. The subject centrality metrics are plotted against age (top-right), where the horizontal axis indicates age. Compared to the PCU-dPCC network, the DMN shows a stable subject centrality with increasing age. The lifespan is then divided into five age groups. The within age-group mean similarity plots are shown in the right-middle panels, and the within age-group ratios of significant subjects (RSS) are shown in the bottom-right corners in (A) and (B). These two metrics reflect age-dependency in the PCU-dPCC network, but not in the DMN. (C) The locations of the clusters defined in the DMN and in the PCU-dPCC network are rendered and color-coded. The clusters are identified using a thresholded at |Z| > 2 and cluster size > 540 mm3. The two networks overlap at the ventral precuneus (the yellow region). The right panel of (C) summarizes the memberships of these clusters.
We found that the PCU-dPCC network (Figure 2A) demonstrated age-related decreases in subject centrality: the regression coefficient of age was beta = −0.480 (p < 10−5, adjusted R2 = 0.234), indicating that the confidence or ability of identifying a component resembling the PCU-dPCC network diminishes with age. This tendency was also clearly reflected by the within-group mean similarity (Spearman’s correlation coefficient with age = −1.000, p = 0.017) and the within-group RSS (Chi-square = 10.680, p = 0.030). Specifically, all subjects under 15 years old have the PCU-dPCC network and more than 80% of the subjects between 16 and 25 years old showed a significant match to the PCU-dPCC network. The RSS was reduced to approximately 60% in subjects between 26 and 65 years old. In subjects of 66-85 years old, the RSS fell to 50%. In contrast, we found that the AC representing the DMN (Figure 2B) was highly consistent in all of the age groups, as reflected by all three of the following metrics: the correlation coefficient between subject centrality and age was beta = 0.001 (p = 0.990, adjusted R2 = −0.010), the Spearman’s correlation coefficient between the within-group mean similarity and age was −0.300 (p=0.683), and the Chi-square statistic for the within-group RSS was 5.750 (p = 0.220). These findings suggest that the PCU-dPCC network is strongly age-dependent, while the DMN is relatively stable across the lifespan.
Lifespan Trajectory Analysis Shows the Segregation of the DMN and PCU-dPCC Networks is Age-dependent
A follow-up question is why the PCU-dPCC network becomes unlikely to be identified with increasing age. It is furthermore unclear what happens to the functional roles of the dPCC and dPCU with aging. We hypothesize that the functional role of the PCU-dPCC network integrates with that of the DMN as age increases, so that they tend to behave like a single functional network. To examine this hypothesis, we performed a voxel-wise lifespan trajectory analysis of the DMN based on constituent individual spatial maps of the associated components. With gRAICAR, we identified the components representing the DMN from each subject, the spatial maps (voxel-wise Z-scores) of which were then fitted using linear regression against age, sex, and meanFD. The resultant regression coefficient map was thresholded voxel-wise with p < 0.01 and by cluster sizes > 20 voxel (540 mm3), giving an overall significance at p < 0.05 (multiple comparison corrected).
As shown in Figure 3, we detected two clusters that respectively overlapped with the dPCC and PCU regions in the PCU-dPCC network (Figure 3A-B). Both clusters exhibited significant positive linear relationships with age. For the first cluster that overlapped with the dPCC in the PCU-dPCC network, age had a positive regression coefficient with the mean Z-scores (beta = 0.4338, p < 10−5, adjusted R2 = 0.182, see Figure 3C). The positive effect of age was also significant in the second cluster that overlapped with the PCU (beta = 0.285, p = 0.001; adjusted R2 = 0.074), but the effect size was smaller. These observations indicate that the contribution of these voxels to the DMN becomes stronger with increasing age. The fact that they overlapped with the PCU-dPCC network explains why a component representing the PCU-dPCC network becomes more and more unlikely to be separated from the component representing the DMN with increasing age, and further suggests that the functional role of the PCU-dPCC network, especially the dPCC, tends to approximate that of the DMN with aging.
Figure 3. Clusters showing age effects across individual-subject DMN spatial maps.
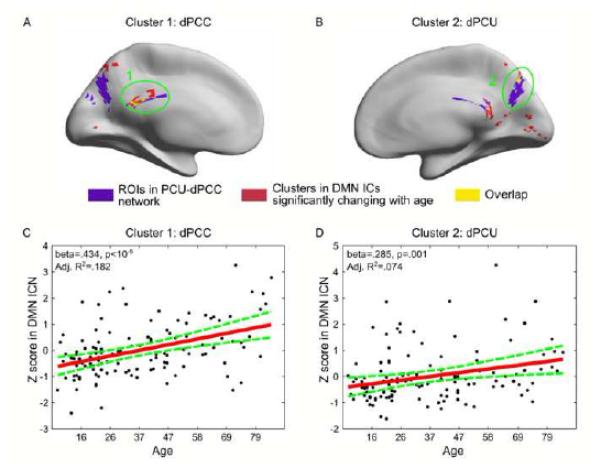
In panels A-B, red color renders clusters whose contribution to the DMN spatial map exhibit significantly positive correlation with age. Regions in purple represent the PCU and dPCC clusters identified in the PCU-dPCC network. Yellow color indicates the overlap between the red clusters and purple regions. Clusters overlap with the PCU-dPCC regions are circled and labeled. Panels C and D plot the linear fittings between the mean Z scores in these two clusters and age.
The Segregation of the DMN and PCU-dPCC Networks Diminishes with Aging and is Robust to Component Numbers in ICA
We employed a template-matching analysis to more directly evaluate the age-dependent segregation between the DMN and PCU-dPCC networks, and to verify the robustness of their separation in ICA. A key issue of ICA-based approaches to fMRI data is that different choices for the number of components may lead to different degrees of merging or splitting amongst components. To verify that the PCU-dPCC network and the DMN are robustly separable into different networks, we examined whether various settings of the number of components could affect the results.
Using MELODIC, we performed multiple runs of ICA analysis on each subject by varying the number of components from 20 to 100 in intervals of 5 (i.e., 17 choices of number of components). We first applied gRAICAR only to 11 subjects aged 30-40 with the number of components set to 60, which is the value closest to the mean of the automatically estimated number of components from MELODIC (58.3 ± 5.1). From the resultant gRAICAR ACs, we manually identified those representing the DMN and the PCU-dPCC networks and used their spatial maps as reference maps. Next, we computed the correlation coefficients between the reference maps and the spatial maps of all sets of independent components obtained with different choices of number of components. Within each set of components, we identified the components with the maximal correlation coefficient to the DMN and the PCU-dPCC reference maps. If the same component was identified for both reference maps, it was assigned to the reference map with stronger correlation, and the second best-matching component was assigned to the other reference map. This search procedure was conducted for each subject and each choice of the number of components.
The maximal correlation coefficients associated with the identified components are presented in Figure 4 in two matrices, one for the DMN and the other for the PCU-dPCC network. The rows of the matrices denote different choices for the number of components, and the columns represent different subjects ranked by their ages. The maximal correlation coefficients associated with the DMN were consistently high (ranging from 0.3 to 0.5, p<10−5 for 0.3) across both the lifespan and different settings of number of components (Figure 4A). In contrast, the maximal correlation coefficients found in the PCU-dPCC network exhibited relatively high consistency primarily for subjects under 46 years old, which was preserved as long as the number of components was larger than 30. For older subjects, the maximal correlation coefficients were not consistent across subjects, and such an inconsistency was not influenced by varying the number of components (Figure 4B). Therefore, these findings demonstrate a robust difference in the lifespan dynamics between the PCU-dPCC and the DMN across a wide choices of number of components, indicating that the separation of the two networks is not likely a result of over-splitting due to inaccurate estimation of the number of components. More importantly, by showing results from individual subjects, these findings support the age-dependent segregation between the DMN and PCU-dPCC networks, as proposed above.
Figure 4. Maximal correlation coefficients between individual ICs and reference spatial templates.
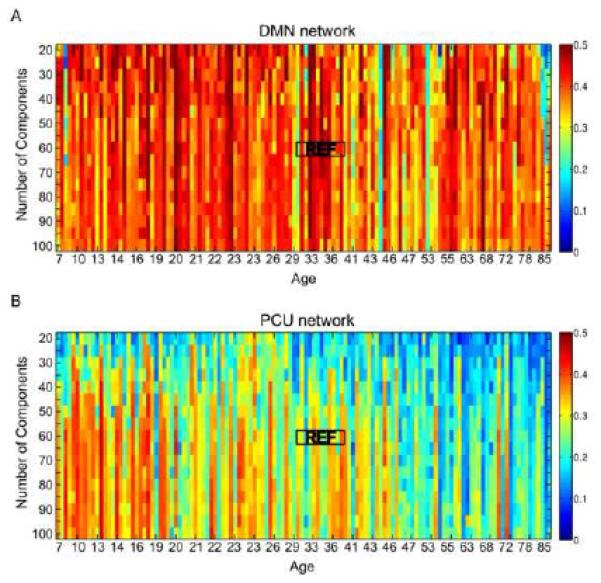
(A) Maximal correlation coefficients for the DMN network; (B) maximal correlation coefficients for the PCU-dPCC network. The horizontal axes represent individual subjects sorted by ascending age, and the vertical axes indicate different choices for the number of components in the individual ICA. The reference spatial templates are defined by applying gRAICAR to 11 subjects between 30 and 40 years old with the number of components set to 60 for the individual subject ICA. The black rectangles around ‘REF’ indicate the subjects used to generate the gRAICAR reference template. The maximal correlation coefficients for the DMN network are consistent across all subjects and across different settings for the number of components, while those for the PCU-dPCC network showed a decreasing trend with age. This tendency is preserved with different choices of number of components when they are larger than 30.
In summary, using gRAICAR and two post-hoc analyses on individual ICA results, we found that a PCU-dPCC network can be separated from the DMN in resting-state fMRI data, and that the segregation of the two networks decreases with age. Some studies reported decreased DMN activity with aging. In light of the discrepancies in current aging and brain development literatures concerning whether the PCU ought be considered as a component of the DMN, our findings suggest the possibility that the PCU-dPCC network exhibits a stronger age-dependence, while the DMN is relatively stable across the lifespan. We conducted post-hoc functional connectivity analyses, aiming to further examine this suggestion and interpret the findings from ICA.
Voxel-wise Functional Connectivity Validates the Segregation between the DMN and PCU-dPCC networks
We used functional connectivity, measured using Pearson’s correlation coefficient, to verify the lifespan-dynamic separation of the two networks. For each subject, the time series from each voxel within the clusters shown in Figure 2C were extracted to construct a functional connectivity matrix, characterizing both intra- and inter-network functional connectivity (i.e., intraNFC and interNFC). The correlation coefficients in the matrices were converted into Fisher’s Z values. To demonstrate the structure of the functional connectivity matrices, we show a matrix that was obtained by averaging the functional connectivity matrices from individual subjects (Figure 5). For each subject, the interNFC between the PCU-dPCC and the DMN networks was calculated by averaging the Fisher’s Z values in the upper-right corners of the functional connectivity matrix (Figure 5). The intraNFC for the PCU-dPCC network was computed by averaging the Fisher’s Z values located in the intersection of the PCU and dPCC clusters in the matrix; the intraNFC for the DMN network was computed by averaging across all of the intersections between the ventral PCC, ventral medial frontal cortex, and the bilateral inferior parietal cortex clusters (Figure 5). The interNFC between the DMN and the PCU-dPCC networks was highly significant (mean Fisher’s Z value = 0.15, r = 0.14, p < 10−5), suggesting that the two networks strongly co-vary when measured using correlation coefficients. More statistical results are described in Inline Supplementary Text 1.
Figure 5. Voxel-wise functional connectivity matrices depicting intra-network functional connectivity and inter-network functional connectivity.
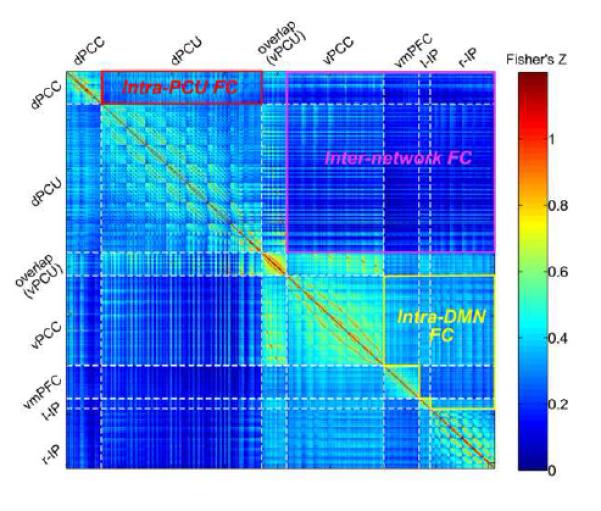
The colors in the matrix indicate Fisher’s Z-scores for correlation coefficients. Since the Z scores are all positive here, the negative range is not shown here. Each row or column in the matrices represents a voxel (total voxels = 811). The white dashed lines segment voxels from different clusters. Abbreviations in the cluster labels are: dPCU, dorsal precuneus; vPCU, ventral precuneus; vPCC, ventral posterior cingulate cortex; dPCC, dorsal posterior cingulate cortex; vmPFC, ventral medial prefrontal cortex; l-IP, left inferior parietal cortex; and r-IP, right inferior parietal cortex. The partitions representing the interNFC, the intraNFC of PCU-dPCC network, and the intraNFC of DMN are highlighted with labels and solid lines.
We examined the segregation of the two networks by comparing their lifespan-related changes in intraNFC. The intraNFC of the DMN and PCU-dPCC networks were regressed against age. The meanFD and sex of the subjects were included as nuisance regressors in the model. In addition to the above model, we further ruled out the impact from within-cluster local homogeneity (correlations across voxels in the same cluster) on the long-distance functional connectivity by dividing the intraNFC by the mean of the Fisher’s Z scores located within the intra-cluster partitions of the matrices. The resultant measures were denoted as the relative intraNFC; age-effect fitting was repeated with these measures with the same covariates included. The interNFC between the two networks were also examined as above.
We found that the intraNFC of the PCU-dPCC network showed a significant negative linear relationship with age (beta = −0.417, p < 10−5, see Figure 6A), and the linear model explained a significant part of variance of the PCU-dPCC intraNFC (adjusted R2 = 0.159, F = 8.880, p = 0.0002). The linear age effect on the intraNFC of the DMN was less significant (beta=−0.227, p=0.026, see Figure 6C), and the linear model was marginally significant (adjusted R2 = 0.038, F = 2.645, p = 0.052). The intraNFC of the DMN and the PCU-dPCC network was directly compared using a linear regression model that predicts age based on intraNFC of DMN, intraNFC of PCU-dPCC, and their interactions. Results showed that the intraNFC of PCU-dPCC had a significantly more negative correlation with age when compared to the intraNFC of DMN (t = −2.366, p = 0.020).
Figure 6. Linear cross-lifespan trajectories of intra-network functional connectivity in the DMN and PCU-dPCC networks.
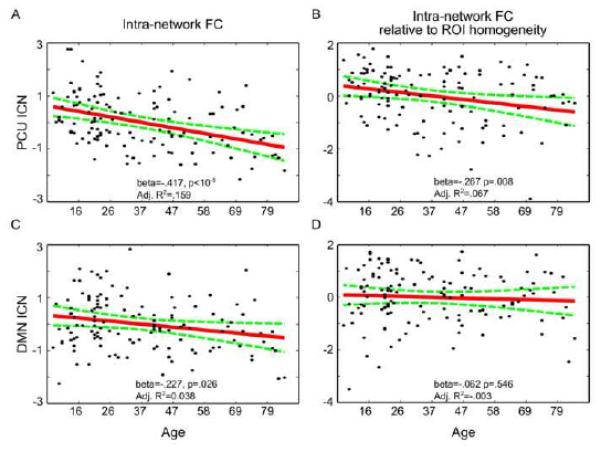
The black dots represent functional connectivity measured from individual subjects. The red lines indicate linear fitting of age effects, taking into account the nuisance effects from head micromovements (meanFD) and sex. The green dashed curves indicate the 95% confidence interval of the fitted line. The significance of the beta values and goodness of fitting statistics are marked at the bottom of the plots. The plots for the PCU-dPCC network are shown in the top row (A, B), and the bottom row shows the plots for the DMN (C, D). Panels (A) and (C) show the intraNFC, and panels (B) and (D) show the relative intraNFC. The values are first converted to Fisher’s Z values and further standardized into Z scores (mean=0, standard deviation=1) for easier comparisons. For both dependent variables (intraNFC and relative intraNFC), the PCU-dPCC network shows a stronger negative relationship with age compared with the DMN.
The relative intraNFC of the PCU-dPCC network again showed a significant negative linear relationship with age (beta = −0.267, p = 0.008, Figure 5B), and the linear model was significant (adjusted R2 = 0.067, F = 3.987, p = 0.010). In contrast, the age effect on the relative intraNFC for DMN was not significant (beta = −0.062, p = 0.546, Figure 5D), and the linear model was not significant (adjusted R2 = −0.003, F = 0.873, p = 0.457). A direct comparison showed that the difference between the relative intraNFC between PCU-dPCC and DMN was marginally significant (t = −1.8260, p = 0.070). Neither the interNFC nor the relative interNFC was significantly correlated with age (p > 0.1).
Taken together, our functional connectivity analyses suggest that the DMN and the PCU-dPCC network have different functional characteristics across the lifespan, despite their spatial overlap and temporal correlation. While the functional connectivity pattern of the DMN is stable across the lifespan, the functional connectivity of the PCU-dPCC network appears to significantly diminish with age. These observations verify the findings from gRAICAR in terms of temporal correlation between the regions in the networks.
DISCUSSION
This study provides insight regarding the dynamics of the brain’s intrinsic functional architecture across the lifespan. Using a data-mining approach based on higher-order statistics and post-hoc validation analyses, we found an age-related weakening of a functional network consisting of the PCU and the dPCC. This network exhibits both spatial overlap and temporal correlations in spontaneous fluctuations of BOLD signals with another frequently reported resting-state network, the DMN. However, the spatial pattern of the DMN remains stable over the lifespan. Further investigation showed the segregation of the two networks decreases with age, suggesting their functional integration with aging. The cross-lifespan functional segregation between the two networks was further supported by subsequent functional connectivity analyses. Therefore, our results provide the first evidence showing the segregation of the PCU and DMN is age-linked, suggesting that these brain networks are functionally distinct and exhibit separable dynamics across the lifespan. The interpretation of these observations and a possible inter-network dynamic model are discussed below.
gRAICAR detected 12 aligned components, representing spatial patterns of intrinsic connectivity networks. We ran the age linear regression on all of these networks. A correction for multiple component comparisons would require a p < 0.05/12. All of our presented statistical effects are still significant with this correction. For all post-hoc analyses, we are essentially calculating two statistics (one for the PCU-dPCC and one for the DMN). All the statistical findings showing significant age-dependence of the PCU-dPCC network are robust enough to survive after a correction for two comparisons (p < 0.05/2).
The Complexity of Lifespan Brain Function: Methodological Advantages of gRAICAR
Working as a complex network at multiple temporal and spatial scales (Bullmore and Sporns, 2009, 2012), the human brain exhibits structural changes across the lifespan (Hogstrom et al., 2012; Ziegler et al., 2012), implying corresponding changes in function. However, comprehensive investigations of human brain function across the lifespan are challenging due to considerable individual variability in both brain structure and function. Importantly, functional networks in the brain are mutually related. Correlated networks with distinct functions could be grouped into a single large network by correlation-based analyses. ICA offers one powerful tool for disentangling overlapping/correlated intrinsic connectivity networks. Here, we applied a fully data-driven ICA-based method (gRAICAR) that addresses these problems. gRAICAR provides a data-mining tool that facilitates the discovery of subgroups and the existence of heterogeneous subject communities with two advantages: 1) Individual ICA decomposes functional data into spatial components showing different temporal dynamics without a priori assumption on which brain regions form an intrinsic connectivity network. This approach helps to reveal spatial patterns of highly coherent networks; and 2) gRAICAR does not assume that all of the subjects share the same set of components, making it possible to detect components that are consistent or inconsistent across subjects. These advantages make it suitable for generating specific hypotheses to be further tested.
A recent study argued that the algorithms for ICA decomposition that are most effective for fMRI data actually derive effectively sparse components, rather than independent components (Daubechies et al., 2009). This argument suggests that the spatial components from ICA are not necessarily independent and that the sparsity of the component is more influential to the decomposition (Daubechies et al., 2009). They demonstrated that the FastICA algorithms used in MELODIC could capture, with considerable accuracy, fine-grained spatial variability in intrinsic connectivity networks. Thus, if correct, this argument does not invalidate the application of ICA to fMRI data; instead, it suggests the utility of ICA even when assumptions regarding the spatial independence of component sources are not strictly met. Importantly, the extent to which ICA selects for maximal sparsity vs. independence in fMRI is still a source of ongoing debate (Calhoun et al., 2013), and merits continued attention in future research.
A Default and Relatively Stable Network Pattern across the Lifespan
gRAICAR detected a relatively stable overall pattern of the DMN over the lifespan. This network has been demonstrated to be consistently present in humans (Fox et al., 2005; Greicius et al., 2003), monkeys (Hutchison et al., 2011; Mantini et al., 2011; Vincent et al., 2007) and rats (Upadhyay et al., 2011). Such a robust cross-species presence of the DMN suggests that it could have a role in supporting fundamental brain function and may orchestrate various universal properties of the brain connectome observed across multiple species.
Several previous studies have reported age-related functional connectivity changes in the DMN (Damoiseaux et al., 2008; Mevel et al., 2013; Sambataro et al., 2010; Schlee et al., 2012). Our results do not conflict with these reports, since there is no clear definition of the functional anatomy of the DMN to-date, and many aging studies consider the PCU and PCC as a single component in the DMN. Our gRAICAR results showed that the PCU component has considerable overlap with the PCC region in the DMN component (Figure 2C), and our functional connectivity analysis showed significant correlation between the PCU-dPCC and DMN networks (Figure 5). Given these observations, it is potential that the different functional roles of the PCU and PCC were mixed up, especially when a large degree of spatial smoothing was applied. In the present work, a relevant observation is that we observed distinct lifespan trajectories of the intraNFC of PCU-dPCC and DMN, but failed to detect significant age effect on the interNFC between the networks. These results, however, do not conflict with the observations from literature on ICA and intraNFC. It is possible that only the functional connectivity between the PCU and dPCC (intraNFC) decreases with age, so that the PCU-dPCC network becomes less likely to be separated in ICA. However, when calculating the interNFC (which, here, collapsed across relationships between all voxels in each network), the age effect on intraNFC may have been cancelled out by the high correlation between other regions that do not have a clear age effect. Thus, the age effect may only be observed when separating the networks to investigate the intraNFC. These results also echo the power of this exploratory method, since without properly separating the two networks. A seed-based correlation analysis may have overlooked the potential lifespan changes.
Lifespan Dynamics of the Precuneus
Compared to the DMN, the PCU-dPCC network varies dynamically across the human lifespan. The PCU belongs to the multimodal association cortex, with connections to various unimodal and sensory modal cortices, and thus potentially serves as a core area for facilitating neuronal communication with rich behavioral correlates (Cavanna and Trimble, 2006; van den Heuvel et al., 2012). Recent studies have clearly separated the PCU from DMN in resting-state fMRI data in young populations (Power et al., 2011; Stevens et al., 2009; Yeo et al., 2011; Zuo et al., 2010). Our results replicate these findings using a different approach.
We found that the robustness of this network was greatly reduced during aging, echoing its age-related reductions in both structural (Fjell et al., 2012; Kochunov et al., 2011) and functional features (Biswal et al., 2010; Filippini et al., 2012; Rodrigue et al., 2012; Tomasi and Volkow, 2012; Zuo et al., 2012). These observations may reflect the neural correlates of age-related decline in high-order cognitive functions, including visuo-spatial imagery and episodic memory retrieval (Greenwood et al., 1993; Park et al., 2013), which have been associated with this functional component (Cavanna and Trimble, 2006; Margulies et al., 2009; Zhang and Li, 2012).
Our investigation of the lifespan dynamics of DMN spatial maps provides some insight into how the PCU-dPCC network functionally re-organizes while it appears to weaken over the lifespan. The observation that the regions identified in the PCU-dPCC network, especially the dPCC, exhibited an age-related increasing contribution to the DMN suggests that the PCU and dPCC become increasingly functionally integrated into the DMN with age. Our interpretation of this observation is that part of the dPCC function characterized by the PCU-dPCC network diminishes with age, becoming functionally closer to the DMN. Recent studies on the functions of the PCC have lent support to this hypothesis: converging evidence has shown that the PCC serves multiple roles (Pearson et al., 2011), and Leech et al. (2011) found that the dPCC is not only integrated in the DMN but is also functionally connected to distributed networks associated with behavior control, proposing that the dPCC is actively involved in managing externally directed attention. This basic cognitive component is required by the higher-order functions facilitated by the precuneus, such as attention shifting, memory retrieval, and spatial coordination. More importantly, degeneration of these functions is frequently observed with normal aging (Lithfous et al., 2013). In addition, the functional degeneration of the precuneus is also frequently reported (Biswal et al., 2010; Filippini et al., 2012; Rodrigue et al., 2012; Tomasi and Volkow, 2012; Zuo et al., 2012), echoing our observation that a region in dPCU functionally merges into the DMN.
Therefore, our observations suggest a dynamic model between the DMN and the PCU-dPCC network: the PCU may have a particular functional role that is related to but separable from the DMN in youth, as demonstrated by Yeo et al. (2011) and Power et al. (2011), and this functional role diminishes with increasing age. The “posterior cingulate cortex-precuneus” structure that has been frequently considered a functionally homogenous “hub” within the DMN (Fransson and Marrelec, 2008) may, in fact, have multiple functional roles that exhibit different lifespan dynamics due to structural and functional reorganization of the aging brain. A supporting evidence was provided by Damoiseaux et al. (2008), who showed an separation between a “posterior” and an “anterior” DMN using tensorial ICA (Beckmann and Smith, 2005). The “posterior” DMN mainly covered PCU, while the “anterior” DMN mainly covered PCC, ventral medial prefrontal cortex, and bilateral inferior parietal cortex. Both components showed difference between young and aged subjects.
Many behavioral and cognitive functions have been attributed to the “posterior cingulate cortex-precuneus” structure, such as self-related cognition (Whitfield-Gabrieli et al., 2011), awareness (Philippi et al., 2012), spatial cognition (Dean and Platt, 2006), learning and memory (Maddock et al., 2001), mind-wandering (Mason et al., 2008), evaluative functions (Hayden et al., 2008), and change-detection (Pearson et al., 2011). With normal aging, some of these cognitive functions (e.g., spatial cognition and memory) exhibit significant impairment (Craik and Salthouse, 1992), while others remain stable (Mevel et al., 2013). Our dynamic model of the DMN and PCU-dPCC networks helps to explain these phenomena.s
Impacts of Head Motion
It has been argued that some functional connectivity findings are biased due to subject head motion (Power et al., 2012a, b). This issue is even more critical in lifespan studies, since the degree of head motion is correlated with age. Indeed, we observed a strong positive correlation between age and meanFD (r = 0.49, p < 10−5, see Figure S2A). To address this issue, we have made the following efforts to reduce or control for the impact of head motion. First, we excluded all subjects with excessive head motion (max displacement > 2mm, max rotation > 2 degree or meanFD > 0.5). Second, we employed the Friston 24-parameter model to reduce the effect of head motion on voxel-wise time series. This model has been demonstrated to be more effective in removing head motion effects (Yan et al., 2013), at the cost of hurting the statistical power in functional connectivity analyses. Third, we repeated gRAICAR analysis and functional connectivity analyses on a motion-matched subset of subjects with meanFD between 0.071 and 0.158 (n = 68). The correlation between age and meanFD in this subset was not significant (r = 0.203, p = 0.100, see Figure S2B), and there was no significant main effect of age on the meanFD when we categorized the subjects into five age groups as before (F = 2.040, p = 0.073). We were able to replicate both the gRAICAR and the functional connectivity results we observed in the original dataset (see Figure S3-4), although the effect size was reduced with smaller sample size. Therefore, we argue that even though head motion is strongly correlated with age in the dataset, our results do not seem to be caused by head motion, at least linearly. The non-linear effect of head motion remains to be further explored, preferably using a large sample of longitudinal data acquired across the lifespan design (Nooner et al., 2012).
It also worth noting that our meanFD exclusion and matching of subjects does not necessarily solve the problem that different groups may have qualitatively different patterns of movement. Since the movement patterns are not represented in a meaningful measure, they may be left unaccounted for in quantifying motion-related group differences.
Limitations and Future Directions
Several limitations should be acknowledged while interpreting our results. First, although we demonstrated lifespan consistency of the overall spatial pattern for the DMN, our results should not be interpreted as solid evidence supporting lifespan stability all network connections within the DMN. Instead, our results highlight an intrinsic PCU-dPCC network that is functionally related to the DMN and yet more variable than the DMN over the lifespan. This is because gRAICAR only examines the inter-subject consistency of the global spatial patterns of individual networks and is not designed to detect small changes in functional connectivity strength with age between pairs of brain regions.
Second, the sample sizes of different age groups are not equal in this dataset, with more subjects in young adulthood compared to children and aged subjects. This may have biased our results, especially in terms of the lifespan stability of the DMN. Accordingly, we have discussed this issue above, and this is not the main point of this work. Our comparisons between the DMN and PCU-dPCC networks should be less affected by this issue since the impact should be cancelled out, although more investigation is need to clarify the impact of this issue to comparisons between intrinsic connectivity networks.
Lastly, the cortical atrophy makes spatial normalization difficult for older subjects, and can potentially decrease the signal to noise ratio of the data. This factor could explain some variability in resting-state fMRI data across the lifespan. Therefore, further investigations are needed to confirm the current findings.
CONCLUSIONS
Using data-driven and post-hoc hypothesis-driven analyses of resting state fMRI data, we propose a model of the relationship between the DMN and PCU-dPCC networks across the human lifespan. Specifically, the dPCC and vPCU are functionally connected in a PCU-dPCC network that shows functional characteristics and lifespan dynamics that differ from those of the DMN. With increasing age, the function of the dPCC tends to be more integrated into the DMN. Our proposed model can be more thoroughly examined in future studies.
Supplementary Material
HIGHLIGHTS.
A precuneus intrinsic connectivity network is separated from the default network.
The precuneus network overlaps and temporally correlated with the default network.
The precuneus-dominated network pattern diminishes with aging.
The default network pattern is relatively stable across the lifespan.
The precuneus network converges with the default network with aging.
ACKNOWLEDGEMENTS
The authors would like to thank Dr. Gang Chen for help in statistical tests. This work was supported by National Key Technologies R&D Program of China (No. 2012BAI36B01) and Natural Science Foundation of China (81270023, 81171409, 81220108014). XNZ acknowledges support from the Key Research Program and the Hundred Talents Program of the Chinese Academy of Sciences (KSZD-EW-TZ-002). CC is supported by the Intramural Research Program of the National Institute of Neurological Disorders and Stroke, National Institutes of Health. DH and PAB are supported by the Intramural Research Program of the National Institute of Mental Health, National Institutes of Health. MPM is supported by NIMH BRAINS R01MH094639-01 and gifts from Joseph P. Healey and the Stavros Niarchos Foundation to the Child Mind Institute.
APPENDIX A: Computation of the “popularity rank” in gRAICAR
The previously published gRAICAR algorithm defined the initial components for the searching process as the two components showing global maximal SNMI values in the full similarity matrix (Yang et al., 2012). To enhance the robustness against spuriously high SNMI values, the current version’s “popularity rank” considers the similarities across all subjects. The procedure is demonstrated in Figure 1A-D. In each row of each subject block of the full similarity matrix, we converted the NMI values into Z scores (mean = 0, standard deviation = 1, Fig. 1B). The matrix in Figure 1B is not symmetric. The local maximum in each row of each subject block was then identified, and other values were set to zero (Figure 1C). Each row in the matrix represents a component, and the local maxima on each row indicate how well the component represented in the current row matches to a component from every other subject. By multiplying the transpose of this matrix to itself (Figure 1D), we eliminated the cases such as where component 1 from subject 1 has the maximal similarity to component 2 among all components in subject 2, but component 2 in subject 2 has the maximal similarity to component 3 among all from subject 1. While unidirectional relationships are considered weak for the popularity ranking, but these components may still align with each other in step 4. Summing up the values across each row, we obtained a popularity value for each component, indicating its consistency across all subjects in terms of strength of bi-directional correspondence.
APPENDIX B: Permutation tests to estimate the confidence level of assigning a component to an AC
One component was first randomly chosen from each subject to form a null-AC and the SNMI values between each pair of components in the null-AC were used to form a null-consistency matrix. Within the null-consistency matrix, the maximal SNMI metric in each row was collected. Since each row represents a subject, this value indicates the maximum SNMI a subject can get, if a random component from this subject were aligned to the components from other subjects. The procedure was repeated 1000 times to estimate the distribution of the maximal possible SNMI measures for each subject. This distribution was used to assign a probability that each subject’s component within each aligned component was within the null-distribution of the maximal SNMI. The 50th percentile of the null-distribution indicates a statistical expectation of the maximal SNMI a given subject can attain, and it was therefore used as a threshold of significant subject mean SNMI (subject centrality in a weighted graph). A supra-threshold subject mean SNMI indicated that the current alignment achieved the best expectations of inter-subject consistency. All subjects were then categorized as “significant” or “insignificant” based upon their contributions to the AC.
Footnotes
Publisher's Disclaimer: This is a PDF file of an unedited manuscript that has been accepted for publication. As a service to our customers we are providing this early version of the manuscript. The manuscript will undergo copyediting, typesetting, and review of the resulting proof before it is published in its final citable form. Please note that during the production process errors may be discovered which could affect the content, and all legal disclaimers that apply to the journal pertain.
The “maximal similarity matrix” was called “reproducibility matrix” in Yang et al., 2012.
REFERENCES
- Andrews-Hanna JR, Reidler JS, Sepulcre J, Poulin R, Buckner RL. Functional-anatomic fractionation of the brain's default network. Neuron. 2010;65:550–562. doi: 10.1016/j.neuron.2010.02.005. [DOI] [PMC free article] [PubMed] [Google Scholar]
- Andrews-Hanna JR, Snyder AZ, Vincent JL, Lustig C, Head D, Raichle ME, Buckner RL. Disruption of large-scale brain systems in advanced aging. Neuron. 2007;56:924–935. doi: 10.1016/j.neuron.2007.10.038. [DOI] [PMC free article] [PubMed] [Google Scholar]
- Beason-Held LL, Kraut MA, Resnick SM. Stability of default-mode network activity in the aging brain. Brain Imaging and Behavior. 2009;3:123–131. doi: 10.1007/s11682-008-9054-z. [DOI] [PMC free article] [PubMed] [Google Scholar]
- Beckmann CF, Smith SM. Probabilistic independent component analysis for functional magnetic resonance imaging. IEEE Trans Med Imaging. 2004;23:137–152. doi: 10.1109/TMI.2003.822821. [DOI] [PubMed] [Google Scholar]
- Beckmann CF, Smith SM. Tensorial extensions of independent component analysis for multisubject FMRI analysis. NeuroImage. 2005;25:294–311. doi: 10.1016/j.neuroimage.2004.10.043. [DOI] [PubMed] [Google Scholar]
- Biswal BB, Mennes M, Zuo XN, Gohel S, Kelly C, Smith SM, Beckmann CF, Adelstein JS, Buckner RL, Colcombe S, Dogonowski AM, Ernst M, Fair D, Hampson M, Hoptman MJ, Hyde JS, Kiviniemi VJ, Kotter R, Li SJ, Lin CP, Lowe MJ, Mackay C, Madden DJ, Madsen KH, Margulies DS, Mayberg HS, McMahon K, Monk CS, Mostofsky SH, Nagel BJ, Pekar JJ, Peltier SJ, Petersen SE, Riedl V, Rombouts SA, Rypma B, Schlaggar BL, Schmidt S, Seidler RD, Siegle GJ, Sorg C, Teng GJ, Veijola J, Villringer A, Walter M, Wang L, Weng XC, Whitfield-Gabrieli S, Williamson P, Windischberger C, Zang YF, Zhang HY, Castellanos FX, Milham MP. Toward discovery science of human brain function. Proc Natl Acad Sci U S A. 2010;107:4734–4739. doi: 10.1073/pnas.0911855107. [DOI] [PMC free article] [PubMed] [Google Scholar]
- Broyd SJ, Demanuele C, Debener S, Helps SK, James CJ, Sonuga-Barke EJ. Default-mode brain dysfunction in mental disorders: a systematic review. Neurosci Biobehav Rev. 2009;33:279–296. doi: 10.1016/j.neubiorev.2008.09.002. [DOI] [PubMed] [Google Scholar]
- Buckner RL, Andrews-Hanna JR, Schacter DL. The brain's default network: anatomy, function, and relevance to disease. Ann N Y Acad Sci. 2008;1124:1–38. doi: 10.1196/annals.1440.011. [DOI] [PubMed] [Google Scholar]
- Bullmore E, Sporns O. Complex brain networks: graph theoretical analysis of structural and functional systems. Nat Rev Neurosci. 2009;10:186–198. doi: 10.1038/nrn2575. [DOI] [PubMed] [Google Scholar]
- Bullmore E, Sporns O. The economy of brain network organization. Nat Rev Neurosci. 2012;13:336–349. doi: 10.1038/nrn3214. [DOI] [PubMed] [Google Scholar]
- Calhoun VD, Potluru VK, Phlypo R, Silva RF, Pearlmutter BA, Caprihan A, Plis SM, Adali T. Independent component analysis for brain FMRI does indeed select for maximal independence. PLoS One. 2013;8:e73309. doi: 10.1371/journal.pone.0073309. [DOI] [PMC free article] [PubMed] [Google Scholar]
- Cauda F, Geminiani G, D'Agata F, Sacco K, Duca S, Bagshaw AP, Cavanna AE. Functional connectivity of the posteromedial cortex. PLoS One. 2010;5:e13107. doi: 10.1371/journal.pone.0013107. [DOI] [PMC free article] [PubMed] [Google Scholar]
- Cavada C, Goldman-Rakic PS. Posterior parietal cortex in rhesus monkey: I. Parcellation of areas based on distinctive limbic and sensory corticocortical connections. J Comp Neurol. 1989;287:393–421. doi: 10.1002/cne.902870402. [DOI] [PubMed] [Google Scholar]
- Cavanna AE, Trimble MR. The precuneus: a review of its functional anatomy and behavioural correlates. Brain. 2006;129:564–583. doi: 10.1093/brain/awl004. [DOI] [PubMed] [Google Scholar]
- Craik FIM, Salthouse TA. The handbook of aging and cognition. Lawrence Erlbaum Associates, Inc; Hillsdale, NJ, England: 1992. [Google Scholar]
- Damoiseaux JS, Beckmann CF, Arigita EJ, Barkhof F, Scheltens P, Stam CJ, Smith SM, Rombouts SA. Reduced resting-state brain activity in the "default network" in normal aging. Cereb Cortex. 2008;18:1856–1864. doi: 10.1093/cercor/bhm207. [DOI] [PubMed] [Google Scholar]
- Daubechies I, Roussos E, Takerkart S, Benharrosh M, Golden C, D'Ardenne K, Richter W, Cohen JD, Haxby J. Independent component analysis for brain fMRI does not select for independence. Proc Natl Acad Sci U S A. 2009;106:10415–10422. doi: 10.1073/pnas.0903525106. [DOI] [PMC free article] [PubMed] [Google Scholar]
- Dean HL, Platt ML. Allocentric spatial referencing of neuronal activity in macaque posterior cingulate cortex. J Neurosci. 2006;26:1117–1127. doi: 10.1523/JNEUROSCI.2497-05.2006. [DOI] [PMC free article] [PubMed] [Google Scholar]
- Esposito F, Aragri A, Pesaresi I, Cirillo S, Tedeschi G, Marciano E, Goebel R, Di Salle F. Independent component model of the default-mode brain function: combining individual-level and population-level analyses in resting-state fMRI. Magn Reson Imaging. 2008;26:905–913. doi: 10.1016/j.mri.2008.01.045. [DOI] [PubMed] [Google Scholar]
- Filippini N, Nickerson LD, Beckmann CF, Ebmeier KP, Frisoni GB, Matthews PM, Smith SM, Mackay CE. Age-related adaptations of brain function during a memory task are also present at rest. NeuroImage. 2012;59:3821–3828. doi: 10.1016/j.neuroimage.2011.11.063. [DOI] [PMC free article] [PubMed] [Google Scholar]
- Fjell AM, Walhovd KB, Brown TT, Kuperman JM, Chung Y, Hagler DJ, Jr., Venkatraman V, Roddey JC, Erhart M, McCabe C, Akshoomoff N, Amaral DG, Bloss CS, Libiger O, Darst BF, Schork NJ, Casey BJ, Chang L, Ernst TM, Gruen JR, Kaufmann WE, Kenet T, Frazier J, Murray SS, Sowell ER, van Zijl P, Mostofsky S, Jernigan TL, Dale AM, Pediatric Imaging N, Genetics S. Multimodal imaging of the self-regulating developing brain. Proc Natl Acad Sci U S A. 2012;109:19620–19625. doi: 10.1073/pnas.1208243109. [DOI] [PMC free article] [PubMed] [Google Scholar]
- Fox MD, Snyder AZ, Vincent JL, Corbetta M, Van Essen DC, Raichle ME. The human brain is intrinsically organized into dynamic, anticorrelated functional networks. Proc Natl Acad Sci U S A. 2005;102:9673–9678. doi: 10.1073/pnas.0504136102. [DOI] [PMC free article] [PubMed] [Google Scholar]
- Fransson P, Marrelec G. The precuneus/posterior cingulate cortex plays a pivotal role in the default mode network: Evidence from a partial correlation network analysis. NeuroImage. 2008;42:1178–1184. doi: 10.1016/j.neuroimage.2008.05.059. [DOI] [PubMed] [Google Scholar]
- Glahn DC, Winkler AM, Kochunov P, Almasy L, Duggirala R, Carless MA, Curran JC, Olvera RL, Laird AR, Smith SM, Beckmann CF, Fox PT, Blangero J. Genetic control over the resting brain. Proc Natl Acad Sci U S A. 2010;107:1223–1228. doi: 10.1073/pnas.0909969107. [DOI] [PMC free article] [PubMed] [Google Scholar]
- Greenwood PM, Parasuraman R, Haxby JV. Changes in visuospatial attention over the adult lifespan. Neuropsychologia. 1993;31:471–485. doi: 10.1016/0028-3932(93)90061-4. [DOI] [PubMed] [Google Scholar]
- Greicius MD, Krasnow B, Reiss AL, Menon V. Functional connectivity in the resting brain: a network analysis of the default mode hypothesis. Proc Natl Acad Sci U S A. 2003;100:253–258. doi: 10.1073/pnas.0135058100. [DOI] [PMC free article] [PubMed] [Google Scholar]
- Hagmann P, Cammoun L, Gigandet X, Meuli R, Honey CJ, Wedeen VJ, Sporns O. Mapping the structural core of human cerebral cortex. PLoS Biol. 2008;6:e159. doi: 10.1371/journal.pbio.0060159. [DOI] [PMC free article] [PubMed] [Google Scholar]
- Hayden BY, Nair AC, McCoy AN, Platt ML. Posterior cingulate cortex mediates outcome-contingent allocation of behavior. Neuron. 2008;60:19–25. doi: 10.1016/j.neuron.2008.09.012. [DOI] [PMC free article] [PubMed] [Google Scholar]
- Hogstrom LJ, Westlye LT, Walhovd KB, Fjell AM. The Structure of the Cerebral Cortex Across Adult Life: Age-Related Patterns of Surface Area, Thickness, and Gyrification. Cereb Cortex. 2012 doi: 10.1093/cercor/bhs231. [DOI] [PubMed] [Google Scholar]
- Hutchison RM, Leung LS, Mirsattari SM, Gati JS, Menon RS, Everling S. Resting-state networks in the macaque at 7 T. NeuroImage. 2011;56:1546–1555. doi: 10.1016/j.neuroimage.2011.02.063. [DOI] [PubMed] [Google Scholar]
- Kelly C, Biswal BB, Craddock RC, Castellanos FX, Milham MP. Characterizing variation in the functional connectome: promise and pitfalls. Trends Cogn Sci. 2012;16:181–188. doi: 10.1016/j.tics.2012.02.001. [DOI] [PMC free article] [PubMed] [Google Scholar]
- Koch W, Teipel S, Mueller S, Buerger K, Bokde AL, Hampel H, Coates U, Reiser M, Meindl T. Effects of aging on default mode network activity in resting state fMRI: does the method of analysis matter? NeuroImage. 2010;51:280–287. doi: 10.1016/j.neuroimage.2009.12.008. [DOI] [PubMed] [Google Scholar]
- Kochunov P, Glahn DC, Lancaster J, Thompson PM, Kochunov V, Rogers B, Fox P, Blangero J, Williamson DE. Fractional anisotropy of cerebral white matter and thickness of cortical gray matter across the lifespan. NeuroImage. 2011;58:41–49. doi: 10.1016/j.neuroimage.2011.05.050. [DOI] [PMC free article] [PubMed] [Google Scholar]
- Leech R, Kamourieh S, Beckmann CF, Sharp DJ. Fractionating the default mode network: distinct contributions of the ventral and dorsal posterior cingulate cortex to cognitive control. J Neurosci. 2011;31:3217–3224. doi: 10.1523/JNEUROSCI.5626-10.2011. [DOI] [PMC free article] [PubMed] [Google Scholar]
- Leichnetz GR. Connections of the medial posterior parietal cortex (area 7m) in the monkey. Anat Rec. 2001;263:215–236. doi: 10.1002/ar.1082. [DOI] [PubMed] [Google Scholar]
- Lithfous S, Dufour A, Despres O. Spatial navigation in normal aging and the prodromal stage of Alzheimer's disease: insights from imaging and behavioral studies. Ageing Res Rev. 2013;12:201–213. doi: 10.1016/j.arr.2012.04.007. [DOI] [PubMed] [Google Scholar]
- Maddock RJ, Garrett AS, Buonocore MH. Remembering familiar people: the posterior cingulate cortex and autobiographical memory retrieval. Neuroscience. 2001;104:667–676. doi: 10.1016/s0306-4522(01)00108-7. [DOI] [PubMed] [Google Scholar]
- Maes F, Collignon A, Vandermeulen D, Marchal G, Suetens P. Multimodality image registration by maximization of mutual information. IEEE Trans Med Imaging. 1997;16:187–198. doi: 10.1109/42.563664. [DOI] [PubMed] [Google Scholar]
- Mantini D, Gerits A, Nelissen K, Durand JB, Joly O, Simone L, Sawamura H, Wardak C, Orban GA, Buckner RL, Vanduffel W. Default mode of brain function in monkeys. J Neurosci. 2011;31:12954–12962. doi: 10.1523/JNEUROSCI.2318-11.2011. [DOI] [PMC free article] [PubMed] [Google Scholar]
- Margulies DS, Vincent JL, Kelly C, Lohmann G, Uddin LQ, Biswal BB, Villringer A, Castellanos FX, Milham MP, Petrides M. Precuneus shares intrinsic functional architecture in humans and monkeys. Proc Natl Acad Sci U S A. 2009;106:20069–20074. doi: 10.1073/pnas.0905314106. [DOI] [PMC free article] [PubMed] [Google Scholar]
- Mason RA, Williams DL, Kana RK, Minshew N, Just MA. Theory of Mind disruption and recruitment of the right hemisphere during narrative comprehension in autism. Neuropsychologia. 2008;46:269–280. doi: 10.1016/j.neuropsychologia.2007.07.018. [DOI] [PMC free article] [PubMed] [Google Scholar]
- Mevel K, Landeau B, Fouquet M, La Joie R, Villain N, Mezenge F, Perrotin A, Eustache F, Desgranges B, Chetelat G. Age effect on the default mode network, inner thoughts, and cognitive abilities. Neurobiol Aging. 2013;34:1292–1301. doi: 10.1016/j.neurobiolaging.2012.08.018. [DOI] [PubMed] [Google Scholar]
- Nooner KB, Colcombe SJ, Tobe RH, Mennes M, Benedict MM, Moreno AL, Panek LJ, Brown S, Zavitz ST, Li Q, Sikka S, Gutman D, Bangaru S, Schlachter RT, Kamiel SM, Anwar AR, Hinz CM, Kaplan MS, Rachlin AB, Adelsberg S, Cheung B, Khanuja R, Yan C, Craddock CC, Calhoun V, Courtney W, King M, Wood D, Cox CL, Kelly AM, Di Martino A, Petkova E, Reiss PT, Duan N, Thomsen D, Biswal B, Coffey B, Hoptman MJ, Javitt DC, Pomara N, Sidtis JJ, Koplewicz HS, Castellanos FX, Leventhal BL, Milham MP. The NKI-Rockland Sample: A Model for Accelerating the Pace of Discovery Science in Psychiatry. Front Neurosci. 2012 doi: 10.3389/fnins.2012.00152. [DOI] [PMC free article] [PubMed] [Google Scholar]
- Park H, Kennedy KM, Rodrigue KM, Hebrank A, Park DC. An fMRI study of episodic encoding across the lifespan: Changes in subsequent memory effects are evident by middle-age. Neuropsychologia. 2013;51:448–456. doi: 10.1016/j.neuropsychologia.2012.11.025. [DOI] [PMC free article] [PubMed] [Google Scholar]
- Pearson JM, Heilbronner SR, Barack DL, Hayden BY, Platt ML. Posterior cingulate cortex: adapting behavior to a changing world. Trends Cogn Sci. 2011;15:143–151. doi: 10.1016/j.tics.2011.02.002. [DOI] [PMC free article] [PubMed] [Google Scholar]
- Philippi CL, Feinstein JS, Khalsa SS, Damasio A, Tranel D, Landini G, Williford K, Rudrauf D. Preserved self-awareness following extensive bilateral brain damage to the insula, anterior cingulate, and medial prefrontal cortices. PLoS One. 2012;7:e38413. doi: 10.1371/journal.pone.0038413. [DOI] [PMC free article] [PubMed] [Google Scholar]
- Power JD, Barnes KA, Snyder AZ, Schlaggar BL, Petersen SE. Spurious but systematic correlations in functional connectivity MRI networks arise from subject motion. NeuroImage. 2012a;59:2142–2154. doi: 10.1016/j.neuroimage.2011.10.018. [DOI] [PMC free article] [PubMed] [Google Scholar]
- Power JD, Barnes KA, Snyder AZ, Schlaggar BL, Petersen SE. Steps toward optimizing motion artifact removal in functional connectivity MRI; a reply to Carp. NeuroImage. 2012b doi: 10.1016/j.neuroimage.2012.03.017. [DOI] [PMC free article] [PubMed] [Google Scholar]
- Power JD, Cohen AL, Nelson SM, Wig GS, Barnes KA, Church JA, Vogel AC, Laumann TO, Miezin FM, Schlaggar BL, Petersen SE. Functional network organization of the human brain. Neuron. 2011;72:665–678. doi: 10.1016/j.neuron.2011.09.006. [DOI] [PMC free article] [PubMed] [Google Scholar]
- Power JD, Fair DA, Schlaggar BL, Petersen SE. The development of human functional brain networks. Neuron. 2010;67:735–748. doi: 10.1016/j.neuron.2010.08.017. [DOI] [PMC free article] [PubMed] [Google Scholar]
- Raichle ME, MacLeod AM, Snyder AZ, Powers WJ, Gusnard DA, Shulman GL. A default mode of brain function. Proc Natl Acad Sci U S A. 2001;98:676–682. doi: 10.1073/pnas.98.2.676. [DOI] [PMC free article] [PubMed] [Google Scholar]
- Raichle ME, Snyder AZ. A default mode of brain function: a brief history of an evolving idea. NeuroImage. 2007;37:1083–1090. doi: 10.1016/j.neuroimage.2007.02.041. discussion 1097-1089. [DOI] [PubMed] [Google Scholar]
- Rodrigue KM, Daugherty AM, Haacke EM, Raz N. The Role of Hippocampal Iron Concentration and Hippocampal Volume in Age-Related Differences in Memory. Cereb Cortex. 2012 doi: 10.1093/cercor/bhs139. [DOI] [PMC free article] [PubMed] [Google Scholar]
- Sala-Llonch R, Arenaza-Urquijo EM, Valls-Pedret C, Vidal-Pineiro D, Bargallo N, Junque C, Bartres-Faz D. Dynamic functional reorganizations and relationship with working memory performance in healthy aging. Front Hum Neurosci. 2012;6:152. doi: 10.3389/fnhum.2012.00152. [DOI] [PMC free article] [PubMed] [Google Scholar]
- Sambataro F, Murty VP, Callicott JH, Tan HY, Das S, Weinberger DR, Mattay VS. Age-related alterations in default mode network: Impact on working memory performance. Neurobiol Aging. 2010;31:839–852. doi: 10.1016/j.neurobiolaging.2008.05.022. [DOI] [PMC free article] [PubMed] [Google Scholar]
- Schlee W, Leirer V, Kolassa IT, Weisz N, Elbert T. Age-related changes in neural functional connectivity and its behavioral relevance. BMC Neurosci. 2012;13:16. doi: 10.1186/1471-2202-13-16. [DOI] [PMC free article] [PubMed] [Google Scholar]
- Stevens MC, Pearlson GD, Calhoun VD. Changes in the interaction of resting-state neural networks from adolescence to adulthood. Hum Brain Mapp. 2009;30:2356–2366. doi: 10.1002/hbm.20673. [DOI] [PMC free article] [PubMed] [Google Scholar]
- Tomasi D, Volkow ND. Aging and functional brain networks. Mol Psychiatry. 2012;17(471):549–458. doi: 10.1038/mp.2011.81. [DOI] [PMC free article] [PubMed] [Google Scholar]
- Upadhyay J, Baker SJ, Chandran P, Miller L, Lee Y, Marek GJ, Sakoglu U, Chin CL, Luo F, Fox GB, Day M. Default-mode-like network activation in awake rodents. PLoS One. 2011;6:e27839. doi: 10.1371/journal.pone.0027839. [DOI] [PMC free article] [PubMed] [Google Scholar]
- van den Heuvel MP, Kahn RS, Goni J, Sporns O. High-cost, high-capacity backbone for global brain communication. Proc Natl Acad Sci U S A. 2012;109:11372–11377. doi: 10.1073/pnas.1203593109. [DOI] [PMC free article] [PubMed] [Google Scholar]
- Vincent JL, Patel GH, Fox MD, Snyder AZ, Baker JT, Van Essen DC, Zempel JM, Snyder LH, Corbetta M, Raichle ME. Intrinsic functional architecture in the anaesthetized monkey brain. Nature. 2007;447:83–86. doi: 10.1038/nature05758. [DOI] [PubMed] [Google Scholar]
- Whitfield-Gabrieli S, Moran JM, Nieto-Castanon A, Triantafyllou C, Saxe R, Gabrieli JD. Associations and dissociations between default and self-reference networks in the human brain. NeuroImage. 2011;55:225–232. doi: 10.1016/j.neuroimage.2010.11.048. [DOI] [PubMed] [Google Scholar]
- Yan CG, Cheung B, Kelly C, Colcombe S, Craddock RC, Di Martino A, Li Q, Zuo XN, Castellanos FX, Milham MP. A comprehensive assessment of regional variation in the impact of head micromovements on functional connectomics. NeuroImage. 2013;76:183–201. doi: 10.1016/j.neuroimage.2013.03.004. [DOI] [PMC free article] [PubMed] [Google Scholar]
- Yang Z, LaConte S, Weng X, Hu X. Ranking and averaging independent component analysis by reproducibility (RAICAR) Hum Brain Mapp. 2008;29:711–725. doi: 10.1002/hbm.20432. [DOI] [PMC free article] [PubMed] [Google Scholar]
- Yang Z, Zuo XN, Wang P, Li Z, LaConte SM, Bandettini PA, Hu XP. Generalized RAICAR: discover homogeneous subject (sub)groups by reproducibility of their intrinsic connectivity networks. NeuroImage. 2012;63:403–414. doi: 10.1016/j.neuroimage.2012.06.060. [DOI] [PubMed] [Google Scholar]
- Yeo BT, Krienen FM, Sepulcre J, Sabuncu MR, Lashkari D, Hollinshead M, Roffman JL, Smoller JW, Zollei L, Polimeni JR, Fischl B, Liu H, Buckner RL. The organization of the human cerebral cortex estimated by intrinsic functional connectivity. J Neurophysiol. 2011;106:1125–1165. doi: 10.1152/jn.00338.2011. [DOI] [PMC free article] [PubMed] [Google Scholar]
- Zhang D, Raichle ME. Disease and the brain's dark energy. Nat Rev Neurol. 2010;6:15–28. doi: 10.1038/nrneurol.2009.198. [DOI] [PubMed] [Google Scholar]
- Zhang S, Li CS. Functional connectivity mapping of the human precuneus by resting state fMRI. NeuroImage. 2012;59:3548–3562. doi: 10.1016/j.neuroimage.2011.11.023. [DOI] [PMC free article] [PubMed] [Google Scholar]
- Ziegler G, Dahnke R, Jancke L, Yotter RA, May A, Gaser C. Brain structural trajectories over the adult lifespan. Hum Brain Mapp. 2012;33:2377–2389. doi: 10.1002/hbm.21374. [DOI] [PMC free article] [PubMed] [Google Scholar]
- Zuo XN, Ehmke R, Mennes M, Imperati D, Castellanos FX, Sporns O, Milham MP. Network centrality in the human functional connectome. Cereb Cortex. 2012;22:1862–1875. doi: 10.1093/cercor/bhr269. [DOI] [PubMed] [Google Scholar]
- Zuo XN, Kelly C, Adelstein JS, Klein DF, Castellanos FX, Milham MP. Reliable intrinsic connectivity networks: test-retest evaluation using ICA and dual regression approach. NeuroImage. 2010;49:2163–2177. doi: 10.1016/j.neuroimage.2009.10.080. [DOI] [PMC free article] [PubMed] [Google Scholar]
- Zuo XN, Xing XX. Effects of non-local diffusion on structural MRI preprocessing and default network mapping: statistical comparisons with isotropic/anisotropic diffusion. PLoS One. 2011;6:e26703. doi: 10.1371/journal.pone.0026703. [DOI] [PMC free article] [PubMed] [Google Scholar]
- Zuo XN, Xu T, Jiang L, Yang Z, Cao XY, He Y, Zang YF, Castellanos FX, Milham MP. Toward reliable characterization of functional homogeneity in the human brain: preprocessing, scan duration, imaging resolution and computational space. NeuroImage. 2013;65:374–386. doi: 10.1016/j.neuroimage.2012.10.017. [DOI] [PMC free article] [PubMed] [Google Scholar]
Associated Data
This section collects any data citations, data availability statements, or supplementary materials included in this article.