

Abstract
Charcot–Marie–Tooth (CMT) neuropathies represent a heterogeneous group of peripheral nerve disorders affecting 1 in 2,500 persons. One variant, CMT1A, is a primary Schwann cell (SC) disorder, and represents the single most common variant. In previous studies, we showed that neurotrophin-3 (NT-3) improved the tremblerJ (TrJ) mouse and also showed efficacy in CMT1A patients. Long-term treatment with NT-3 was not possible related to its short half-life and lack of availability. This led to considerations of NT-3 gene therapy via adenoassociated virus (AAV) delivery to muscle, acting as secretory organ for widespread distribution of this neurotrophic agent. In the TrJ model of demyelinating CMT, rAAV1.NT-3 therapy resulted in measurable NT-3 secretion levels in blood sufficient to provide improvement in motor function, histopathology, and electrophysiology of peripheral nerves. Furthermore, we showed that the compound muscle action potential amplitude can be used as surrogate for functional improvement and established the therapeutic dose and a preferential muscle-specific promoter to achieve sustained NT-3 levels. These studies of intramuscular (i.m.) delivery of rAAV1.NT-3 serve as a template for future CMT1A clinical trials with a potential to extend treatment to other nerve diseases with impaired nerve regeneration.
Introduction
Charcot–Marie–Tooth disease (CMT) is a clinically and genetically heterogeneous group of sensorimotor peripheral neuropathies and represents the most frequent inherited disorder(s) affecting the nervous system.1 In this study, we provide preclinical, proof of principle data demonstrating efficacy in a mouse model of the demyelinating form of CMT (CMT1), supporting an adenoassociated virus (AAV)-mediated neurotrophin 3 (NT-3) gene therapy clinical trial. There is no treatment for this condition with onset between 5 and 25 years2,3 bilateral foot drop, symmetric atrophy of muscles below the knee, and weakness of hands. The use of ambulatory aids is common. CMT1 is the most common of all inherited neuropathies (prevalence 30/100,000), and the subtype of CMT1A with mutations of peripheral myelin protein 22 (PMP22) represents 70–80% of all CMTs. CMT1A is a primary Schwann cell (SC) disease resulting from 1.4 Mb duplication at chromosome 17p11.2 that encompasses PMP22.4,5
NT-3 is expressed by SCs and takes part in an autocrine survival loop that allows SCs to survive and differentiate without the axon and stimulates neurite outgrowth and myelination as shown in both in vivo and in vitro regeneration paradigms of central and peripheral nerves.6,7,8,9,10,11,12 We hypothesize that priming SCs with NT-3 might be beneficial to axonal regeneration and associated myelination as a crucial first step in the treatment of CMT neuropathies.13 We demonstrated the potential of NT-3 in two previous studies. These studies utilized two experimental paradigms to show that NT-3 improved nerve function: (i) a xenograft model of grafted nerve segments from patients with a PMP22 duplication of CMT1A and (ii) studies in the tremblerJ (TrJ) mouse, a naturally occurring animal model of CMT carrying a point mutation in the PMP22 gene. NT-3, given in peptide form, via subcutaneous injections significantly improved axonal regeneration and enhanced the myelination process in both models.14 Moreover, a pilot clinical trial of recombinant methionyl human NT-3 (r-metHuNT-3) given subcutaneously to CMT1A patients improved regeneration of myelinated fibers (MF) in sural nerve biopsies accompanied by clinical improvement in the Mayo Clinic Neuropathy Impairment Score.14 These studies serve as a catalyst to consider NT-3 as a therapy for CMT1A. It was the short serum half-life of NT-3 and potential need for repeated dosing to maintain uninterrupted NT-3 levels that led us to consider AAV-mediated gene delivery. NT-3 plasma half-life is only 1.28 minutes after intravenous administration making it impractical for clinical application.15 An alternative and in many ways more advantageous delivery system for NT-3 is through gene transfer using AAV1 as the vehicle for transfer. The AAV1 vector carrying the NT-3 gene can provide a continuous source of NT-3 serum levels following injection of skeletal muscle.
In this study, we chose TrJ mouse model of CMT well-characterized histopathological phenotype and abnormal SC-axon interactions leading to profound alterations in the neurofilament (NF) cytoskeleton and impaired nerve regeneration.14,16,17 Trembler nerves show severe hypomyelination, a decreased large MF population, reduced axon caliber, increased NF packing density, and NF hypophosphorylation similar to CMT1A nerves.17,18 Here, we report for the first time that in TrJ mice, rAAV1.NT-3 gene transfer into muscle tissue results in NT-3 secretion into circulation reaching therapeutic blood levels, sufficient to provide functional, histopathological, and electrophysiological improvements in peripheral nerves. Furthermore, we established the therapeutic dose and a preferential muscle-specific promoter to achieve sustained NT-3 levels following intramuscular (i.m.) delivery of AAV1.NT-3, which would then serve as a template for future clinical trials in CMT neuropathies, as well as other nerve diseases with impaired nerve regeneration.
Results
NT-3 vector construction and potency
We generated an AAV expression cassette carrying the human NT-3 cDNA (GeneBank designation NTF3, referenced in this paper as both NTF3 and NT-3) coding sequence under the control of cytomegalovirus (CMV) promoter or triple muscle-specific creatine kinase (tMCK) promoter19 and packaged it using either single-stranded (ss) or self-complementary (sc) AAV1 vectors (Figure 1). We tested the potency of the ssAAV1.CMV.NT-3 vector in C57BL/6 mice by delivering 1 × 10¹¹ vg (vector genome) to the gastrocnemius muscle by i.m. injection. Three weeks postinjection, NT-3 serum levels were easily detectable, and the levels remained elevated for at least 10 months (the final time point of the study). In preliminary studies, we had examined NT-3 serum levels in a small cohort of mice following the injection of empty capsids as controls and found no differences compared to phosphate-buffered saline (PBS)-injected control group. This then became the experimental paradigm throughout the remainder of our experimental approach. Serum levels of NT-3 in TrJ mice at 23 weeks postinjection significantly increased compared to PBS treated showing almost undetectable levels (5.11 ± 3.49 versus 0.23 ± 0.19 ng/ml; Supplementary Figure S1). We then asked whether we could reduce the required vector dose and achieve the same level of expression by packaging our expression cassette with scAAV1. We performed a dose–response study on C57BL/6 mice at different time intervals comparing serum NT-3 levels following i.m. injection of scAAV1.tMCK.NT-3 and scAAV1.CMV.NT-3 at three doses (3 × 10⁹ vg, 1 × 10¹⁰ vg and 3 × 10¹⁰ vg). Figure 2a illustrates that scAAV1.CMV.NT-3 vector at 1 × 10¹¹ vg produced significantly higher NT-3 levels than the single-stranded vector at the same dose, consistent with greater potency using self-complementary vectors.20 A half-log dose reduction (3 × 10¹⁰ vg) of both CMV and tMCK in C57/BL produced comparable NT-3 serum levels to those obtained from mice that received ssAAV1.CMV.NT-3 at 1 × 10¹¹ vg dose. Comparison of NT-3 levels from TrJ mice at 24 weeks postinjection with scAAV1.CMV.NT-3 and scAAV1.tMCK.NT-3 vector is seen in Figure 2b; at a dose of 3 × 10¹⁰ vg, both showed functional efficacy (see below).
Figure 1.
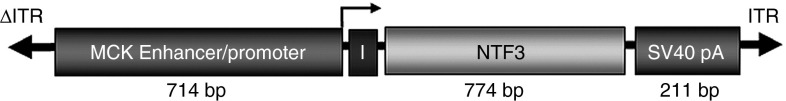
Self-complementary scAAV1.tMCK.NFT3. The schematic diagram shows the cassette for gene transfer using a tMCK enhancer/promoter, an intron to enhance gene expression (I), the full-length NTF3 cDNA, and the SV40 polyA tail.
Figure 2.

Serum NT-3 levels from phosphate-buffered saline (PBS) and AAV1.NT-3-injected mice using a capture enzyme-linked immunosorbent assay (ELISA). (a) scAAV1.CMV.NT-3 vector at 1 × 10¹¹ vg produced significantly higher NT-3 levels than the single-stranded vector at the same dose. A dose–response study in C57BL/6 mice at different time intervals comparing serum NT-3 levels following i.m. injection of scAAV1.tMCK.NT-3 and scAAV1.CMV.NT-3 at three doses (3 × 10⁹ vg, 1 × 10¹⁰ vg, and 3 × 10¹⁰ vg). At a half-log less dose (3 × 10¹⁰ vg), both CMV and tMCK vectors produced comparable NT-3 serum levels to those obtained from mice that received ssAAV1.CMV.NT-3 at 1 × 10¹¹ vg dose, which produced a biological response. Additional data show long-term expression of NT-3 using sc.AAV1.tMCK.NT-3 vector at 3 × 10¹⁰ vg upto 6 months, the last data point studied. Error bars represent standard error (n = 3 in each group). (b) The NT-3 levels (mean ± SEM) from TrJ mice at 24 weeks postinjection. There is significant difference in NT-3 levels among all 7 groups, P value < 0.0001. We found significant difference in NT-3 levels for highest and intermediate doses of vectors for both promoters and control. However, analysis failed to find significant difference for lower doses for both vectors. Kruskal–Wallis test is used to compare serum NT-3 among all groups (PBS, CMV 3E+09/1E+10/3E+10, and tMCK 3E+09/1E+10/3E+10). Mann–Whitney U-test is used to compare NT-3 between each group and PBS (control) group, and Bonferroni correction is used to adjust for multiple comparisons.
Efficacy of NT-3 gene transfer in TrJ mice peripheral nerves assessed by functional, morphological, and electrophysiological studies
Functional studies. The effect of NT-3 gene therapy on hindlimb grip strength function was assessed in the regenerating nerves from TrJ mice receiving ssAAV1.CMV.NT-3 at a dose of 1 × 10¹¹ vg following a nerve crush paradigm. In these experiments, gene transfer was carried out by needle injection to the left gastrocnemius muscle of TrJ mice at 9–12 weeks of age (n = 12) followed by left sciatic nerve crush, performed 3 weeks postinjection. Grip strength was monitored weekly. Mice were killed at 20 weeks postcrush; both sciatic nerves were removed for morphological studies, and serum was collected for NT-3 enzyme-linked immunosorbent assay (ELISA). Functional studies revealed significantly improved grip strength in limbs harboring the regenerating sciatic nerves compared to the PBS-treated TrJ at the 15-week postcrush time point (Figure 3a).
Figure 3.

Functional improvements in TrJ mice following i.m. injection of ssAAV1.CMV.NT-3 (1 × 10¹¹vg) compared to PBS control group. (a) Grip strength in the left hindlimbs harboring the regenerating sciatic nerves from NT-3 group show significant improvement compared to the PBS-treated TrJ at the 15-week postcrush time point, 18 weeks after vector injection (n = 12 in each group). In a parallel group without nerve crush, the NT-3 gene therapy group performed significantly better starting around 10 weeks in left hindlimb (b) and simultaneous bilateral hindlimb grip (c) strength measures compared to PBS controls (n = 14 in each group). (d) Rotarod performance collected between 20 and 40 weeks postinjection shows a continuous improvement in the NT-3-treated group (AAV1.NT-3 group, n = 10; PBS group, n = 9). Error bars represent standard error. Multiple t-test one per row was performed; *P < 0.05, **P < 0.001.
In a parallel group injected into the right quadriceps ssAAV1.CMV.NT-3 (1 × 10¹¹vg) compared to PBS (n = 14 per group), we correlated functional studies with sciatic nerve conduction parameters in the same limb. Left hindlimb (Figure 3b) and simultaneous bilateral hindlimb grip (Figure 3c) strength measures in TrJ mice were monitored weekly up to 20 weeks. The NT-3 gene therapy group performed significantly better starting around 10 weeks compared to PBS controls. We continued to collect functional data from these animals and recorded their rotarod performance weekly between 20 and 40 weeks postinjection. Figure 3d shows a continuous improvement in rotarod performance of the NT-3-treated group compared to the PBS controls. These data clearly show that we have a long lasting functional improvement with NT-3 in this model (last data collection is at 10 months postgene transfer). Collectively, these studies indicate that i.m. injection of the vector into one limb muscle produced a broader functional improvement.
Morphological studies. Previous studies established that TrJ mice nerves show severe hypomyelination and decreased MF density.14,17 Such findings are illustrated in Figure 4a from sciatic nerve of control TrJ receiving PBS showing severe hypomyelination compared to a wild-type control (Figure 4b). At 20 weeks postcrush, morphometric studies 4 mm distal to the crush site corroborated the functional studies showing significant increases in MF densities in both regenerating and uncrushed contralateral sciatic nerves from the ssAAV1.CMV.NT-3 injected TrJ mice compared to PBS controls (Table 1; Supplementary Figure S2a–d). MF size distribution histograms revealed an increase in the subpopulation of axons less than 4 µm in diameter in regenerating, as well as uncrushed contralateral sciatic nerves (Supplementary Figure S3a,b). This demonstrates that there is a remote effect extending to the opposite extremity from the gene transfer site. Moreover, g ratio (axon diameter/fiber diameter) determinations of the MF in the uncrushed intact sciatic nerves showed an increase in myelin thickness in the ssAAV1.CMV.NT-3-treated group (Figure 4c,d), partially improving the hypomyelination/amyelination state of the peripheral nerves, the hallmark of trembler pathology. The mean g ratio in the PBS-treated TrJ is 0.79 ± 0.004, significantly greater than that obtained from wild type (0.65 ± 0.002; P < 0.0001), reflecting the hypomyelination state in this model. In the AAV1.CMV.NT-3-injected TrJ mice, the g ratio was significantly reduced (0.75 ± 0.004; P < 0.0001), indicative of an increased myelin thickness in comparison to the PBS-treated control TrJ. As seen in the scattergram (Figure 4d), although the myelin thickness in the AAV1.CMV.NT-3 group improved across all axon diameters, this was predominantly for the small and medium diameter axons at this 20 weeks postgene injection time point.
Figure 4.

NT-3 gene therapy improves trembler nerve pathology. One micrometer thick toluidine blue-stained plastic sections from sciatic nerves of (a) TrJ and (b) wild-type mice. TrJ mice nerves show severe hypomyelination; arrows point naked axons with no myelin. (c) Sciatic nerve from TrJ mouse 20 weeks after intramuscular injection of AAV1.NT-3 shows axons with thicker myelin (arrows). (d) Scatter plot shows g ratios of individual fibers as a function of the respective axon diameter (n = 3 per group; > 150 axons/mouse). The AAV1.NT-3 improves the hypomyelination state of TrJ mice across all axon diameters but predominantly of the small and medium diameter axons. Scale bar = 5 µm for a, b, and c.
Table 1. Myelinated fiber density in TrJ sciatic nerves.

We have previously shown that exogenous NT-3 in peptide form improved SC proliferation and survival in the TrJ mouse model for CMT as well as in the sural nerves from patients with CMT1A.14 AAV1.NT-3 treatment at 20 weeks postinjection resulted in a more robust SC density increase effect in crushed as well as intact TrJ nerves. The increase in the SC number by 3,300/mm2 (19%) in the treated crushed nerves was significant (P < 0.04) compared with the untreated crushed nerves (Figure 5). The difference between the intact treated nerves and the intact untreated nerves was 3,210/mm2 (P < 0.001) corresponding to an increase of 23%.
Figure 5.

NT-3 gene therapy improves CS density in regenerating and intact/uncrushed trembler nerves. Bars represent mean total SC density ± SEM (n = 4 per group). The average Schwann cell density in the AAV1.NT-3-treated regenerating (Reg-NT-3) as well as the intact/uncrushed (Int-NT-3) sciatic nerves are significantly increased when compared with phosphate-buffered saline (PBS)-treated regenerating (Reg-PBS; P < 0.04) and AAV1.NT-3-treated intact (Int-NT-3; P < 0.001) counterparts.
Table 1 summarizes the long-term biological effect of NT-3 gene therapy on TrJ nerve pathology comparing single-stranded and self-complementary vectors, treatment duration, doses, and promoters. MF density was significantly increased at 40 weeks compared to PBS-treated controls and further increased compared to 20 weeks posttreatment. Furthermore, experiments carried out using scAAV1 vectors, with either CMV or tMCK promoters, increased MF densities at half-log doses less than single-stranded vectors. In these studies, there was a strong Spearman correlation between MF densities and NT-3 levels for all samples (P = 0.0003).
Assessment of NF cytoskeleton: Trembler axons display an increased NF packing density associated with increased hypophosphorylation state of the NFs.17,21 Ultrastructural morphometric studies assessing NF cytoskeleton at 20 weeks post-ssAAV1.CMV.NT-3 injection showed a decrease in NF packing density toward normalization. Figure 6a shows distribution histograms of the number of NF per a unit hexagonal area from wild type, NT-3-treated TrJ and PBS-treated TrJ nerves. AAV1.NT-3 treatment resulted in a shift to left toward normalcy, which is reflected in the representative cross sectional areas from mid-sciatic nerves (Figure 6b). Western blot analyses complement the ultrastructural findings (Figure 6c). In response to AAV1.NT-3 gene therapy, the phosphorylated NF H subunit (NF-H) is significantly increased in the trembler peripheral nerves compared to the PBS-treated TrJ controls correlating with a less densely packed NF cytoskeleton at the ultrastructural level.
Figure 6.

NT-3 gene therapy improves neurofilament cytoskeleton in trembler nerves. Neurofilament density (number/unit hexagonal area of 0.05 μm2) distribution in the sciatic nerve axons from TrJ mice at 20 weeks post-ssAAV1.CMV.NT-3 (1 × 10¹¹ vg) injection shows a shift to the left toward normalization compared to PBS-treated group. (a) A histogram from wild-type (WT) mice is included for comparison. (b) Same magnification representative cross sectional areas of neurofilament cytoskeleton from wild type, AAV1.NT-3, and phosphate-buffered saline (PBS)-injected control TrJ sciatic nerves are shown. The neurofilament density appears decreased with AAV1.NT-3 gene therapy. Bar = 0.2 μm. Western blot analyses show neurofilament heavy (NF-H) subunit phosphorylation status of peripheral nerves of TrJ mice at 20 weeks post-ssAAV1.CMV.NT-3 or PBS injection. (c) The amount of phosphorylated NF-H increased in the roots and sciatic nerves from AAV1.NT-3-treated TrJ mice complementing the ultrastructural findings. Error bars represent standard error (AAV1.NT-3 group, n = 4; PBS group, n = 5); *P < 0.05.
Muscle diameter increases at 40 weeks posttreatment: We also assessed the effects of NT-3 gene therapy in TrJ mice upon muscle fiber size at 40 weeks postinjection in a subset of animals injected with ssAAV1.CMV.NTF3 (1 × 10¹¹ vg) compared to PBS. Neurogenic changes characterized by atrophic angular fibers and group atrophy were evident in the muscles from untreated mice while evidence for reinnervation as fiber type groupings and an overall fiber size increase were recognizable as treatment effect (Supplementary Figure S4). Muscle fiber size histograms generated from contralateral anterior and posterior compartment muscles of the left lower limb (tibialis anterior and gastrocnemius) showed an increase in fiber diameter providing supporting histological evidence of nerve regeneration into the muscle (Supplementary Figure S5).
Electrophysiological studies. Our previous studies21 from wild-type and TrJ mice showed a reproducible and significantly slower conduction velocity in sciatic nerve comparable to published reports.22 In the studies described here, we set out to examine the efficacy of NT-3 gene therapy by assessing the alterations in the sciatic nerve conduction parameters and correlative ipsilateral and bilateral hindlimb grip strength. For these experiments, TrJ mice received ssAAV1.CMV.NT-3 (1 × 10¹¹ vg) or PBS injections into the right quadriceps muscle, and sciatic nerve conduction studies were carried out on the opposite extremity at baseline, 20 and 40 weeks postinjection.
A representative tracing of sciatic motor nerve conduction from wild type and TrJ are seen comparing baseline and endpoint at 40 weeks postvector injection in Supplementary Figure S6. The mutant demonstrated a marked reduction of the compound muscle action potential (CMAP) amplitude, prolonged distal latency, and polyphasic prolonged duration CMAP relative to the wild type comparable to published results.21,22 CMAP amplitude, which reflects the number of motor axons that established connection with the muscle, has been shown to be a valid outcome measure for nerve regeneration and reinnervation that correlates with grip strength.23 Table 2 summarizes the electrophysiological findings on TrJ at baseline, 20 and 40 weeks postinjection using 1 × 10¹¹ vg of ssAAV1.CMV.NT-3. Results indicate significantly greater CMAP amplitude in the NT-3-treated TrJ corresponding to a 37% difference compared to the PBS control group at 20 weeks. This CMAP amplitude increase correlated with hindlimb grip strength corresponding to a 39.7% improvement (10.53 g (grip force) difference; P = 0.0001) in simultaneous bilateral grip strength (Figure 3c) and a 29% improvement (6.4 g difference; P = 0.0009) when tested on only the ipsilateral side (Figure 3b). The results of these studies validate that the CMAP parameter can be used as a reliable outcome measure.
Table 2. CMAP and conduction velocity in the TrJ sciatic nerve.
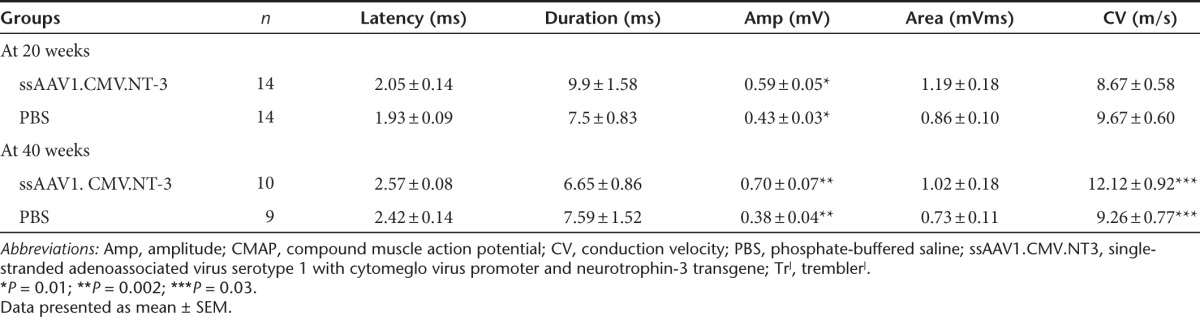
Endpoint electrophysiological studies at 40 weeks posttreatment revealed a mean CMAP increase of 84% greater amplitude in the NT-3 group compared to the PBS (Table 2). At this time point, there was a small but statistically significant increase in the sciatic nerve conduction velocity. Moreover, compared with baseline, the ssAAV1.CMV.NT-3 group at 20 weeks postinjection demonstrated 28% increase of CMAP amplitude, which increased to 52% at 40 weeks (P < 0.05) while in the PBS-TrJ controls, over the same period, there was a decline in the CMAP amplitude suggesting a correlation with the natural progression of the neuropathic process in this model (Figure 7). Baseline CMAP amplitude decreased to 0.38 ± 0.04 mV (n = 9) at 40 weeks corresponding to a 27% reduction without reaching statistical significance.
Figure 7.

NT-3 gene therapy improves compound muscle action potential (CMAP) in TrJ mice. Sciatic nerve CMAPs on TrJ at baseline, 20, and 40 weeks postinjection using 1 × 10¹¹ vg of ssAAV1.CMV.NT-3 or PBS are shown. Compared with baseline, AAV1.NT-3 group at 20 weeks postinjection demonstrated 28% increase of CMAP amplitude, which went up to a statistically significant 52% increase at 40 weeks while in the PBS-TrJ controls, over the same period, a decline in the CMAP amplitude was seen. Error bars represent standard error (n = 14 at baseline and 20 weeks in each group; AAV1.NT-3 group, n = 10; PBS group, n = 9 at 40 weeks), *P < 0.05.
Supplementary Table S1 summarizes the electrophysiological parameters comparing the efficacy of scAAV1.NT-3 under control of the CMV promoter versus the muscle-specific tMCK promoter given at three doses (3 × 10⁹ vg, 1 × 10¹⁰ vg, and 3 × 10¹⁰ vg) at 24 weeks post-gene transfer. At high dose (3 × 10¹⁰ vg), both CMV and tMCK vectors produced statistically highly significant improvements in CMAP amplitudes compared to PBS control group. Neither CMAP aplitudes nor NT-3 levels were statistically different for these two promoters at this dose when they were compared with each other. Analysis failed to find significant difference in CMAP amplitudes for intermediate and lower doses for both vectors compared to the PBS-TrJ controls. We found no strong relationship between CMAP amplitude and NT-3 levels in each group, but dose does have significant efect on CMAP (Spearman correlation; P = 0.0138).
Discussion
Studies described here are the first preclinical studies to illustrate proof of principle in support of AAV1.NT-3 gene therapy for sustained NT-3 delivery through secretion by muscle cells for the most common of the CMT neuropathies, CMT1A.
We report a long-term efficacy of NT-3 gene therapy on TrJ nerve pathology comparing single-stranded and self-complementary vectors, treatment duration, doses, and promoters. The biological systemic effect of NT-3 is mediated through its continuous release from the muscle as illustrated with a long-lasting therapeutic serum NT-3 levels and functional, histopathological, and electrophysiological improvements observed not only in the vector-injected limb but also in the contralateral limb. The long-lasting positive outcome of this treatment paradigm was validated with continuous improvement of MF densities and CMAP amplitudes over time. Studies carried out to 40 weeks showed significantly increased MF densities and CMAP amplitudes compared to 20 weeks posttreatment and baseline values. Furthermore, we have established correlative functional improvement between grip strength and CMAPs that has potential for relevance in future clinical trials.
scAAV permits lower dosing that enhances safety and at the same time eases the burden of vector production for clinical application.20 Furthermore, the use of a muscle specific promoter, tMCK, is a valued added safety feature helping to avoid off target expression with the potential for toxicity. As expected, scAAV1.CMV.NT-3 vector at 1 × 10¹¹ vg produced significantly higher NT-3 levels than the single-stranded vector at the same dose, and a half-log dose reduction (3 × 10¹⁰ vg) of both scAAV1.CMV.NT-3 and scAAV1.tMCK.NT-3 vectors produced improvements in CMAP amplitudes comparable to ssAAV.CMV.NT-3 supporting the use of the tMCK promoter in a self-complementary vector for future clinical trials.
CMT1A is a conventional prototype of a myelin disease by histological and electrophysiological criteria but at the same time manifests a clinical phenotype typical of a length-dependent neuropathy resulting from preferential distal axonal loss.24,25 Our previous studies, along with others have shown that axonal pathology in “demyelinating” CMT neuropathies is a major pathologic component contributing to the clinical phenotype that directly correlates with the clinical disability.18,25,26,27 Profound axonal cytoskeletal abnormalities leading to axonal degeneration and distally prominent axonal loss are thought to result from impaired SC-axon interactions.17,28 Studies in TrJ have shown reduced phosphorylation of NF-H and NF-M, permitting NFs to become densely packed as the hallmark cytoskeletal change representing perturbed SC-axon interactions.18,25,26,28
Previous studies from this laboratory have shown that in animal models of CMT, in addition to axonal pathology, there is impaired nerve regeneration.14,29 Moreover, in the TrJ nerves distal to the nerve crush at day 3 and 6, significant SC apoptosis was seen suggesting that mutant SCs are highly susceptible to apoptotic cell death when they return to promyelinating mode in the regenerating nerves.14 It is likely that the poor regeneration response to crush injury in TrJ is related to impaired SC proliferation/differentiation and subsequent SC loss by apoptosis. Similarly, apoptotic SC loss is seen in CMT1A patient biopsies, occurring in clusters where loss of axonal sprouts took place in an early stage of regeneration.30 Furthermore, we identified a defect in nerve regeneration characterized by fewer SCs in the regenerating nerve fibers of crushed sciatic nerves of NT3+/− heterozygous mice.11 Using sciatic nerve allograft paradigms we showed that NT3+/− status of the SCs, but not of the axons, is responsible for impaired nerve regeneration and that NT-3 is essential for SC survival in early stages of regeneration-associated myelination in the adult peripheral nerve. It should be emphasized here that prolonged denervation with accompanying SC atrophy, a model that simulates a chronic distal axonal neuropathic process in humans has a series of consequences that include decreased regeneration capacity related to loss of receptors and reduced expression of growth factors, a gradual decline in SC number with downstream inability to maintain bands of Bungner.31,32,33,34,35 From a translational viewpoint, collectively these observations strongly support our central hypothesis that priming SCs with NT-3 is beneficial to nerve regeneration and associated myelination, by transforming denervated SCs into a competent promyelinating state of readiness as a crucial first step in the potential treatment of chronic neuropathic conditions, especially for disorders like the primary SC forms of CMT neuropathies.
In our previous studies, we observed three important biologic effects of NT-3: (i) an increase in the SC numbers, (ii) an increase in the number of MFs, and (iii) a normalization of axonal NF cytoskeleton.14 With the current study, using a gene therapy approach, we confirmed those findings and firmly established the efficacy of NT-3 in the intact and regenerating TrJ nerves by providing qualitative and quantitative data for improvements in the MF density, myelin thickness, SC number, and axonal cytoskeletal properties (increased NF-H phosphorylation and decreased NF packing density) as well as muscle fiber diameter. Moreover, we provided functional and electrophysiological evidence that NT-3 improves efficiency of axonal regeneration resulting in improved motor function and CMAP amplitude in the TrJ mouse model of CMT. We believe that NT-3 effect on mutant SC survival and differentiation with resulting increases in the competent SC pool as well as improvements toward normalization of axonal NF cytoskeletal properties appear as the major players in this outcome.13 In addition to SC-mediated augmentation of regeneration, there may also be a direct effect upon neurons that promote axonal sprouting. NT-3 and its high-affinity receptor, TrkC, are present in high numbers of spinal motor neurons and in a subpopulation of large diameter primary sensory neurons.36,37 Furthermore, NT-3 is internalized and retrogradely transported from the periphery to motoneuron cell bodies.38 NT-3 also plays a role in functional maturation of neuromuscular synapses and is expressed in skeletal muscle as the predominant neurotrophin.39,40,41 It was reported that NT-3 exerts a selective action on type 2B fast muscle fibers of gastric muscle 8 months after nerve repair following local delivery.42 However, using our experimental approach that results in the systemic exposure of the neuromuscular system to NT-3, we found significant diameter increases for both fast twitch oxidative and glycolytic fibers as well as the slow twitch oxidative fibers in the TrJ gastrocnemius muscles (results not shown) with more prominent increases in both fast fiber subtypes.
Our finding of increased myelin thickness in trembler nerves with NT-3 gene therapy is in contrast with the previously proposed inhibitory role for NT-3 in myelination43,44 but supports an opposite role for NT-3 as shown by more recent in vivo studies.11,45 Studies by Woolley et al.45 demonstrated that developmental loss of NT-3 results in reduced levels of myelin-specific proteins, reduced extent of myelination, and increased apoptosis of SCs. Our own previous studies in the nude mice harboring allografts from NT3+/− mice revealed a retardation of the myelination process emphasizing the supportive/facilitator role of NT-3 for optimal myelination.11 NT3+/− SCs were halted at their immature state with processes engulfing polyaxonal aggregates of the recipient nude mice axons with NT3+/+ status.11 Our data suggests that NT-3-primed SCs are more competent in the myelination process as reflected by significant improvements in the g ratios across all axon diameters, particularly for small and medium diameter axons at 20 weeks AAV1.NT-3 postinjection. Therefore, the nerve conduction studies will not reflect the histological changes in myelin thickness at this time point. It should be noted however that the sustained NT-3 effect on myelin thickness on these severely hypomyelinated TrJ nerves resulted in very modest increases in the sciatic nerve conduction velocity at 40 weeks post-gene injection, as anticipated. On the other hand, the improved grip strength in this model directly correlates with increased CMAP amplitudes as an index of the number of axons that have functional neuromuscular connections. Moreover, increases in muscle fiber diameters that we observed in histograms from anterior and posterior compartment muscles of the lower limb at 40 weeks provide additional evidence of nerve regeneration into the muscle.
Finally, the clinical outcome of a length dependent distal axonal disease (worsening, stable or improved) depends on two seemingly opposing but intimately associated pathobiological processes: (i) the degree or rate of axonal degeneration, progressing centripetally toward cell body and (ii) the ability of the nascent axon tips to regenerate efficiently.13 It is important to reemphasize that our current strategy to alter these processes would improve the efficiency of nerve regeneration and associated myelination. NT-3, with its proven biologic efficacy in trembler model fulfills criteria to consider this approach using AAV-mediated gene delivery as potential therapy for CMT1A, but also raises the possibility for translation to other longstanding neuropathies with distal axonal loss. Although we have confidence in potentially providing a safe product delivered by rAAV, it is best to be cautious about predicting efficacy in a clinical trial in CMT patients based on a study in mice.
Materials and Methods
AAV vector construction. Vector DNA plasmid pAAV.CMV.NT-3 (gift from B.K.K.) was used to generate single-stranded rAAV1.CMV.NT-3. It contains the human NT-3 CDS (GeneBank designation NTF3) under the control of the CMV promoter cloned between AAV2 inverted terminal repeats. To generate self-complementary (sc) AAV vectors, AAV DNA plasmid vectors pscAAV.CMV.NT-3 were generated as follows: the NT-3 coding sequence was polymerase chain reaction (PCR) amplified from plasmid, the pAAV.CMV.NT-3 vector using forward (5′-accttgcggccgccaccatgtccatcttgttttatg-3′) and reverse (5′-catatgcggccgcctcatgttcttc cgatttttctcgacaaggcacaca-3′) primers. The NT-3 PCR fragment was then digested with Not I and ligated into the self-complementary pAAV.CMV.X5 (b54) vector from which the X5 cDNA was removed by Not I digestion. For generating self-complementary DNA vector plasmid pscAAV.tMCK.NT3, the NT-3 cDNA was amplified from plasmid pAAV.CMV.NT-3 by PCR using forward (5′-atgtcggtacctgcagggatatcca ccatgtccatcttgttttatgtga-3′) and reverse (5′-tcagtggcgcgccgaaaaaacctcccacacctccc-3′) primers. The resulting NT-3 cDNA PCR fragment was then digested with Kpn I and Asc I enzymes and cloned into a self-complementary pscAAV.tMCK.aSG vector plasmid from which the αSG transgene was removed by Kpn I and Asc I digestion. The final constructs were confirmed by restriction digestion and sequencing. All vectors include a consensus Kozak sequence, an SV40 intron, and synthetic polyadenylation site (53 bp). The tMCK promoter (713 bp) was a kind gift from Dr. Xiao Xiao (University of North Carolina, Chapel Hill, NC).19 It is a modification of the previously described CK6 promoter46 and includes a modification in the enhancer upstream of the promoter region containing transcription factor binding sites. The enhancer is composed of 2 E-boxes (right and left). The tMCK promoter modification includes a mutation converting the left E-box to a right E-box (2R modification) and a 6 bp insertion (S5 modification).
rAAV Vector production. AAV1 vector production was accomplished using a standard 3 plasmid DNA/CaPO4 precipitation method using HEK293 cells. Two hundred and ninety-three cells were maintained in DMEM supplemented with 10% fetal bovine serum and penicillin and streptomycin. The production plasmids were: (i) pAAV.CMV.NT-3, pscAAV.CMV.NT-3, or pscAAV.tMCK.NT-3 (ii) rep2-cap1 modified AAV helper plasmid encoding the cap 1 serotype, and (iii) an adenovirus type 5 helper plasmid (pAdhelper) expressing adenovirus E2A, E4 ORF6, and VA I/II RNA genes. A quantitative PCR-based titration method was used to determine an encapsidated vg titer utilizing a Prism 7500 Taqman detector system (PE Applied Biosystems, Grand Island, NY).47 The primer and fluorescent probe targeted the tMCK and CMV promoters and were as follows: tMCK forward primer, 5′-ACCCGAGATGCCTGGTTATAATT-3′; tMCK reverse primer, 5′-TCCATGGTGTACAGAGCCTAAGAC-3′; and tMCK probe, 5′-FAM-CTGCTGCCTGAGCCTGAGCGGTTAC-TAMRA-3′; CMV forward primer, 5′-TGGAAATCCCCGTGAGTCAA-3′; CMV reverse primer, 5′-CATGGTGATGCGGTTTTGG-3′; and CMV probe, 5′-FAM-CCGCTATCCACGCCCATTGATG-TAMRA-3′.
Animals, procedures and treatment groups. TrJ mice (B6.D2-Pmp22Tr-J/J) and C57BL/6 wild type were obtained from Jackson Laboratory (Bar Harbor, ME). All animal experiments were performed according to the guidelines approved by The Research Institute at Nationwide Children's Hospital Animal Care and Use Committee. The design of the experimental groups comparing single-stranded and self-complementary AAV1.NT-3 vectors, treatment duration, doses, and promoters is outlined below: (i) for the nerve regeneration study, 9–12-week-old TrJ mice were injected in the left gastrocnemius muscle with either PBS or 1 × 10¹¹ vg of ssAAV1.CMV.NT-3 (n = 12). At 3 weeks postinjection, under isoflurane anesthesia, left sciatic nerves were exposed and crushed with a fine forceps at a level 5 mm distal to the sciatic notch to generate a regeneration paradigm as previously described.18 Functional recovery, measured weekly by grip strength obtained from the limb harboring the crushed nerve and the morphological assessment of nerve regeneration were the primary endpoints of this study. At 20 weeks, postcrush mice were euthanized for tissue and serum collection for NT-3 ELISA enumeration. (ii) In this set of experiments, the effect of NT-3 gene therapy on the sciatic nerve motor conduction parameters and on the motor functions (ipsilateral and simultaneous bilateral grip strength) were investigated with endpoint correlative histopathology. Six- to 8-week-old TrJ mice received 1 × 10¹¹ vg of ssAAV1.CMV.NT-3 or PBS in the right quadriceps muscle (n = 14 in each group). The left sciatic nerve conduction studies were performed at baseline age and were repeated at 20 and 40 weeks post-gene transfer. At 20 weeks, four vector-injected and five PBS-injected mice were euthanized for tissue collection for the assessment of NF cytoskeleton and NF phosphorylation studies using ultrastructural morphometry and western blot. Functional status of the remainder mice were monitored using rotarod between 23 and 40 weeks, and following endpoint electrophysiology, mice were euthanized for harvesting left sciatic nerve and distal leg muscles. (iii) The efficacy of scAAV1.NT-3 under control of the CMV promoter versus the muscle-specific tMCK promoter both given at three doses, within a half-log range (3 × 10⁹ vg, 1 × 10¹⁰ vg, and 3 × 10¹⁰ vg) was assessed using endpoint electrophysiological and morphological studies. A total of 177 TrJ mice in 7 cohorts (n = 23–29 in each cohort) were generated, receiving i.m. injections of the self-complimentary vectors into the right gastric muscle at low dose, intermediate dose, or high dose with either promoters as indicated above or PBS. Technically acceptable quality nerve conduction studies were obtained from the left sciatic nerves in 171 mice. At the end of each study, mice were euthanized for tissue and serum collection for NT-3 ELISA. MF density determinations were done in high-dose cohorts (n = 13 with CMV, n = 26 with tMCK, and n = 12 with PBS).
Serum NT-3 ELISA. Serum collected from PBS and AAV1.NT-3 injected mice was assayed for NT-3 levels using a capture ELISA assay. Briefly, Immunlon4 plates were coated with 100 µl of a monoclonal anti-human NT-3 capture antibody (Cat# MAB267, 4 µg/ml, R&D Systems, Minneapolis, MN) in BupH carbonate buffer for 6 hours at 25 °C. Plates were subsequently blocked with PBS + 1% BSA + 5% sucrose overnight at 2–8 °C. The next day, plates were washed four times with PBS + 0.05% Tween20 (PBS-T) and a NT-3 standard (recombinant human NT-3, Cat# 267-N3, R&D Systems) was prepared using serial twofold dilutions in the range of 10–1,280 pg/ml in 20 mmol/l Tris, 150 mmol/l NaCl, 0.1% BSA, 0.05% Tween-20 and applied to the plate (100 µl volume). Animal sera were diluted 1:20 and 1:50 using the same dilution buffer used for the NT-3 standard and 100 µl added to the plate. Standards and serum samples were incubated at room temperature (25 °C) with gentle shaking for 2 hours ± 10 minutes. Following four PBS-T washes, 100 µl of a diluted goat anti-NT3-biotin detection antibody was added to each well and incubated 90 minutes ± 10 minutes. at RT (0.2 µg/ml of polyclonal goat anti-NT3-biotin detection antibody; Cat# BAF267; R&D Systems). Following PBS-T washes, 100 µl of a 1:1,000 dilution (PBS diluent) of extra-avidin-HRP developer solution was added to the wells and incubated for 60 minutes ± 10 minutes at RT (extra-avidin-HRP; Cat# E2896; Sigma, St Louis, MO). After washing, plates were developed by adding 100 µL of RT TMB substrate solution in the dark for 15 minutes ± 1 minutes (1-step ultra TMB-ELISA; Cat# 34028; Thermo, Waltham, MA). The reaction was stopped by adding 50 µl of 2N H2SO4, and the optical density at 450 nm determined for each well on a Bio-tek Synergy 2 ELISA plate reader running the Gen5 2.0 Data Analysis Software package (Bio-tek US, Winooski, VT). NT-3 serum concentrations were extrapolated from the NT-3 standard curve using a best fit algorithm.
Motor function testing. TrJ mice were tested for baseline motor function within 1 week prior to receiving i.m. injection of ssAAV1.CMV.NT-3 or PBS. Motor function tests included bilateral simultaneous hindlimb grip power and that of the left hind paw using a grip strength meter (Chatillon Digital Meter; Model DFIS-2; Columbus Instruments, Columbus, OH) as we have used in our previous studies.21 Bilateral or unilateral grip strength was assessed by allowing the animals to grasp a platform followed by pulling the animal until it releases the platform; the force measurements were recorded in four separate trials. Measurements were performed on the same day and time of each week. Endpoint bilateral and ipsilateral grip strength measurements were done in two sessions (morning and afternoon), three trials in each per day for 3 consecutive days prior to obtaining the nerve conduction studies. The mean of these measurements were used to correlate with conduction studies.
Rotarod testing. Mouse motor function and balance was tested weekly by using the accelerating rotarod (Columbus Instruments). Mice were trained on the rotarod apparatus for 2 weeks to acclimate to testing protocol prior to data collection. A fixed rotation protocol at 5 rpm constant rotation was used, and the average of the three trials per session was recorded.
Nerve conduction studies. The nerve conduction studies were performed under isofluorane anesthesia. Temperatures were recorded with an infrared thermometer (Fisher Scientific, Pittsburgh, PA), and body temperature was maintained between 32 and 36 °C using a heating pad. Following body temperature equilibration, left sciatic nerve conduction studies were obtained using a XLTEK NeuroMaX 1002 electromyograph (Ontario, Canada) and Rhythmlink disposable subdermal needle recording electrodes (for both stimulation and recording) as we described previously.21 The stimulating electrodes were placed at the proximal and distal stimulation sites (i.e., the left sciatic notch and just above the ankle, respectively), and a third pair of recording electrodes was positioned in the foot pad between the second and third digits of the left foot. The latency, duration, negative area under curve, and conduction velocity values of the recorded sciatic motor responses were determined. A caliper was utilized to measure the interelectrode distances, and these distances were used in calculations of intersegmental velocity. In addition, onset latency, duration, and amplitude were also calculated.
Processing of sciatic nerve for histopathological analysis. For the nerve regeneration study, mice were killed quickly by an overdosage of xylazine/ketamine anesthesia at 20 weeks postcrush. The sciatic nerves from crushed and intact sites were removed under a dissecting microscope, fixed in glutaraldehyde; tissue blocks were marked for proximodistal orientation and processed for plastic embedding for light and electron microscopy using standard methods established in our laboratory.48 In all other experiments, left sciatic nerves were removed and processed in the same manner.
MF density determinations. Quantitative analysis at the light microscopic level was performed on 1 µm thick cross sections from regenerating and intact uncrushed sciatic nerves using a microscope-mounted video camera at ×1,600 magnification and an image analysis software (Bioquant TCW98 image analysis software; R&M Biometrics, Nashville, TN) as previously described.29 Data assessing regeneration response were obtained from the second segment, at a level ~4 mm distal to the crush. The mid sciatic nerve segments were analyzed from uncrushed intact nerves in all cases. Four randomly selected areas were analyzed in each mice. MF densities (mean number ± SE/mm2) and composites of MF axon size distribution histograms were generated in rAAV1.NT-3 and PBS-injected groups.
g ratio of the MF. The g ratio refers to the ratio of axonal diameter/fiber diameter, and lower g ratios represent axons with thicker myelin.49 For g ratio determinations, three representative areas of cross sectional images of mid sciatic nerves from three ssAAV1.CMV. NT-3- and PBS-injected TrJ mice and wild type were captured at ×100 magnification, and the shortest axial lengths as axon diameters and fiber diameters were recorded with a calibrated micrometer, using the AxioVision, 4.2 software (Zeiss) as we described previously.21 The g ratios and axon diameters are displayed in a scattergram.
SC density. One micrometer thick, plastic embedded cross-sections were used for MF and SC nuclei counts. Three randomly selected areas in five AAV1.CMV.NT-3- and PBS-injected TrJ mice were photographed at ×100, and the number of MF and SC nuclei not in contact with the MFs was determined. Morphologic criteria used for identification of SC nuclei included homogenous, rounded, ovoid, or bean-shaped appearance with irregular contour. Nuclei with irregular contour and dense peripheral zones belonging to fibroblasts were excluded. The SC densities were estimated as number per mm2 of the endoneurial area, by adding the number of SC nuclei belonging to unmyelinated fibers or at a promyelination stage with 1:1 axon-SC relationship to the number of MFs as we reported previously.14 SC nuclei belonging to the MFs were excluded.
NF packing density determinations. Ultrastructural morphometric studies were performed using cross sectional images of sciatic nerves at ×52,000 final magnification. NF density histograms were generated by determining the number of NFs per unit hexagonal area in randomly selected myelinated axons from treated and untreated TrJ mice and wild-type mice as previously described.18 Ten randomly selected MFs with axon diameters between 3.6 and 5.0 µm at 20 weeks posttreatment were analyzed in each group.
Histological analysis of muscle. Gastrocnemius and tibialis anterior muscles from ssAAV1.CMV.NT-3 and PBS-injected TrJ mice (n = 3 in each group) were removed and 12 µm thick cross cryostat sections were stained for succinic dehydrogenase for generation of muscle fiber size distribution histograms as previously described.21 Over 2,000 fibers were analyzed in each group.
NF cytoskeleton and phosphorylation. Sciatic and spinal nerves and roots from ssAAV1.CMV.NT-3 and PBS-injected TrJ mice were used for quantitative western blot analysis of NF proteins with NF-H-specific antibodies. Briefly, the tissues were harvested and immediately frozen over dry ice. Tissues were homogenized in radio immunoprecipitation assay buffer (50 mmol/l Tris-HCl pH 8.0, 1% NP-40, 150 mmol/l NaCl, 0.5%sodium deoxycholate, 1% sodium dodecyl sulfate, 1 mmol/l ethylene glycol tetraacetic acid, 1 mmol/l Na3VO4, 1 mmol/l NaF, phenylmethylsulfonyl fluoride (1:250), Complete protease inhibitor (1:25), and 25.5 mmol/l sodium pyrophosphate) using blue tip and Kontes pestle. Protein concentrations were determined using RC/DC method (BioRad Laboratories, Hercules, CA). For sodium dodecyl sulfate polyacrylamide gel electrophoresis, 5 µg of protein was run on 3–8% Tris-acetate NuPage gels (Invitrogen, Grand Island, NY) and transferred to PVDF membrane (Amersham Biosciences, Pittsburgh, PA). After blocking for 1 hour in 5% nonfat dry milk in TBST (100 mmol/l Tris-HCl, pH 8.0, 167 mmol/l NaCl, 0.1% Tween), the western blots were incubated with diluted primary antibodies against total NF-H (AB1989, COOH-terminal antibody from Chemicon; diluted 1:500), hyperphosphorylated NF-H (SMI-31 from Sternberger; diluted 1:20,000) and hypophosphorylated NF-H (SMI-35 from Sternberger; diluted 1:10,000). Blots were washed and incubated in appropriate horseradish peroxidase–conjugated secondary antibodies at a dilution of 1:2,000. GAPDH was used as loading control (Millipore, Billerica, MA; diluted 1:500). Immunoreactive bands were visualized with the use of ECL Plus Western blotting detection system (GE Healthcare, Pittsburgh, PA) and Hyperfilm ECL (Amersham Biosciences). Signal intensities were measured with ImageQuant software (GE Healthcare).
Statistical analysis. For comparisons between ssAAV1.CMV.NT-3 gene transfer and PBS-treated TrJ groups, statistical analysis were performed in Graph pad Prism 4 software, using one-way analysis of variance followed by Bonferroni multiple post hoc comparisons. Unpaired or paired Student's t-test was performed when applicable. Differences between the means were considered significant at two-tailed test. Significance level was set at P < 0.05. Summary statistics were reported as mean ± SEM.
For the studies comparing the efficacy of scAAV1.NT-3 under control of the CMV promoter versus the muscle-specific tMCK promoter both given at three doses, the following analyses were used: (i) Spearman correlation to study the relationship between outcomes, (ii) Kruskal–Wallis test to compare outcomes among all groups (PBS, CMV low dose/intermediate dose/high dose and tMCK low dose/intermediate dose/high dose), and (iii) Mann–Whitney U-test to compare outcomes between each group and PBS (control) group, and Bonferroni correction to adjust for multiple comparisons. Two-way analysis of variance is used to study the effects of gene vectors and doses on outcomes. All tests are conducted by SAS 9.2 (by SAS Institute, Cary, NC).
SUPPLEMENTARY MATERIAL Figure S1. Serum levels of NT-3 in TrJ mice at 23 weeks postinjection (shown as individual mice) compared to PBS-treated TrJ controls (numbers 567, 570, 573, and 591) are shown in individual mice. Figure S2. One micrometer thick, toluidine blue-stained representative cross sections of intact/uncrushed (a,b) and regenerating (c,d) sciatic nerves from TrJ mice injected with PBS (a,c) and AAV1.NT-3 (b,d) at 20 weeks. Thinly myelinated and naked axons are indicated with arrows in PBS-treated intact and regenerating nerves (a,c). AAV1.NT-3 gene therapy results in an increase of axons with thicker myelin (arrows) in intact nerves (b) and an apparent increase in the small myelinated fibers (arrows) in regenerating nerves (d). Figure S3. Composite histograms showing myelinated fiber distribution in the regenerating (a) and contralateral intact (b) sciatic nerves from TrJ mice at 20 weeks post AAV1.NT-3 gene therapy showing an increase in the subpopulation of axons <4 µm in diameter in AAV1NT3 group compared to PBS-control. Figure S4. Neurogenic changes in the gastrocnemius muscle from a PBS-treated TrJ (a) showing atrophic angular fibers of either histochemical fiber types (arrows) or fiber type atrophy (asterisk). Reinnervation induced changes (asterisks mark fiber type groupings) at 40 weeks post AAV1.NT-3 gene therapy (b). Figure S5. Muscle fiber size histograms from tibialis anterior (a) and gastrocnemius (b) muscles at 40 weeks post AAV1.NT-3 gene therapy. Both muscles showed an increase in fiber diameter (c) as histologic evidence of nerve regeneration into the muscle compared to PBS-injected control group. Figure S6. Representative tracings of sciatic motor nerve conduction from a wild-type and TrJ mouse at baseline and endpoint at 40 weeks postvector injection. Table S1. Sciatic nerve electrophysiology in TrJ mice following AAV1. NT-3 gene transfer at 24 weeks.
Acknowledgments
This work has been supported by National Institutes of Health U01(674912) grant (PI ZS). We thank Wei Wang (Biostatistics Core, The Research Institute at Nationwide Children's Hospital) for statistical analysis of data and Anna Hughes and Minhaj Uddin (Department of Pathology at Nationwide Children's Hospital) for their expert technical assistance in ultrastructural studies. We thank the Viral Vector Core Laboratory at The Research Institute at Nationwide Children's Hospital for producing the rAAV1 vectors used in these studies.
Supplementary Material
Serum levels of NT-3 in TrJ mice at 23 weeks postinjection (shown as individual mice) compared to PBS-treated TrJ controls (numbers 567, 570, 573, and 591) are shown in individual mice.
One micrometer thick, toluidine blue-stained representative cross sections of intact/uncrushed (a,b) and regenerating (c,d) sciatic nerves from TrJ mice injected with PBS (a,c) and AAV1.NT-3 (b,d) at 20 weeks. Thinly myelinated and naked axons are indicated with arrows in PBS-treated intact and regenerating nerves (a,c). AAV1.NT-3 gene therapy results in an increase of axons with thicker myelin (arrows) in intact nerves (b) and an apparent increase in the small myelinated fibers (arrows) in regenerating nerves (d).
Composite histograms showing myelinated fiber distribution in the regenerating (a) and contralateral intact (b) sciatic nerves from TrJ mice at 20 weeks post AAV1.NT-3 gene therapy showing an increase in the subpopulation of axons <4 µm in diameter in AAV1NT3 group compared to PBS-control.
Neurogenic changes in the gastrocnemius muscle from a PBS-treated TrJ (a) showing atrophic angular fibers of either histochemical fiber types (arrows) or fiber type atrophy (asterisk). Reinnervation induced changes (asterisks mark fiber type groupings) at 40 weeks post AAV1.NT-3 gene therapy (b).
Muscle fiber size histograms from tibialis anterior (a) and gastrocnemius (b) muscles at 40 weeks post AAV1.NT-3 gene therapy. Both muscles showed an increase in fiber diameter (c) as histologic evidence of nerve regeneration into the muscle compared to PBS-injected control group.
Representative tracings of sciatic motor nerve conduction from a wild-type and TrJ mouse at baseline and endpoint at 40 weeks postvector injection.
Sciatic nerve electrophysiology in TrJ mice following AAV1. NT-3 gene transfer at 24 weeks.
References
- Skre H. Genetic and clinical aspects of Charcot-Marie-Tooth's disease. Clin Genet. 1974;6:98–118. doi: 10.1111/j.1399-0004.1974.tb00638.x. [DOI] [PubMed] [Google Scholar]
- Marques W, Jr, Freitas MR, Nascimento OJ, Oliveira AB, Calia L, Melo A, et al. 17p duplicated Charcot-Marie-Tooth 1A: characteristics of a new population. J Neurol. 2005;252:972–979. doi: 10.1007/s00415-005-0797-9. [DOI] [PubMed] [Google Scholar]
- Houlden H, Reilly MM. Molecular genetics of autosomal-dominant demyelinating Charcot-Marie-Tooth disease. Neuromolecular Med. 2006;8:43–62. doi: 10.1385/nmm:8:1-2:43. [DOI] [PubMed] [Google Scholar]
- Lupski JR, de Oca-Luna RM, Slaugenhaupt S, Pentao L, Guzzetta V, Trask BJ, et al. DNA duplication associated with Charcot-Marie-Tooth disease type 1A. Cell. 1991;66:219–232. doi: 10.1016/0092-8674(91)90613-4. [DOI] [PubMed] [Google Scholar]
- Raeymaekers P, Timmerman V, Nelis E, De Jonghe P, Hoogendijk JE, Baas F, et al. Duplication in chromosome 17p11.2 in Charcot-Marie-Tooth neuropathy type 1a (CMT 1a). The HMSN Collaborative Research Group. Neuromuscul Disord. 1991;1:93–97. doi: 10.1016/0960-8966(91)90055-w. [DOI] [PubMed] [Google Scholar]
- Frostick SP, Yin Q, Kemp GJ. Schwann cells, neurotrophic factors, and peripheral nerve regeneration. Microsurgery. 1998;18:397–405. doi: 10.1002/(sici)1098-2752(1998)18:7<397::aid-micr2>3.0.co;2-f. [DOI] [PubMed] [Google Scholar]
- Meier C, Parmantier E, Brennan A, Mirsky R, Jessen KR. Developing Schwann cells acquire the ability to survive without axons by establishing an autocrine circuit involving insulin-like growth factor, neurotrophin-3, and platelet-derived growth factor-BB. J Neurosci. 1999;19:3847–3859. doi: 10.1523/JNEUROSCI.19-10-03847.1999. [DOI] [PMC free article] [PubMed] [Google Scholar]
- Mirsky R, Jessen KR, Brennan A, Parkinson D, Dong Z, Meier C, et al. Schwann cells as regulators of nerve development. J Physiol Paris. 2002;96:17–24. doi: 10.1016/s0928-4257(01)00076-6. [DOI] [PubMed] [Google Scholar]
- Syroid DE, Zorick TS, Arbet-Engels C, Kilpatrick TJ, Eckhart W, Lemke G. A role for insulin-like growth factor-I in the regulation of Schwann cell survival. J Neurosci. 1999;19:2059–2068. doi: 10.1523/JNEUROSCI.19-06-02059.1999. [DOI] [PMC free article] [PubMed] [Google Scholar]
- Sterne GD, Brown RA, Green CJ, Terenghi G. Neurotrophin-3 delivered locally via fibronectin mats enhances peripheral nerve regeneration. Eur J Neurosci. 1997;9:1388–1396. doi: 10.1111/j.1460-9568.1997.tb01493.x. [DOI] [PubMed] [Google Scholar]
- Sahenk Z, Oblinger J, Edwards C. Neurotrophin-3 deficient Schwann cells impair nerve regeneration. Exp Neurol. 2008;212:552–556. doi: 10.1016/j.expneurol.2008.04.015. [DOI] [PubMed] [Google Scholar]
- McTigue DM, Horner PJ, Stokes BT, Gage FH. Neurotrophin-3 and brain-derived neurotrophic factor induce oligodendrocyte proliferation and myelination of regenerating axons in the contused adult rat spinal cord. J Neurosci. 1998;18:5354–5365. doi: 10.1523/JNEUROSCI.18-14-05354.1998. [DOI] [PMC free article] [PubMed] [Google Scholar]
- Sahenk Z. Neurotrophins and peripheral neuropathies. Brain Pathol. 2006;16:311–319. doi: 10.1111/j.1750-3639.2006.00038.x. [DOI] [PMC free article] [PubMed] [Google Scholar]
- Sahenk Z, Nagaraja HN, McCracken BS, King WM, Freimer ML, Cedarbaum JM, et al. NT-3 promotes nerve regeneration and sensory improvement in CMT1A mouse models and in patients. Neurology. 2005;65:681–689. doi: 10.1212/01.wnl.0000171978.70849.c5. [DOI] [PubMed] [Google Scholar]
- Poduslo JF, Curran GL. Permeability at the blood-brain and blood-nerve barriers of the neurotrophic factors: NGF, CNTF, NT-3, BDNF. Brain Res Mol Brain Res. 1996;36:280–286. doi: 10.1016/0169-328x(95)00250-v. [DOI] [PubMed] [Google Scholar]
- de Waegh S, Brady ST. Altered slow axonal transport and regeneration in a myelin-deficient mutant mouse: the trembler as an in vivo model for Schwann cell-axon interactions. J Neurosci. 1990;10:1855–1865. doi: 10.1523/JNEUROSCI.10-06-01855.1990. [DOI] [PMC free article] [PubMed] [Google Scholar]
- de Waegh SM, Lee VM, Brady ST. Local modulation of neurofilament phosphorylation, axonal caliber, and slow axonal transport by myelinating Schwann cells. Cell. 1992;68:451–463. doi: 10.1016/0092-8674(92)90183-d. [DOI] [PubMed] [Google Scholar]
- Sahenk Z, Chen L, Mendell JR. Effects of PMP22 duplication and deletions on the axonal cytoskeleton. Ann Neurol. 1999;45:16–24. doi: 10.1002/1531-8249(199901)45:1<16::aid-art5>3.0.co;2-f. [DOI] [PubMed] [Google Scholar]
- Wang B, Li J, Fu FH, Chen C, Zhu X, Zhou L, et al. Construction and analysis of compact muscle-specific promoters for AAV vectors. Gene Ther. 2008;15:1489–1499. doi: 10.1038/gt.2008.104. [DOI] [PubMed] [Google Scholar]
- McCarty DM. Self-complementary AAV vectors; advances and applications. Mol Ther. 2008;16:1648–1656. doi: 10.1038/mt.2008.171. [DOI] [PubMed] [Google Scholar]
- Sahenk Z, Galloway G, Edwards C, Malik V, Kaspar BK, Eagle A, et al. TrkB and TrkC agonist antibodies improve function, electrophysiologic and pathologic features in Trembler J mice. Exp Neurol. 2010;224:495–506. doi: 10.1016/j.expneurol.2010.05.013. [DOI] [PubMed] [Google Scholar]
- Meekins GD, Emery MJ, Weiss MD. Nerve conduction abnormalities in the trembler-j mouse: a model for Charcot-Marie-Tooth disease type 1A. J Peripher Nerv Syst. 2004;9:177–182. doi: 10.1111/j.1085-9489.2004.09310.x. [DOI] [PubMed] [Google Scholar]
- Wang H, Sorenson EJ, Spinner RJ, Windebank AJ. Electrophysiologic findings and grip strength after nerve injuries in the rat forelimb. Muscle Nerve. 2008;38:1254–1265. doi: 10.1002/mus.20971. [DOI] [PubMed] [Google Scholar]
- Dyck PJ, Lais AC, Offord KP. The nature of myelinated nerve fiber degeneration in dominantly inherited hypertrophic neuropathy. Mayo Clin Proc. 1974;49:34–39. [PubMed] [Google Scholar]
- Sahenk Z, Chen L, Freimer M. A novel PMP22 point mutation causing HNPP phenotype: studies on nerve xenografts. Neurology. 1998;51:702–707. doi: 10.1212/wnl.51.3.702. [DOI] [PubMed] [Google Scholar]
- Sahenk Z, Chen L. Abnormalities in the axonal cytoskeleton induced by a connexin32 mutation in nerve xenografts. J Neurosci Res. 1998;51:174–184. doi: 10.1002/(SICI)1097-4547(19980115)51:2<174::AID-JNR6>3.0.CO;2-A. [DOI] [PubMed] [Google Scholar]
- Krajewski KM, Lewis RA, Fuerst DR, Turansky C, Hinderer SR, Garbern J, et al. Neurological dysfunction and axonal degeneration in Charcot-Marie-Tooth disease type 1A. Brain. 2000;123 (Pt 7):1516–1527. doi: 10.1093/brain/123.7.1516. [DOI] [PubMed] [Google Scholar]
- Sahenk Z. Abnormal Schwann cell-axon interactions in CMT neuropathies. The effects of mutant Schwann cells on the axonal cytoskeleton and regeneration-associated myelination. Ann N Y Acad Sci. 1999;883:415–426. [PubMed] [Google Scholar]
- Sahenk Z, Serrano-Munuera C, Chen L, Kakabadze I, Najagara HN. Evidence for impaired axonal regeneration in PMP22 duplication: studies in nerve xenografts. J Peripher Nerv Syst. 2003;8:116–127. doi: 10.1046/j.1529-8027.2003.03017.x. [DOI] [PubMed] [Google Scholar]
- Erdem S, Mendell JR, Sahenk Z. Fate of Schwann cells in CMT1A and HNPP: evidence for apoptosis. J Neuropathol Exp Neurol. 1998;57:635–642. doi: 10.1097/00005072-199806000-00009. [DOI] [PubMed] [Google Scholar]
- Li H, Terenghi G, Hall SM. Effects of delayed re-innervation on the expression of c-erbB receptors by chronically denervated rat Schwann cells in vivo. Glia. 1997;20:333–347. doi: 10.1002/(sici)1098-1136(199708)20:4<333::aid-glia6>3.0.co;2-6. [DOI] [PubMed] [Google Scholar]
- Sulaiman OA, Gordon T. Effects of short- and long-term Schwann cell denervation on peripheral nerve regeneration, myelination, and size. Glia. 2000;32:234–246. doi: 10.1002/1098-1136(200012)32:3<234::aid-glia40>3.0.co;2-3. [DOI] [PubMed] [Google Scholar]
- Sunderland S. Factors influencing the course of regeneration and the quality of the recovery after nerve suture. Brain. 1952;75:19–54. doi: 10.1093/brain/75.1.19. [DOI] [PubMed] [Google Scholar]
- Michalski B, Bain JR, Fahnestock M. Long-term changes in neurotrophic factor expression in distal nerve stump following denervation and reinnervation with motor or sensory nerve. J Neurochem. 2008;105:1244–1252. doi: 10.1111/j.1471-4159.2008.05224.x. [DOI] [PMC free article] [PubMed] [Google Scholar]
- Allodi I, Udina E, Navarro X. Specificity of peripheral nerve regeneration: interactions at the axon level. Prog Neurobiol. 2012;98:16–37. doi: 10.1016/j.pneurobio.2012.05.005. [DOI] [PubMed] [Google Scholar]
- Lamballe F, Klein R, Barbacid M. trkC, a new member of the trk family of tyrosine protein kinases, is a receptor for neurotrophin-3. Cell. 1991;66:967–979. doi: 10.1016/0092-8674(91)90442-2. [DOI] [PubMed] [Google Scholar]
- Mu X, Silos-Santiago I, Carroll SL, Snider WD. Neurotrophin receptor genes are expressed in distinct patterns in developing dorsal root ganglia. J Neurosci. 1993;13:4029–4041. doi: 10.1523/JNEUROSCI.13-09-04029.1993. [DOI] [PMC free article] [PubMed] [Google Scholar]
- DiStefano PS, Friedman B, Radziejewski C, Alexander C, Boland P, Schick CM, et al. The neurotrophins BDNF, NT-3, and NGF display distinct patterns of retrograde axonal transport in peripheral and central neurons. Neuron. 1992;8:983–993. doi: 10.1016/0896-6273(92)90213-w. [DOI] [PubMed] [Google Scholar]
- Griesbeck O, Parsadanian AS, Sendtner M, Thoenen H. Expression of neurotrophins in skeletal muscle: quantitative comparison and significance for motoneuron survival and maintenance of function. J Neurosci Res. 1995;42:21–33. doi: 10.1002/jnr.490420104. [DOI] [PubMed] [Google Scholar]
- Wang T, Xie K, Lu B. Neurotrophins promote maturation of developing neuromuscular synapses. J Neurosci. 1995;15 7 Pt 1:4796–4805. doi: 10.1523/JNEUROSCI.15-07-04796.1995. [DOI] [PMC free article] [PubMed] [Google Scholar]
- Lohof AM, Ip NY, Poo MM. Potentiation of developing neuromuscular synapses by the neurotrophins NT-3 and BDNF. Nature. 1993;363:350–353. doi: 10.1038/363350a0. [DOI] [PubMed] [Google Scholar]
- Sterne GD, Coulton GR, Brown RA, Green CJ, Terenghi G. Neurotrophin-3-enhanced nerve regeneration selectively improves recovery of muscle fibers expressing myosin heavy chains 2b. J Cell Biol. 1997;139:709–715. doi: 10.1083/jcb.139.3.709. [DOI] [PMC free article] [PubMed] [Google Scholar]
- Chan JR, Cosgaya JM, Wu YJ, Shooter EM. Neurotrophins are key mediators of the myelination program in the peripheral nervous system. Proc Natl Acad Sci USA. 2001;98:14661–14668. doi: 10.1073/pnas.251543398. [DOI] [PMC free article] [PubMed] [Google Scholar]
- Yamauchi J, Chan JR, Shooter EM. Neurotrophins regulate Schwann cell migration by activating divergent signaling pathways dependent on Rho GTPases. Proc Natl Acad Sci USA. 2004;101:8774–8779. doi: 10.1073/pnas.0402795101. [DOI] [PMC free article] [PubMed] [Google Scholar]
- Woolley AG, Tait KJ, Hurren BJ, Fisher L, Sheard PW, Duxson MJ. Developmental loss of NT-3 in vivo results in reduced levels of myelin-specific proteins, a reduced extent of myelination and increased apoptosis of Schwann cells. Glia. 2008;56:306–317. doi: 10.1002/glia.20614. [DOI] [PubMed] [Google Scholar]
- Shield MA, Haugen HS, Clegg CH, Hauschka SD. E-box sites and a proximal regulatory region of the muscle creatine kinase gene differentially regulate expression in diverse skeletal muscles and cardiac muscle of transgenic mice. Mol Cell Biol. 1996;16:5058–5068. doi: 10.1128/mcb.16.9.5058. [DOI] [PMC free article] [PubMed] [Google Scholar]
- Clark KR, Liu X, McGrath JP, Johnson PR. Highly purified recombinant adeno-associated virus vectors are biologically active and free of detectable helper and wild-type viruses. Hum Gene Ther. 1999;10:1031–1039. doi: 10.1089/10430349950018427. [DOI] [PubMed] [Google Scholar]
- Sahenk Z, Mendell JR. Ultrastructural study of zinc pyridinethione-induced peripheral neuropathy. J Neuropathol Exp Neurol. 1979;38:532–550. doi: 10.1097/00005072-197909000-00007. [DOI] [PubMed] [Google Scholar]
- Friede RL, Beuche W. Combined scatter diagrams of sheath thickness and fibre calibre in human sural nerves: changes with age and neuropathy. J Neurol Neurosurg Psychiatr. 1985;48:749–756. doi: 10.1136/jnnp.48.8.749. [DOI] [PMC free article] [PubMed] [Google Scholar]
Associated Data
This section collects any data citations, data availability statements, or supplementary materials included in this article.
Supplementary Materials
Serum levels of NT-3 in TrJ mice at 23 weeks postinjection (shown as individual mice) compared to PBS-treated TrJ controls (numbers 567, 570, 573, and 591) are shown in individual mice.
One micrometer thick, toluidine blue-stained representative cross sections of intact/uncrushed (a,b) and regenerating (c,d) sciatic nerves from TrJ mice injected with PBS (a,c) and AAV1.NT-3 (b,d) at 20 weeks. Thinly myelinated and naked axons are indicated with arrows in PBS-treated intact and regenerating nerves (a,c). AAV1.NT-3 gene therapy results in an increase of axons with thicker myelin (arrows) in intact nerves (b) and an apparent increase in the small myelinated fibers (arrows) in regenerating nerves (d).
Composite histograms showing myelinated fiber distribution in the regenerating (a) and contralateral intact (b) sciatic nerves from TrJ mice at 20 weeks post AAV1.NT-3 gene therapy showing an increase in the subpopulation of axons <4 µm in diameter in AAV1NT3 group compared to PBS-control.
Neurogenic changes in the gastrocnemius muscle from a PBS-treated TrJ (a) showing atrophic angular fibers of either histochemical fiber types (arrows) or fiber type atrophy (asterisk). Reinnervation induced changes (asterisks mark fiber type groupings) at 40 weeks post AAV1.NT-3 gene therapy (b).
Muscle fiber size histograms from tibialis anterior (a) and gastrocnemius (b) muscles at 40 weeks post AAV1.NT-3 gene therapy. Both muscles showed an increase in fiber diameter (c) as histologic evidence of nerve regeneration into the muscle compared to PBS-injected control group.
Representative tracings of sciatic motor nerve conduction from a wild-type and TrJ mouse at baseline and endpoint at 40 weeks postvector injection.
Sciatic nerve electrophysiology in TrJ mice following AAV1. NT-3 gene transfer at 24 weeks.