

Abstract
Intracellular asymmetry in the signaling network works as a compass to navigate eukaryotic chemotaxis in response to guidance cues. Although the compass variable can be derived from a self-organization dynamics, such as excitability, the responsible mechanism remains to be clarified. Here, we analyzed the spatiotemporal dynamics of the phosphatidylinositol 3,4,5-trisphosphate (PtdInsP3) pathway, which is crucial for chemotaxis. We show that spontaneous activation of PtdInsP3-enriched domains is generated by an intrinsic excitable system. Formation of the same signal domain could be triggered by various perturbations, such as short impulse perturbations that triggered the activation of intrinsic dynamics to form signal domains. We also observed the refractory behavior exhibited in typical excitable systems. We show that the chemotactic response of PtdInsP3 involves biasing the spontaneous excitation to orient the activation site toward the chemoattractant. Thus, this biased excitability embodies the compass variable that is responsible for both random cell migration and biased random walk. Our finding may explain how cells achieve high sensitivity to and robust coordination of the downstream activation that allows chemotactic behavior in the noisy environment outside and inside the cells.
Introduction
Directional cell migration in response to external guidance cues, chemotaxis, is crucial for various physiological phenomena, including embryonic development such as organ formation and nerve wiring. Chemotaxis also plays roles in pathological activities such as allergic inflammation and cancer metastasis. Studies using Dictyostelium, the organism best studied for eukaryotic chemotaxis, have shown that chemotactic cells are extremely sensitive to shallow chemoattractant gradients, as cell motility can be biased along spatial gradients by differences in receptor occupancy across the cell body of as few as 10 molecules (1–4). Therefore, cells must achieve high sensitivity to extracellular signals and coordinate their intracellular activity. In response to a chemical gradient, chemotactic cells generate a sharp asymmetry in intracellular activity, which directs cell motility toward or away from the chemical source. This signaling pathway is highly conserved in species from human leukocytes to the social amoebae Dictyostelium discoideum (1,2,5,6). In D. discoideum, several parallel pathways responsible for chemotaxis have been identified (7). Among them, the phosphatidylinositol 3,4,5-trisphosphate (PtdInsP3) pathway plays an indispensable role in gradient sensing under shallow chemoattractant gradients (8,9), whereas in very steep gradients, other pathways can aid in chemotaxis in the absence of the PtdInsP3 pathway (10). There, a chemoattractant gradient induces strong local accumulation of PtdInsP3 on the anterior region, which is steeper than the external gradient (11). This gradient-sensing mechanism works even if cells lack motile activity, as, for example, in the case of actin polymerization. Thus, an intracellular signaling process amplifies the extracellular signal, and this process could be responsible for the high chemotactic sensitivity.
However, sharp asymmetry in the membrane distribution of PtdInsP3 can also be established even in the apparent absence of spatial cues in both Dictyostelium (12–15) and mammalian cells, such as dendritic cells and fibroblasts (16,17). Such spontaneous asymmetry may be responsible for promoting random migration of these cells (12,16). However, little is known about the cell biophysical mechanism that gives rise to intracellular polarity, or how this spontaneous dynamics is related to the gradient-induced asymmetry formation. If the spontaneous dynamics is biased by extracellular cues, the spontaneously produced polarity is strong enough to promote protrusive activity with high sensitivity in response to the cue, even for the shallow gradient.
It has been proposed from a mathematical viewpoint that the sharp response and spontaneous activities of PtdInsP3, including traveling waves and oscillations (12,18,19), can be explained by excitability (20–24). On the other hand, an ultrasensitive amplification mechanism was also proposed (25). Therefore, it is necessary to study directly the PtdInsP3 kinetics that generates the sharp response.
One approach to elucidate intrinsic properties of the system is to apply perturbations, which makes it possible to investigate the transient behavior during the cell’s response and return to the stationary state, rather than the stationary behaviors after completion of the transient response, such as the chemokinetic effect. When the perturbations are sufficiently small in strength or short in duration, such as a step with small amplitude or impulse stimuli, the transient behavior is expected to reflect intrinsic properties of the system itself, which is not disturbed by perturbations. In particular, idealized impulse responses reflect only the time constants of processes in the PtdInsP3 signaling system, not the time constants of the perturbation itself. Therefore, in this study, we considered step and impulse responses of PtdInsP3 and primarily focused on the asymptotic behavior of response statistics approaching spontaneous activity. We demonstrate that spontaneous activation of the localized PtdInsP3-enriched domain in Dictyostelium cells is generated by an excitable system. Once the activation is triggered by an impulse stimulus of cAMP, it proceeds by its intrinsic dynamics, no longer requiring stimuli. We further show that both spontaneous and directional cellular asymmetry formations in the absence and presence, respectively, of chemoattractant gradients are produced by the same mechanism of the chemotaxis pathway. Our results demonstrate that the spontaneous formation of intracellular asymmetry is a basal dynamics of the chemotaxis signaling pathway, and it serves as a compass parameter for chemotaxis that can convey extracellular gradient information (16,26).
Materials and Methods
Cell preparations
To observe the spatiotemporal dynamics of PtdInsP3 under a fluorescent microscope, the green-fluorescent-protein (GFP)-fused pleckstrin homology (PH) domain of Akt/protein kinase B was expressed in wild-type AX-2 cells (12). The cells were grown at 21°C in HL-5 medium and selected with 20 μg/mL G418 (27). Before fluorescent imaging, the cells were starved in development buffer (5 mM Na phosphate buffer, 2 mM MgSO4, and 0.2 mM CaCl2, pH 6.3) for 1 h and pulsed with 10 nM cAMP at 6 min intervals for up to 3.5 h. This process led to a polarized cell shape, which indicates chemotactic competency (28). To observe spontaneous PH-GFP activity, cells were placed in glass-bottomed dishes (IWAKI, Tokyo, Japan) 27 mm in diameter. The number of cells was maintained at <4 × 10³ to ensure that neighboring cells were sufficiently separated (by ∼0.4 mm). Cells were treated with 10 μM latrunculin A (L5163-100UG, Sigma, St. Louis, MO) and incubated in the dishes for 20 min before observation. For cAMP stimulation, cells were placed in microfluidic chambers in the presence of 10 μM latrunculin A and incubated for 20 min.
Microfluidic chamber
We used microfluidic chambers to achieve a spatially uniform temporal change in cAMP concentration, with high temporal resolution and repeatability. Silicon molds were prepared using an SU-8 negative photoresist (SU-8 100, Microchem, Newton, MA). Two-inch silicon wafers were spin-coated with SU-8 (200 μm in thickness), exposed to ultraviolet (UV) light through photomasks, and developed. These were used as the cast for polydimethylsiloxane (PDMS; Sylgard 184, Dow Corning, Midland, MI). The molded pieces of PDMS were covalently adhered to a no. 1 thickness microscope coverglass (NEO 24 × 36 mm, Matsunami, Kobe, Japan) by activating both surfaces with plasma cleaner (PDC-32G, Harrick Plasma, Ithaca, NY).
For the sustained-stimulus experiments, cells were placed in a T-shaped chamber (Fig. S1 A) with two inlets and one outlet. Syringes filled with development buffer containing 10 μM latrunculin A and the specified concentrations of cAMP were mounted in the syringe pumps (Legato 210, KD Scientific, Holliston, MA). The syringes were attached to the inlets to provide a constant influx of the solution. The pumps were controlled by a personal computer (Metamorph, Molecular Devices, Sunnyvale, CA). The flow rate was 10 μL/min.
The transient cAMP stimuli were generated by flow photolysis (29), where 10 nM NPE-caged cAMP (Dojindo, Kumamoto, Japan) was added to the flow solution. The photochemical release of caged cAMP was localized upstream of the cells. The flow carried the activated cAMP to the cells and the solution was then washed out. The cAMP was uncaged with a photoactivation system that is based on digital mirror devices (Mosaic, Andor Technology, Belfast, Northern Ireland) and equipped with a mercury lamp. The light passing through the interference filter had a wavelength of 360–372 nm, which is optimal for the photochemical reaction. The flow rate was 10 μL/min. To demonstrate the temporal change of cAMP concentration, we obtained the fluorescent images of activated CNMB-caged fluorescein (F-7103, Life Technologies, Carlsbad, CA) (Figs. S1 B and S2 B).
Microscopy
The PH-GFP that was expressed in Dictyostelium cells was observed with an inverted fluorescent microscope (IX-81, Olympus, Tokyo, Japan, or Ti-E, Nikon, Tokyo, Japan) equipped with a spinning-disk confocal imaging unit (CSU-X1, Yokogawa, Tokyo, Japan), a 40×/1.35 NA oil plan apochromat objective, and a 488 nm OPS laser for GFP excitation. For 3D time-lapse imaging, we used a piezo-Z stage with a 60×/1.35 NA oil plan apochromat objective. Fluorescent images were acquired by an electron-multiplying charge-coupled device camera (iXon+, Andor Technology, or imagEM, Hamamatsu, Hamamatsu City, Japan) at the specified time intervals. The cAMP gradient was applied using a micropipette (FemtoTips, Eppendorf, Hamburg, Germany) that was filled with 100 nM cAMP and 2 μM Alexa 555 and pressurized at 100 hPa using an injector (FemtoJet, Eppendorf). The formation of the cAMP gradient was confirmed by the spread of the dye. All experiments were conducted at 21°C. Each cell was located >200 μm from the micropipette.
Data analysis
The spatiotemporal dynamics of PtdInsP3 were analyzed from the time course of the fluorescent PH-GFP signal. The fluorescence intensity of PH-GFP on the membrane was obtained every radian along the cell periphery. The fluorescence signals from individual cells were then normalized by the cytosolic fluorescence intensity to exclude the effect of variations in the PH-GFP expression level of individual cells. The cytosolic fluorescence intensity was averaged over the cytosolic region, which was then averaged over time. For the time average, we excluded the time interval during which a PH-GFP-enriched domain was present, as it reduces the cytosolic PH-GFP signal. The normalized fluorescence intensity obtained in this way at position θ and time t is denoted by .
To quantify the domain orientation of the PH-GFP-enriched domain, we calculated the center of brightness along the cell periphery, (P(t), φ(t)), given by
| (1) |
with , i.e., , and , where and (Fig. S3 A). If the signal is homogeneous along the cell periphery without polarity, P(t) is zero in Eq. 1. In most cases, a single domain is formed. Therefore, a nonzero value of P(t) indicates local accumulation of PtdInsP3 at (Fig. S3 B).
As shown in Fig. S3 B, the value of P(t) increases when a PH-GFP-enriched domain is formed. We considered the formation of a PH-GFP-enriched domain as P(t) above the threshold Pc for a given time. In this study, we set Pc to be 0.1. The domains were detected as the region where the normalized fluorescence intensity, , is above the threshold intensity, . The size of a domain is the number of successive points in the domain area. We define the amplitude as the maximum value of the normalized fluorescence intensity, , in the domain area. In this study, was set to be 1.4. We confirmed that the results presented here were insensitive to the value of .
To analyze the PH-GFP translocation to the membrane in response to a temporal change in cAMP concentration, we identified the time to approach the response peak, , from the transient increase in the membrane fluorescence intensity for individual cells. We then collected the values of the cells to characterize the PH-GFP-enriched domains by thresholding.
Results
Spontaneous activity of phosphatidylinositol lipid signaling reaction
To explore the mechanism by which intracellular asymmetry is spontaneously generated, we monitored the spatiotemporal dynamics of PtdInsP3 localization in Dictyostelium cells expressing the GFP-fused pleckstrin homology domain of Akt/protein kinase B (PH-GFP), which acts as a PtdInsP3 probe. We treated the cells with 10 μM latrunculin A (an actin polymerization inhibitor), which made the cell shape spherical and completely inhibited the cell-shape deformation activity (30,31). Even in the absence of a cAMP stimulus, treated cells exhibited an asymmetric distribution of PH-GFP along the membrane (Fig. 1, A and B), with PH-GFP-enriched domains transiently appearing randomly. The peak intensity of PH-GFP in the domains was on average ∼2.3 times larger than the intensity in the cytosol. The lifetime of the domains averaged ∼15 s, and their size was ∼72° (∼0.4π rad). The spatial correlation C(θ) between fluorescence intensities at different positions with an angular distance, θ, decreased from positive to negative values as θ increased (Fig. 1 C; see Materials and Methods), meaning that the observed asymmetric distribution was not a consequence of stochastic PH-GFP accumulation, but rather the result of a localization mechanism.
Figure 1.
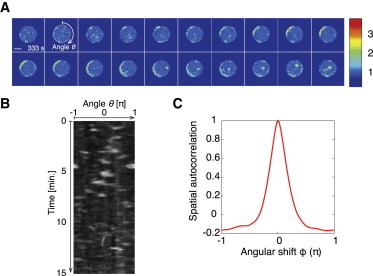
PtdInsP3-enriched domains are spontaneously formed in the absence of external cues. (A) Sequential images taken at 3 s intervals showing PH-GFP-expressing Dictyostelium cells in uniform 1 nM cAMP (Scale bar, 5 μm). The pseudocolor images are shown to aid in visualizing spontaneous domain formation by PH-GFP. (B) Kymograph of the spatiotemporal behavior of the PH-GFP fluorescence intensity on the cell periphery. The images were taken every 3 s. (C) Spatial correlation of the PH-GFP intensity along the membrane as shown in B. The correlation function, C(θ), was calculated as , where is the distribution of PH-GFP along the cell membrane, and . The overline indicates the average over space and time, and .
As shown in Fig. 2, A and B, we observed a variety of PtdInsP3 behaviors of clonal cells under the same experimental conditions, such as a resting state and transient and persistent domain formations. This variability can be attributed to cell-to-cell variations in the concentrations of the molecular components, which is inevitable at the scale of a single cell (25,32). When domains formed transiently, their appearance and disappearance were accompanied by a decrease and increase in the cytosol fluorescence intensity, indicating that the transient appearance of domains was not due to traveling motion of domains across the focal plane. The 3D observation also demonstrated that domains showed no persistent traveling motion in all directions, as shown in Fig. 2 C. When domains formed persistently, they were not stationary, but traveled along the membrane, which is consistent with our earlier finding (12). Furthermore, the behavior also depends on the extracellular cAMP concentration. The transient formation of a PH-GFP-enriched domain was more frequently observed in the presence of a uniform concentration of 1 nM cAMP than in the absence of external cAMP (Fig. 2, A and B), indicating that the chemoattractant enhances asymmetry, although the domain formations have no preferential orientation. Here, the cell density was sufficiently low (the average cell-to-cell distance was ∼400 μm; see Materials and Methods), so that the cell-cell interactions via self-secreted cAMP were negligible, and thus, the domain formations reflected the basal dynamics of the intracellular signaling pathway.
Figure 2.

Dependence of the spontaneous PtdInsP3 dynamics on cAMP concentration. (A) Transient and persistent formation of the PH-GFP-enriched domain in the absence of cAMP and at 1 nM extracellular cAMP. Domains with lifetimes of >5 min were classified as persistent. Kymographs lasted 15 min, and each was taken from a different cell. We did not observe persistent formation of PH-GFP-enriched domains in the absence of extracellular cAMP. (B) Percentages of cells exhibiting spontaneous PH-GFP-enriched domains (n = 30 and 48 cells for 0 M and 1 nM cAMP, respectively). (C) Four-dimensional image of transient domain formation in the absence of cAMP, with x-y sections at the left, showing regions close to the top, middle, and bottom of a single cell, and x-z and y-z sections at the right. All domains appeared and disappeared at the same position without persistent traveling motion. The membrane region attached to the glass surface showed the same behavior. To see this figure in color, go online.
The same PtdInsP3 peak level in both the spontaneous activation and responses for perturbations of different strength
To study the intrinsic properties of the basal dynamics of spontaneous domain formation more systematically, we next used a microfluidic chamber to quantify the initial transient response of the PtdInsP3 pathway to rapid step changes in cAMP concentration. The cAMP concentrations changed within 1 s from 0 M to concentrations ranging from 50 pM to 10 nM (see Fig. S1, A and B). We expected that the transient responses to the small perturbations with lower cAMP concentrations would reflect spontaneous pathway activity in the nonstimulated state. As reported previously (14), the depletion of cytosolic PH-GFP levels peaked at <15 s and returned to the basal level in <30 s (Fig. 3, A and B). The cytosolic responses depended on the stimulus intensity (Fig. 3 C), with the peak response increasing in a dose-dependent manner and saturating at 1 nM. At higher cAMP concentrations (1–10 nM), almost all cells exhibited the cytosolic response, with the membrane translocation of PH-GFP occurring on almost the entire plasma membrane (Fig. 3, D and F, and Fig. S1, C–F). However, when the cytosolic responses reached the peak at ∼15 s, the response amplitude, which is defined by the maximum PH-GFP intensity on the cell membrane, was not dependent on the concentrations, and it was the same as that for spontaneous activation (Fig. 3 H). As the cAMP concentration was decreased to 50–200 pM, the translocation of PH-GFP showed remarkable spatial heterogeneity. PH-GFP transiently accumulated in a spatially localized area to form an enriched domain (Fig. 3, E and G, and Fig. S1, F–H). The domain was positioned randomly on the membrane, independent of the flow direction in the chamber (Fig. S1 I). The frequency of cells that exhibited a detectable cytoplasmic response depended on the concentrations (58% at 50 pM, 69% at 100 pM, and 83% at 200 pM) (25). These transient responses show the same properties with the spontaneous activation, not only in response amplitude but also in spatial size. Thus, as expected, responses to small perturbations approach the behavior of spontaneous transient activation.
Figure 3.
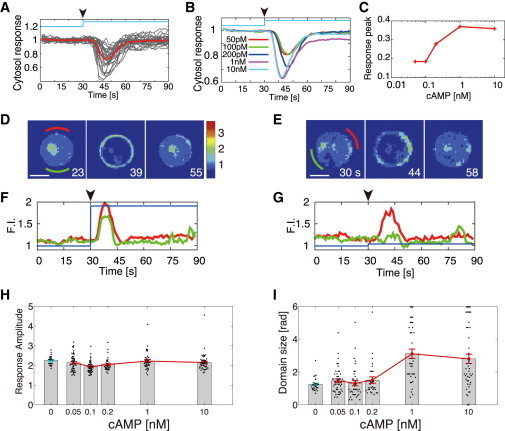
Transient responses of PtdInsP3 to temporal cAMP perturbations. (A and B) Time course of cytosolic responses to step increases in cAMP applied at 30 s (arrowheads). (A) Responses of individual cells to 200 pM cAMP (gray lines) and the ensemble average (red), normalized by the respective intensity before stimulation. (B) Average responses to concentration jumps ranging from 50 pM to 10 nM. (C) Dose dependence of cytosolic PH-GFP responses. (D and E) Images of PH-GFP translocations in response to 10 nM (D) and 200 pM (E) step increases in cAMP (Scale bar, 5 μm). (F and G) Time courses of fluorescence intensity on subregions of the membrane at 10 nM and 200 pM cAMP, respectively. The two time series indicated by red and green lines were obtained at the positions indicated by green and red bars, respectively, in D and E. The fluorescence signals were averaged over π /3 rad. (H and I) Response amplitude (H) and size (I) of the PH-GFP-enriched domains at various cAMP concentrations. The characteristics of the spontaneously formed domain are shown in blue. Error bars denote the mean ± SE. The numbers of cells in each experimental condition were 22 (unstimulated), 47 (50 pM), 38 (100 pM), 29 (200 pM), 37 (1 nM), and 45 (10 nM). The time-lapse images used in this figure were taken at 1 s intervals. For the spontaneously formed domains without stimulus, the average amplitude and domain size of individual cells were obtained by averaging the values at the times they were formed.
From these results, the response amplitude at ∼15 s is almost constant from higher to lower cAMP concentrations, which is extended to the amplitude of the spontaneous activation, indicating that it is almost determined by intrinsic properties of the signaling pathway itself, not by the properties of perturbations. On the contrary, the spatial size depends on the cAMP concentration (Fig. 3 I). Therefore, the dose dependence of the cytosolic response (Fig. 3 C) is a consequence of the increase in spatial size, keeping the response amplitude on the membrane insensitive to the stimulus intensity. Because the size at lower cAMP concentrations from 50 to 200 pM sufficiently approaches the size in the spontaneous activation, there seems to also exist a defined size intrinsic to the reaction-diffusion property of this system.
A possible mechanism that produces both the spontaneous excitation and localized response with almost constant amplitude irrespective of the stimulus strength could be excitability (22–24,33,34). In excitable systems, a perturbation over a certain threshold can trigger a reproducible response. Once the response is initiated, the time evolution is mostly determined by the intrinsic mechanism of the system itself; as a result, it is less sensitive to perturbation strength. The stochastic fluctuations that are present in the signaling processes produce spatiotemporal variations in the concentration of signaling molecules, which can then trigger excitation and make the response heterogeneous. If this is the case in the PtdInsP3 pathway, weak cAMP perturbations induce a transient response only in a restricted membrane area, which can be observed as a localized PH-GFP-enriched domain similar to the spontaneously formed domain. In contrast, when the perturbations are sufficiently strong, almost the entire membrane area is above the threshold level, resulting in a transient response throughout the cell. Thus, the size of the response area should increase with stimulus intensity, whereas the amplitude of the response in each area should be the same across stimulus intensities. These predictions are consistent with our observations of the PtdInsP3 pathway in Dictyostelium cells, implying that the spontaneous dynamics of the PtdInsP3 pathway is consistently produced by an excitable mechanism. Experimental confirmation of the existence of an excitable system is discussed below.
PtdInsP3 responses are invoked by an excitable mechanism
If the PtdInsP3 pathway works as an excitable system, then once the response is initiated at a given region on the membrane, it could be fully activated without sustained stimulation. We expect that an impulse stimulus can induce the same PtdInsP3-enriched domain that is produced spontaneously. To test this hypothesis, we applied a transient cAMP stimulus that was much shorter than the characteristic response time (35). Impulse stimuli were generated by the photochemical release of caged cAMP in a flow chamber (29). The UV flush for the uncaging reaction was applied to a region upstream of the cells in a continuous flow, leading to transient exposure of the cells to cAMP within 1 s (Fig. S2, A and B). We studied the responses to different UV exposure times of 300 ms, 1 s, and 2 s. When UV light was applied for 300 ms, the resulting PH-GFP-enriched domain persisted for ∼10 s, with a rise time of 6 s (Fig. 4, A and B, and Fig. S2, C–E). Because the rise time is much longer than the stimulus duration, the subsequent excitation is produced by its own intrinsic mechanism once activation is initiated by the transient stimulus, as is expected in excitable systems. Consistent with this excitable-mechanism hypothesis, the response amplitude for all three exposure times was approximately the same as that of both domains formed spontaneously and induced by step cAMP stimulus (Figs. 4 C and 3 H, respectively). The average spatial size decreased with exposure time, approaching that of the spontaneously formed domains (Fig. 4, C and D), which indicates that the longer the cells are exposed to the cAMP stimulus, the larger is the area of PtdInsP3 activation on the membrane.
Figure 4.
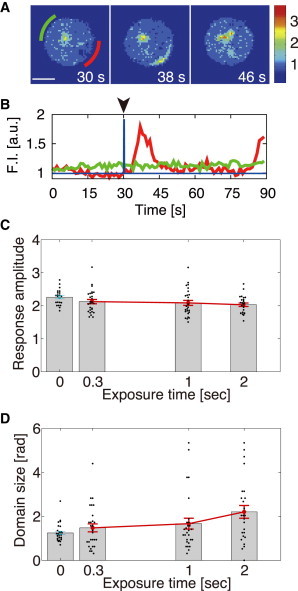
Fully activated PtdInsP3 response to very short cAMP stimuli. (A) Images of PH-GFP-enriched domains induced by transient cAMP stimulation (Scale bar, 5 μm). (B) Time course for PH-GFP translocation to the subregions. The two time series indicated by the red and green lines were obtained at the positions indicated by green and red bars, respectively, in A. (C and D) Response amplitude (C) and domain size (D) are shown as functions of UV exposure time for 0.3, 1, and 2 s UV exposure times (N = 28, 28, and 25 cells, respectively). Blue solid circles represent the corresponding values for the spontaneously formed domain. Error bars denote the mean ± SE. The time-lapse images used in this figure were taken at 1 s intervals. For the spontaneously formed domains without stimulus, the average amplitude and domain size of individual cells were obtained by averaging the values at the times they were formed. The UV light was directed onto a 10 μm × 100 μm rectangular region, with the rectangle aligned such that the long axis traversed the flow.
We further hypothesized that if the PtdInsP3 response is consistent with an excitable system, just after the membrane PtdInsP3 level is decreased to the basal level, there will be a refractory period during which the cell cannot elicit PtdInsP3 activation by a subsequent stimulus (34). We tested this hypothesis by measuring the cytosolic PH-GFP depletion in response to repeated cAMP perturbations with three identical 1 s pulses given at a defined time interval. The cells exhibited almost identical responses for stimuli given at 50 s intervals, with a peak response amplitude equal to that for each of the successive cAMP pulses (Fig. 5, A and B). As the interpulse intervals decreased, the first response remained identical, but subsequent responses were attenuated and finally became hard to detect at 10 s intervals (Fig. 5, B, C, and E). Notably, although the cytosolic responses were interval-dependent, the response amplitude on the membrane was insensitive to both the number of pulses and the interpulse interval (Fig. 5 D). On the other hand, the spatial size was dependent on the cAMP pulse intervals and decreased with the number of pulses (Fig. 5 E). These characteristics of the membrane response are consistent with the step and impulse responses, indicating that the response, once initiated, is produced by an intrinsic excitable mechanism. Furthermore, the cells take ∼30 s to be ready for a subsequent response. This refractory behavior demonstrates that the PtdIns lipid pathway is an excitable system.
Figure 5.
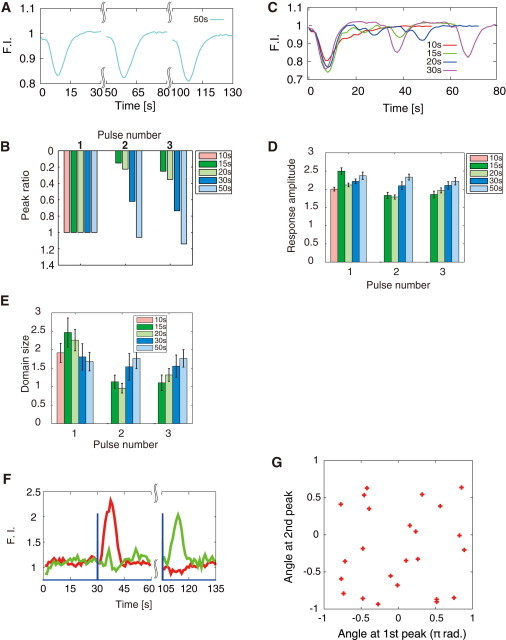
Refractory behavior of the PtdIns reaction for repeated perturbations. (A and C) Cytosolic PH-GFP depletion upon applying triplet cAMP pulses at given time intervals of 10, 15, 20, 30, and 50 s (N = 34, 24, 34, 19, and 27 cells, respectively). (B) Normalized peak of the cytosolic responses. (D and E) Response amplitude (D) and spatial size (E) of the PtdInsP3-enriched domains for each of three cAMP pulses at different time intervals. (F) PH-GFP translocations at distinct regions on the membrane in response to 75 s paired cAMP pulses are shown. (G) Polarity orientations for the first and second response peaks of individual cells. The cAMP pulses were generated using the same method in Fig. 4. For the triple-pulse experiments shown in C-D, the UV light exposure region was increased to 30 μm × 100 μm to increase the membrane area exhibiting PH-GFP translocation.
We next stimulated a cell with identical paired pulses at 75 s intervals (Fig. 5 F, blue), exceeding the refractory period. A PH-GFP response was observed in one half of the membrane in response to the first pulse (Figs. 5 F, red, and S2, G, I, and J), whereas it was observed in the other half for the second pulse (Figs. 5 F, green, and S2, H–J). We found that the positions of the domains excited by the successive cAMP pulses were statistically uncorrelated with each other (Fig. 5 G), indicating that the spatially localized response does not result from any static inhomogeneity in the extracellular environment or any preexisting heterogeneity within the cells, nor is there a long-term memory of the previous response. It is likely, then, that the stochastic properties of molecular processes within the cells dynamically determine the position of the excitation by chance.
Spontaneous PtdInsP3 responses are biased toward the chemoattractant gradient
We have so far investigated the transient behavior of PtdInsP3 membrane localization both in spontaneous activation and in response to spatially uniform cAMP perturbations, in which a nonlinear excitable dynamics operates. It is well documented that the presence of a spatial gradient of cAMP can induce asymmetric translocation of PH-GFP to the plasma membrane facing the cAMP source (11,30,36). Because the same signaling system is involved not only in spontaneous asymmetric formation but also in the formation of gradient-induced asymmetry, the question as to whether these two activities are interdependent naturally arises. From a theoretical viewpoint, when an excitable system is biased by spatial gradients, it is quite natural that the location of excitation and formation of the same signaling domains are preferentially oriented in the direction of the gradient. We also expect the response amplitude to be almost unchanged after application of shallow gradients, if the same excitable system also works for gradient sensing. Therefore, the excitable system can sense gradients by biasing the probability of the domain position toward the gradient direction without much modulation of the property of the activator domain itself.
To test the biased-excitation hypothesis, we analyzed the PH-GFP-enriched domains in response to the spatial gradient of cAMP. We applied a cAMP gradient to the cell that showed spontaneous formation of PH-GFP-enriched domain before the gradient was applied (Fig. 6 A). In the absence of cAMP gradient, the PH-GFP-enriched domains formed at random positions (Fig.6, A upper and B). When the gradient was applied, the PH-GFP domains preferentially formed at the side facing the higher cAMP concentration (Fig. 6, A lower, arrowhead, and B). The orientation of the PH-GFP-enriched domain indicates that the spatial gradient of cAMP regulates PtdInsP3 localization. The formation of PH-GFP-enriched domains was more evident when a cAMP gradient was applied than when cAMP was not present. Nevertheless, the amplitudes were maintained in individual cells at an almost identical level before and after gradient stimulation. We found a proportional relationship between peak amplitude in the spontaneously formed PH-GFP-enriched domain before the stimulus and the amplitude in response to a gradient in the same cells (Fig. 6 C). The peak amplitudes of the PH-GFP-enriched domain varied even among the population of clonal cells, probably due to intrinsic heterogeneity in the molecular components (25). Thus, as predicted, the spatial gradient of cAMP does not modulate strongly the property of the PtdInsP3-enriched domain. Properties of the domain such as peak intensity are mostly intrinsic to the excitable dynamics. The external stimulus of a cAMP spatial gradient biases the position of PtdInsP3 activation. Our experimental result indicates that the underlying mechanism in chemotactic signaling is biased excitation, which generates a digitized signaling domain directed toward external cues (Fig. 6 D).
Figure 6.
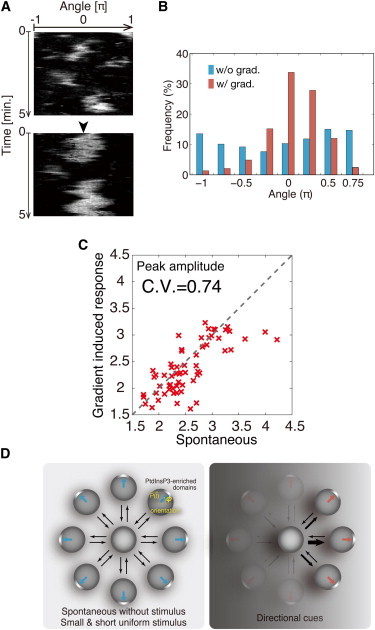
Effects of cAMP gradients on PtdInsP3-enriched domain behavior. (A) Kymographs of PH-GFP for the same cell in the absence (upper) and presence (lower) of a cAMP gradient. cAMP gradients were applied by a pipette containing 100 nM cAMP that was positioned >100 μm away from the cells at θ = 0 (arrowhead). (B) Correlation between the amplitudes for the spontaneously formed and cAMP-gradient-induced domains (N = 65 cells). (C) Distribution of the domain formation site in both the absence (blue) and presence (red) of the cAMP spatial gradient. (B and C) Domains were detected by the thresholding described in Materials and Methods. The values of ϕ were calculated when the domains were formed using Eq. 1. All values of ϕ from each cell (N = 65 cells) were gathered to obtain the distribution. The data in the first minute were removed to exclude any effects of the transient responses to the gradient stimuli. (D) Schematic of the biased-excitability model, showing how the excitable system produces PtdInsP3-enriched domains in the absence of external cues (left) and how the excitable activity biased by external cues causes the domains to be oriented (right).
Discussion
In this article, we studied the PtdIns signaling system, because it is the most well studied pathway in eukaryotic chemoataxis with respect to both molecular biology and quantitative measurements. Recently, several parallel pathways for chemotaxis have been identified, including the PtdIns, TorC2, PLA2, and cGMP pathways (37). The PtdIns pathway contributes to chemotaxis particularly under shallow gradients, whereas it is dispensable under steep gradients (7–9). Because we consider that the excitable behavior discussed in this article can be produced by the PtdIns signaling system, as has been predicted theoretically by others (12,22,23,38), the property may be important particularly for shallow gradients.
In a previous work, Van Haastert and colleagues reported PtdInsP3-enriched domain formation (which they called patches) after the completion of the transient response. They showed that the intensity of the domains was insensitive to cAMP concentration, but that the probability of formation depended on concentration (8,14). The half-maximal concentration was reported to be 0.5 nM, similar to the values presented here (Fig. 3, C and I). In agreement with the results of those studies, we consider that the intrinsic excitable mechanism, which produces the initial PtdInsP3 response ∼5–20 s after cAMP application, also works for domain formation at steady-state conditions including uniform cAMP with a dose-dependent chemokinetic effect. In fact, we observed that the steady-state behavior depends statistically on cAMP concentration (Fig. 2, A and B). Theoretically, cAMP may reduce the threshold value for excitation, or it may affect the upstream processes that regulate the PtdInsP3 level by increasing the amplitude of their temporal stochastic variations.
Our results are consistent with the idea that PtdInsP3 plays a role in chemotaxis and spontaneous symmetry breaking (14,16,26). In this article, we further showed that intrinsic excitability is a prerequisite for generating the asymmetric distribution of signaling molecules that gives rises to the interdependence of intrinsic activity and response to a gradient. Thus, the PtdInsP3-enriched domain can be a compass parameter capable of biased random walk (16,26). The excitability-based mechanism is also capable of generating spatiotemporal complex signals such as traveling waves and oscillations, as observed in Dictyostelium and motile immune cells (see below) (12,16,18,19,21,23). Such excitable mechanisms of chemotaxis may be shared by other eukaryotic cells, such as leukocytes, dendritic cells, and fibroblasts (16,19).
We observed qualitatively different PtdInsP3 dynamics: a resting state, transient PtdInsP3-enriched domains, and persistently formed domains (Fig. 2, A and B). The persistently formed domains were not stationary but traveled along the membrane, which is consistent with our earlier finding (12). Theoretical studies of transient domain formation in excitable systems have been undertaken by Shibata et al. (23) and Hecht et al. (24). Previously, we showed that the traveling wave of PtdInsP3-enriched domains is produced by a limit-cycle oscillation of the PtdInsP3 pathway, which was prominent in the presence of caffeine (12,23). Moreover, the frequency of these qualitatively different behaviors in the population showed a dependence on the extracellular cAMP concentration (Fig. 2, A and B) (23), suggesting that the concentration of extracellular cAMP may be a parameter that controls the behavior of spontaneous PtdInsP3 activity. The appearance of these qualitatively different behaviors depending on parameter values is a characteristic of nonlinear dynamical systems, including excitable systems. These observed properties of nonlinear dynamical systems cannot be explained by the feed-forward type amplification mechanism with ultrasensitivity proposed previously (25).
In the study by Wang et al. mentioned above (25), it was reported that the peak amplitude in the membrane PtdInsP3 response was almost independent of stimulus intensity, in agreement with our result. Those authors also reported that the response to a square-wave stimulus indicates that a >1 min interval was necessary for response recovery (25). This result is roughly consistent with our result of the repeated 1 s impulse perturbations, in which ∼50 s was necessary for response recovery. To explain these behaviors, Levchenko and colleagues (25) proposed a feed-forward type adaptation scheme followed by an additional ultrasensitive amplification reaction. Since the defined response with a constant peak height is not achieved by such feed-forward type adaptation reaction, it requires an amplification module with a quite high Hill coefficient. The refractory behavior shown in Fig. 5, B and C, is also difficult to explain using the model proposed by Wang et al. (25). In contrast, excitable systems have a refractory phase before the system returns to the resting state. The decrease in the sensitivity to stimulus is thus a qualitative characteristic and therefore a robust property. In the previous report (25), the cell response showed a bimodal distribution with responder and nonresponder cells. It was concluded that such heterogeneity results in the dose dependence of the response in the population. Consistent with that report, we also found that the frequency of cells that exhibited a detectable cytoplasmic response was dependent on cAMP concentration, in particular for lower cAMP concentrations. In this study, we excluded from the dose-dependent cytoplasmic response amplitudes (Fig. 3 C) cells that showed no detectable responses. Thus, our result (Fig. 3 C) is a consequence of the dose-dependent change in domain size (Fig. 3 I).
What is the biochemistry that is responsible for the excitable mechanism? The upstream activator of phosphoinositide 3-kinase (PI3K), Ras, could be involved in the excitable behavior, providing a positive feedback effect. However, evidence from the recent literature suggests that Ras shows an adaptive response to a sustained cAMP stimulus, which is generated by an incoherent feed-forward circuit of RasGEF and RasGAP (39). For unstimulated cells, Ras activation at the membrane is ceased. Upon cAMP stimulation, Ras activation occurs not at a local region of the plasma membrane, but on the entire plasma membrane (39). Another, more recent study showed that Ras activation in response to cAMP gradients was dose-dependent (40). Those characteristics are clearly distinguishable from the behaviors shown in this article, which may suggest that other molecular interactions downstream of Ras need to be identified to reveal the biochemistry of the excitable behavior. The molecular mechanism responsible for the refractory behavior is another intriguing question for future studies. We also note that the combination of the adaptation kinetics and the amplification based on the excitable mechanism could be a design principle of the eukaryotic chemotaxis pathway, as has been proposed (7,22).
A feedback loop of PI3K through F-actin has been proposed (15,18,38,41). When cells were treated with reduced concentrations of latrunculin A, they showed protrusive activity, indicating F-actin polymerization (Fig. 7, A–D). In these cells, the spontaneous formation of PtdInsP3-enriched domains occurred at the membrane region with deformation, and the domains were more persistent in lifetime and/or position, suggesting a feedback effect mediated by F-actin (Fig. 7, E and F). Moreover, the domains showed the characteristic behaviors of excitable systems, such as propagation, annihilations when they collided, and oscillatory behaviors, which is consistent with previous reports (18,38). This further supports the presence of underlying excitable dynamics in the PtdIns signaling. The peak intensity of PtdInsP3 in the domain was intrinsically determined, and was found not to be dependent on the cAMP stimulus intensity (Figs. 3 H and 4 C). On the contrary, the peak intensity in the deformed cells was increased, suggesting that the intrinsic dynamical system of PtdIns signaling is modulated by F-actin-mediated feedback (Fig. 7 E). This is also indicated by an increase in the lifetime of PtdInsP3-enriched domains due to the longer characteristic time of the feedback. As shown in Fig. 7, A–D, the position of the domain was stabilized. This suggests that the actin may be responsible for stabilization, which may lead to persistence of the cell motility, as discussed recently (42). An important motivation for future study is to reveal the characteristics of this feedback, which may elucidate the underlying dynamics of spontaneous cell migration. Previously, it was reported that the cell morphology dynamics shows wavelike behaviors (43) (for a theoretical study, see also Meinhardt (20)). Although it is certainly beyond the scope of this study, how the self-organization of signaling reaction can give rise to such cell-shape dynamics is also an intriguing question.
Figure 7.
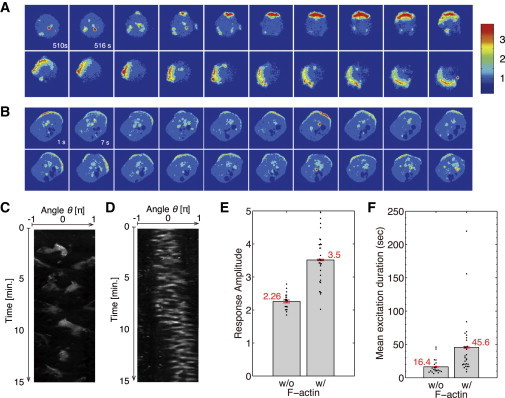
Effect of F-actin on the PtdIns signaling reaction. The concentration of latrunculin A was reduced to 0.6–1 μM. Cells showed protrusive activity without locomotion. (A and B) Sequential images at 6 s intervals showing PH-GFP-expressing Dictyostelium cells at uniform 1 nM cAMP concentration. (C and D) Kymographs of the spatiotemporal behavior of the PH-GFP fluorescence intensity on the cell periphery, corresponding to A and B, respectively. Images were taken every 3 s. latrunculin A concentrations were 0.8 μM (A and C) and 0.6 μM (B and D). (E and F) Average peak amplitude (E) and average lifetime (F) of spontaneously formed domains on individual cells with 10 μM latrunculin A (left) and 0.8–1 μM latrunculin A (N = 30 cells) (right). Error bars denote the mean ± SE. Average peak amplitudes were 2.26 and 3.5, respectively, and average lifetimes were 16.4 and 45.6 s, respectively.
The pulse-like behaviors triggered by a similar mechanism are generally found in a variety of cellular processes, such as neuronal information processes (44,45), DNA repair (35), cell fate decisions (46,47), and stress response (48). In some of these systems, the excitable mechanisms work for the pulse-like behaviors, which allow cells to convert faint signals into decisive all-or-none outputs and provide a way to encode extracellular signals. Therefore, it would be interesting to see whether or not the strength of the chemotactic signal is also encoded in the frequency of the signaling-domain formation.
Conclusion
Our study shows that the spontaneous dynamics of the chemotaxis signaling pathway is driven by an excitability-based mechanism, which can self-organize signals for motile activities even in the absence of external guidance cues. However, these signals occur in random orientations. A stimulus of 200 pM cAMP was sufficient to induce the response (Fig. 2) for most of the cell, suggesting that a very low number of cAMP molecules can induce excitation of PtdInsP3. The full response can also be induced by short stimuli of 300 ms, much shorter than the characteristic time of a PtdInsP3 response. These responses are indistinguishable from the spontaneous dynamics of PtdInsP3. The response is sensitively initiated by such weak signals, and the emerging response is less sensitive to the perturbation properties. Therefore, external guidance cues can be sufficient to provide only directional signals that spatially bias the orientation of the domain formation, without modulating the domain characteristics (Fig. 6 D). This excitation with specific response amplitude can induce coordinated activation of the downstream reactions, irrespective of the input signal. Thus, biased excitability is the basis for high sensitivity with robust coordination of intracellular activities.
Acknowledgments
We are grateful to Y. Sasai for microscopy, and to R. G. Yamada and H. R. Ueda for microfluidic devices. We thank P. A. Iglesias for advice and suggestions on the manuscript.
Footnotes
Masatoshi Nishikawa’s present address is: Max Planck Institute of Molecular Cell Biology and Genetics (MPI-CBG), 01307 Dresden, Germany
This is an Open Access article distributed under the terms of the Creative Commons-Attribution Noncommercial License (http://creativecommons.org/licenses/by-nc/2.0/), which permits unrestricted noncommercial use, distribution, and reproduction in any medium, provided the original work is properly cited.
Contributor Information
Masatoshi Nishikawa, Email: masnishi@mpi-cbg.de.
Tatsuo Shibata, Email: tatsuoshibata@cdb.riken.jp.
Supporting Material
References
- 1.Fisher P.R., Merkl R., Gerisch G. Quantitative analysis of cell motility and chemotaxis in Dictyostelium discoideum by using an image processing system and a novel chemotaxis chamber providing stationary chemical gradients. J. Cell Biol. 1989;108:973–984. doi: 10.1083/jcb.108.3.973. [DOI] [PMC free article] [PubMed] [Google Scholar]
- 2.Ueda M., Shibata T. Stochastic signal processing and transduction in chemotactic response of eukaryotic cells. Biophys. J. 2007;93:11–20. doi: 10.1529/biophysj.106.100263. [DOI] [PMC free article] [PubMed] [Google Scholar]
- 3.Song L., Nadkarni S.M., Bodenschatz E. Dictyostelium discoideum chemotaxis: threshold for directed motion. Eur. J. Cell Biol. 2006;85:981–989. doi: 10.1016/j.ejcb.2006.01.012. [DOI] [PubMed] [Google Scholar]
- 4.Fuller D., Chen W., Loomis W.F. External and internal constraints on eukaryotic chemotaxis. Proc. Natl. Acad. Sci. USA. 2010;107:9656–9659. doi: 10.1073/pnas.0911178107. [DOI] [PMC free article] [PubMed] [Google Scholar]
- 5.Wang F. The signaling mechanisms underlying cell polarity and chemotaxis. Cold Spring Harb. Perspect. Biol. 2009;1:a002980. doi: 10.1101/cshperspect.a002980. [DOI] [PMC free article] [PubMed] [Google Scholar]
- 6.Stephens L., Milne L., Hawkins P. Moving towards a better understanding of chemotaxis. Curr. Biol. 2008;18:R485–R494. doi: 10.1016/j.cub.2008.04.048. [DOI] [PubMed] [Google Scholar]
- 7.Kortholt A., Kataria R., Van Haastert P.J. Dictyostelium chemotaxis: essential Ras activation and accessory signalling pathways for amplification. EMBO Rep. 2011;12:1273–1279. doi: 10.1038/embor.2011.210. [DOI] [PMC free article] [PubMed] [Google Scholar]
- 8.Bosgraaf L., Keizer-Gunnink I., Van Haastert P.J. PI3-kinase signaling contributes to orientation in shallow gradients and enhances speed in steep chemoattractant gradients. J. Cell Sci. 2008;121:3589–3597. doi: 10.1242/jcs.031781. [DOI] [PubMed] [Google Scholar]
- 9.van Haastert P.J., Keizer-Gunnink I., Kortholt A. Essential role of PI3-kinase and phospholipase A2 in Dictyostelium discoideum chemotaxis. J. Cell Biol. 2007;177:809–816. doi: 10.1083/jcb.200701134. [DOI] [PMC free article] [PubMed] [Google Scholar]
- 10.Hoeller O., Kay R.R. Chemotaxis in the absence of PIP3 gradients. Curr. Biol. 2007;17:813–817. doi: 10.1016/j.cub.2007.04.004. [DOI] [PubMed] [Google Scholar]
- 11.Janetopoulos C., Ma L., Iglesias P.A. Chemoattractant-induced phosphatidylinositol 3,4,5-trisphosphate accumulation is spatially amplified and adapts, independent of the actin cytoskeleton. Proc. Natl. Acad. Sci. USA. 2004;101:8951–8956. doi: 10.1073/pnas.0402152101. [DOI] [PMC free article] [PubMed] [Google Scholar]
- 12.Arai Y., Shibata T., Ueda M. Self-organization of the phosphatidylinositol lipids signaling system for random cell migration. Proc. Natl. Acad. Sci. USA. 2010;107:12399–12404. doi: 10.1073/pnas.0908278107. [DOI] [PMC free article] [PubMed] [Google Scholar]
- 13.Postma M., Roelofs J., Van Haastert P.J. Uniform cAMP stimulation of Dictyostelium cells induces localized patches of signal transduction and pseudopodia. Mol. Biol. Cell. 2003;14:5019–5027. doi: 10.1091/mbc.E03-08-0566. [DOI] [PMC free article] [PubMed] [Google Scholar]
- 14.Postma M., Roelofs J., Van Haastert P.J. Sensitization of Dictyostelium chemotaxis by phosphoinositide-3-kinase-mediated self-organizing signalling patches. J. Cell Sci. 2004;117:2925–2935. doi: 10.1242/jcs.01143. [DOI] [PubMed] [Google Scholar]
- 15.Sasaki A.T., Janetopoulos C., Firtel R.A. G protein-independent Ras/PI3K/F-actin circuit regulates basic cell motility. J. Cell Biol. 2007;178:185–191. doi: 10.1083/jcb.200611138. [DOI] [PMC free article] [PubMed] [Google Scholar]
- 16.Arrieumerlou C., Meyer T. A local coupling model and compass parameter for eukaryotic chemotaxis. Dev. Cell. 2005;8:215–227. doi: 10.1016/j.devcel.2004.12.007. [DOI] [PubMed] [Google Scholar]
- 17.Weiger M.C., Wang C.C., Haugh J.M. Spontaneous phosphoinositide 3-kinase signaling dynamics drive spreading and random migration of fibroblasts. J. Cell Sci. 2009;122:313–323. doi: 10.1242/jcs.037564. [DOI] [PMC free article] [PubMed] [Google Scholar]
- 18.Gerisch G., Ecke M., Schroth-Diez B. Different modes of state transitions determine pattern in the phosphatidylinositide-actin system. BMC Cell Biol. 2011;12:42. doi: 10.1186/1471-2121-12-42. [DOI] [PMC free article] [PubMed] [Google Scholar]
- 19.Weiner O.D., Marganski W.A., Kirschner M.W. An actin-based wave generator organizes cell motility. PLoS Biol. 2007;5:e221. doi: 10.1371/journal.pbio.0050221. [DOI] [PMC free article] [PubMed] [Google Scholar]
- 20.Meinhardt H. Orientation of chemotactic cells and growth cones: models and mechanisms. J. Cell Sci. 1999;112:2867–2874. doi: 10.1242/jcs.112.17.2867. [DOI] [PubMed] [Google Scholar]
- 21.Vicker M.G. Reaction-diffusion waves of actin filament polymerization/depolymerization in Dictyostelium pseudopodium extension and cell locomotion. Biophys. Chem. 2000;84:87–98. doi: 10.1016/s0301-4622(99)00146-5. [DOI] [PubMed] [Google Scholar]
- 22.Xiong Y., Huang C.-H., Devreotes P.N. Cells navigate with a local-excitation, global-inhibition-biased excitable network. Proc. Natl. Acad. Sci. USA. 2010;107:17079–17086. doi: 10.1073/pnas.1011271107. [DOI] [PMC free article] [PubMed] [Google Scholar]
- 23.Shibata T., Nishikawa M., Ueda M. Modeling the self-organized phosphatidylinositol lipid signaling system in chemotactic cells using quantitative image analysis. J. Cell Sci. 2012;125:5138–5150. doi: 10.1242/jcs.108373. [DOI] [PubMed] [Google Scholar]
- 24.Hecht I., Kessler D.A., Levine H. Transient localized patterns in noise-driven reaction-diffusion systems. Phys. Rev. Lett. 2010;104:158301. doi: 10.1103/PhysRevLett.104.158301. [DOI] [PMC free article] [PubMed] [Google Scholar]
- 25.Wang C.J., Bergmann A., Levchenko A. Diverse sensitivity thresholds in dynamic signaling responses by social amoebae. Sci. Signal. 2012;5:ra17. doi: 10.1126/scisignal.2002449. [DOI] [PMC free article] [PubMed] [Google Scholar]
- 26.Bourne H.R., Weiner O. A chemical compass. Nature. 2002;419:21. doi: 10.1038/419021a. [DOI] [PubMed] [Google Scholar]
- 27.Watts D.J., Ashworth J.M. Growth of myxameobae of the cellular slime mould Dictyostelium discoideum in axenic culture. Biochem. J. 1970;119:171–174. doi: 10.1042/bj1190171. [DOI] [PMC free article] [PubMed] [Google Scholar]
- 28.Sato M.J., Ueda M., Ueda M. Input-output relationship in galvanotactic response of Dictyostelium cells. Biosystems. 2007;88:261–272. doi: 10.1016/j.biosystems.2006.06.008. [DOI] [PubMed] [Google Scholar]
- 29.Beta C., Wyatt D., Bodenschatz E. Flow photolysis for spatiotemporal stimulation of single cells. Anal. Chem. 2007;79:3940–3944. doi: 10.1021/ac070033y. [DOI] [PubMed] [Google Scholar]
- 30.Xu X., Meier-Schellersheim M., Jin T. Quantitative imaging of single live cells reveals spatiotemporal dynamics of multistep signaling events of chemoattractant gradient sensing in Dictyostelium. Mol. Biol. Cell. 2005;16:676–688. doi: 10.1091/mbc.E04-07-0544. [DOI] [PMC free article] [PubMed] [Google Scholar]
- 31.Xu X., Meier-Schellersheim M., Jin T. Locally controlled inhibitory mechanisms are involved in eukaryotic GPCR-mediated chemosensing. J. Cell Biol. 2007;178:141–153. doi: 10.1083/jcb.200611096. [DOI] [PMC free article] [PubMed] [Google Scholar]
- 32.Samadani A., Mettetal J., van Oudenaarden A. Cellular asymmetry and individuality in directional sensing. Proc. Natl. Acad. Sci. USA. 2006;103:11549–11554. doi: 10.1073/pnas.0601909103. [DOI] [PMC free article] [PubMed] [Google Scholar]
- 33.Hodgkin A.L., Huxley A.F. A quantitative description of membrane current and its application to conduction and excitation in nerve. J. Physiol. 1952;117:500–544. doi: 10.1113/jphysiol.1952.sp004764. [DOI] [PMC free article] [PubMed] [Google Scholar]
- 34.Izhikevich E.M. MIT Press; Cambridge, MA: 2010. Dynamical Systems in Neuroscience. [Google Scholar]
- 35.Loewer A., Batchelor E., Lahav G. Basal dynamics of p53 reveal transcriptionally attenuated pulses in cycling cells. Cell. 2010;142:89–100. doi: 10.1016/j.cell.2010.05.031. [DOI] [PMC free article] [PubMed] [Google Scholar]
- 36.Parent C.A., Blacklock B.J., Devreotes P.N. G protein signaling events are activated at the leading edge of chemotactic cells. Cell. 1998;95:81–91. doi: 10.1016/s0092-8674(00)81784-5. [DOI] [PubMed] [Google Scholar]
- 37.Swaney K.F., Huang C.H., Devreotes P.N. Eukaryotic chemotaxis: a network of signaling pathways controls motility, directional sensing, and polarity. Annu. Rev. Biophys. 2010;39:265–289. doi: 10.1146/annurev.biophys.093008.131228. [DOI] [PMC free article] [PubMed] [Google Scholar]
- 38.Taniguchi D., Ishihara S., Sawai S. Phase geometries of two-dimensional excitable waves govern self-organized morphodynamics of amoeboid cells. Proc. Natl. Acad. Sci. USA. 2013;110:5016–5021. doi: 10.1073/pnas.1218025110. [DOI] [PMC free article] [PubMed] [Google Scholar]
- 39.Takeda K., Shao D., Firtel R.A. Incoherent feedforward control governs adaptation of activated ras in a eukaryotic chemotaxis pathway. Sci. Signal. 2012;5:ra2. doi: 10.1126/scisignal.2002413. [DOI] [PMC free article] [PubMed] [Google Scholar]
- 40.Kataria R., Xu X., Kortholt A. Dictyostelium Ric8 is a nonreceptor guanine exchange factor for heterotrimeric G proteins and is important for development and chemotaxis. Proc. Natl. Acad. Sci. USA. 2013;110:6424–6429. doi: 10.1073/pnas.1301851110. [DOI] [PMC free article] [PubMed] [Google Scholar]
- 41.Janetopoulos C., Firtel R.A. Directional sensing during chemotaxis. FEBS Lett. 2008;582:2075–2085. doi: 10.1016/j.febslet.2008.04.035. [DOI] [PMC free article] [PubMed] [Google Scholar]
- 42.Shi C., Huang C.-H., Iglesias P.A. Interaction of motility, directional sensing, and polarity modules recreates the behaviors of chemotaxing cells. PLOS Comput. Biol. 2013;9:e1003122. doi: 10.1371/journal.pcbi.1003122. [DOI] [PMC free article] [PubMed] [Google Scholar]
- 43.Killich T., Plath P.J., Vicker M.G. The locomotion, shape and pseudopodial dynamics of unstimulated Dictyostelium cells are not random. J. Cell Sci. 1993;106:1005–1013. doi: 10.1242/jcs.106.4.1005. [DOI] [PubMed] [Google Scholar]
- 44.Krahe R., Gabbiani F. Burst firing in sensory systems. Nat. Rev. Neurosci. 2004;5:13–23. doi: 10.1038/nrn1296. [DOI] [PubMed] [Google Scholar]
- 45.Tiesinga P., Fellous J.-M., Sejnowski T.J. Regulation of spike timing in visual cortical circuits. Nat. Rev. Neurosci. 2008;9:97–107. doi: 10.1038/nrn2315. [DOI] [PMC free article] [PubMed] [Google Scholar]
- 46.Süel G.M., Garcia-Ojalvo J., Elowitz M.B. An excitable gene regulatory circuit induces transient cellular differentiation. Nature. 2006;440:545–550. doi: 10.1038/nature04588. [DOI] [PubMed] [Google Scholar]
- 47.Kalmar T., Lim C., Martinez Arias A. Regulated fluctuations in nanog expression mediate cell fate decisions in embryonic stem cells. PLoS Biol. 2009;7:e1000149. doi: 10.1371/journal.pbio.1000149. [DOI] [PMC free article] [PubMed] [Google Scholar]
- 48.Cai L., Dalal C.K., Elowitz M.B. Frequency-modulated nuclear localization bursts coordinate gene regulation. Nature. 2008;455:485–490. doi: 10.1038/nature07292. [DOI] [PMC free article] [PubMed] [Google Scholar]
Associated Data
This section collects any data citations, data availability statements, or supplementary materials included in this article.