

Abstract
Novel phenotypes can originate either through mutations in existing genotypes or through phenotypic plasticity, the ability of one genotype to form multiple phenotypes. From molecules to organisms, plasticity is a ubiquitous feature of life, and a potential source of exaptations, adaptive traits that originated for nonadaptive reasons. Another ubiquitous feature is robustness to mutations, although it is unknown whether such robustness helps or hinders the origin of new phenotypes through plasticity. RNA is ideal to address this question, because it shows extensive plasticity in its secondary structure phenotypes, a consequence of their continual folding and unfolding, and these phenotypes have important biological functions. Moreover, RNA is to some extent robust to mutations. This robustness structures RNA genotype space into myriad connected networks of genotypes with the same phenotype, and it influences the dynamics of evolving populations on a genotype network. In this study I show that both effects help accelerate the exploration of novel phenotypes through plasticity. My observations are based on many RNA molecules sampled at random from RNA sequence space, and on 30 biological RNA molecules. They are thus not only a generic feature of RNA sequence space but are relevant for the molecular evolution of biological RNA.
Introduction
Evolutionary adaptations and innovations are new traits (phenotypes) that help organisms survive and reproduce. They can have two principal evolutionary origins. One of them requires DNA mutations, changes in a genotype that bring forth a new phenotype. The other relies on phenotypic plasticity. Phenotypic plasticity is the ability of a biological system with a given genotype to adopt multiple phenotypes. Such plasticity is widespread (1) and exists in whole organisms, from amphibians that undergo metamorphosis, to casts in social insects, and plants with changing leaf shapes, all the way down to molecules, where the shapes of protein and RNA molecules fluctuate incessantly between different conformations. What causes such plasticity is the environment, broadly defined, which includes the nutrients that an organism is exposed to—food, for example, helps determine casts in social insects—to the molecules inside a cell, whose thermal motion drive any one protein’s continual shape change. Because phenotypic plasticity is so ubiquitous, the environment and its change play a critical role in the origin of novel phenotypes. Although one could thus argue that the environment’s role is even more important than that of the genotype, the two roles are inseparably intertwined (1). Absent the right genotype, no environment will allow an organism to bring forth certain phenotypes, and vice versa.
The phenotypic plasticity of molecules plays important roles in cellular life. A prominent example involves RNA molecules called riboswitches, which regulate the biosynthesis of small molecules, such as vitamins and amino acids (2,3). In addition to conformational motions, which other RNA molecules also undergo, these molecules can switch between alternative secondary structures—planar shapes caused by internal base pairing—through the binding of a small regulatory molecule. One of these conformations may allow transcription of a gene or translation of its mRNA, whereas the other conformation prevents it. Another example comes from enzymes that are catalytically promiscuous. In addition to their primary reaction, such enzymes catalyze several side reactions. A case in point is the cytochrome P450 protein family, whose members can hydroxylate many different chemicals; chymotrypsin, a digestive enzyme that can cleave many kinds of proteins; or bovine carbonic anhydrase, which interconverts carbon dioxide and bicarbonate ions but can also cleave highly toxic organophosphates (4–6). In the right environment, any one side reaction may become important to the survival of an organism and may thus become the target of natural selection to improve its efficiency through genetic change. Phenotypic plasticity is thus also a source of exaptations or preadaptations—adaptive traits whose original role in the life of an organism was different from their current role (7). Examples of such exaptations range from the macroscopic—the feathers of birds, the wings of (flightless) penguins—to the molecular, such as a subunit of the lactose synthetase that synthesizes the lactose in mammalian milk but is derived from lysozyme, a protein that kills bacteria (8,9).
Mutational robustness is the ability of a biological system’s phenotype to persist in the face of DNA mutations. Biological systems on all levels of organization, from whole organisms to molecules, are to some extent robust to mutations. One would think that mutational robustness, by its very definition, could only hinder the ability of mutations to bring forth novel adaptive phenotypes. However, with possible exceptions (10), this is not generally the case, especially for molecular phenotypes (11–16). For example, in laboratory evolution experiments, robust proteins evolve new catalytic activities more easily (14), and proteins with robust folds have evolved a greater diversity of catalytic functions than other proteins (16). Robustness is both a necessary and sufficient condition for the existence of genotype networks (17) or neutral networks (18,19), vast connected sets of genotypes with the same phenotypes. Such networks are ultimately the reason why robustness can facilitate the origins of new phenotypes through mutations, as has been discussed elsewhere (20).
It is much better understood how robustness can affect the origin of new phenotypes through mutation than through plasticity (10,21). In this study I investigate whether mutational robustness facilitates or hinders this origin, using RNA molecules and their secondary structure phenotypes. RNA is ideal for this purpose because, first, it regulates many cellular processes through molecules such as small interfering RNAs, guide RNAs involved in RNA editing, and small nuclear RNAS involved in splicing (22–26). Second, in many biological RNA molecules, the secondary structure is itself a functionally important phenotype and thus worthy of study. Many examples come from RNA viruses, whose life cycle is regulated by RNA secondary structure elements (27–31), and secondary structures in mRNA molecules that regulate half-life and translation (32–35). Third, efficient algorithms exist to predict the native or minimum-free energy secondary structure phenotype Pmfe, of an RNA molecule (36), and the spectrum of alternative phenotypes that such a molecule can adopt through thermal motion (37). The latter indicates an RNA molecule’s phenotypic plasticity, a central focus of this paper. With such algorithms, one is not restricted to study the relationship between robustness and plasticity for one or few biological RNA molecules, but one can sample thousands of sequences from RNA sequence space, examine their phenotypic plasticity, and thus arrive at conclusions that hold generically for most RNAs.
The mutational robustness of an RNA genotype is the fraction of the molecule’s neighbors—molecules that differ from it in a single nucleotide—with the same native phenotype Pmfe as the molecule itself. Most RNA molecules are to some extent robust, and this robustness has two consequences. The first, structural consequence, which I have already mentioned, is that RNA genotypes with the same native phenotype are organized into genotype networks (17–19). The second, dynamic consequence affects how populations evolve on an RNA genotype network (11). In this study I show that both consequences of robustness facilitate the origin of novel phenotypes through phenotypic plasticity for a broad range of RNA molecules.
Methods
Folding, inverse folding, and thermodynamic ensemble calculations
Mediated by thermal motion, any one RNA molecule continually changes its secondary structure phenotype P through formation and dissociation of internal base pairs. In thermodynamic equilibrium, the molecule will spend a fraction of time in phenotype P, where is the free energy of the phenotype, k is the Boltzmann constant, T is the absolute temperature (kT ≈ 0.62 kcal/mol at 310.15 Kelvin or 37°C), and Z is the partition function, the normalization factor , where summation is over all possible secondary structures P. Of special importance is the phenotype Pmfe with the smallest or minimum free energy (mfe) among all secondary structure, because the molecule spends the relative majority of its time in this native phenotype. To compute the mfe secondary structure of an RNA molecule, I used the routine fold from the Vienna RNA package (http://www.tbi.univie.ac.at/∼ivo/RNA/, (36)). To determine arbitrary sequences that fold into a given structure, I used the program inverse_fold from the same package. Specifically, this program starts with a randomly chosen sequence and performs a guided random walk through sequence space to find a sequence with the desired structure (36). Inverse_fold effectively samples the space of sequences folding into a given structure at random or nearly so (18,39). To compute all secondary structures within a given energy interval E above the mfe of a given sequence, I used the routine subopt (37,40). In all routines I used default parameters, in particular a folding temperature of 37°C. To compute the structural diversity of all sequences in the plastic repertoire of a given molecule, I computed the pairwise Hamming distance of the dot-parenthesis representation of the structures, which increases by one for every base that is paired in one structure but unpaired in the other.
Choice of structures
I used two classes of RNA sequences and structures in this analysis. The first are biological molecules (Table S1), all of which are taken from the functional RNA database fRNAdb (http://www.ncrna.org/frnadb, (41)), and have been used in a previous study to estimate genotype network sizes (42). Their choice is arbitrary, except that I chose only molecules of length up to L = 43 to make the computational analysis herein feasible. I also used random RNA molecules of varying length L, which I generated as follows. I first created a (pseudo)random nucleotide string of length L, in which each of the four nucleotides occurs with equal likelihood at each position. I then computed the mfe structure of this molecule. If the molecule folded into some secondary structure, I kept it for further analysis, otherwise I created another random nucleotide string and repeated the procedure until I had found a string that folded. This iterative procedure is necessary, because a substantial fraction of short random RNA strings do not fold.
Neighborhoods in sequence space
Consider an RNA sequence (genotype) G and its mfe phenotype P. The k-mutant neighborhood, or k-neighborhood of G comprises all sequences that differ in no more than k nucleotides from G. I define the neutral k-neighborhood as comprising all sequences that differ in no more than k nucleotides from G, and that have the same native phenotype P as G. I studied two different aspects of these neighborhoods. First, I studied, for neutral neighborhoods up to k = 2, the number of different RNA secondary structures that occur in the plastic repertoire of sequences in the neighborhood. To this end, I determined all k-mutant neutral neighbors of G, as well as the phenotypes in the plastic repertoire of each neighbor. I then counted all unique phenotypes in the union of all these plastic repertoires. That is, if two phenotypes occurred in the plastic repertoire of two sequences, I counted them only once. Second, I studied for neighborhoods up to k = 3, the number of different native (mfe) phenotypes that occur in this neighborhood. To this end I created computationally all sequences in the k-neighborhood of G, determined their native phenotype, and counted the number of unique phenotypes in the resulting set of phenotypes. Analyses of larger neighborhoods were computationally infeasible, because neighborhood size increases exponentially with k.
Random RNAs with varying genotype set sizes
The total number of RNA sequences with a given native phenotype is the neutral set or genotype set of this phenotype (18,43). It is straightforward to generate a sample of phenotypes with different genotype set sizes, but much more difficult to estimate the genotype set size of a given phenotype (42). If genotype set sizes are to be estimated for many different structures, the following approach based on random sequences is computationally feasible. First, generate a very large sample (>106) of random RNA sequences and determine their mfe structure. For any one structure, count the number of times M that it occurs in this sample. For structures that occur multiple times in the sample, M divided by the genotype space size, is an estimate of the genotype set size of the structure, whose standard error is inversely proportional to the square root of M. This approach works best for sequences of a modest length (11), because sequences much shorter than L = 30 nucleotides adopt too limited a repertoire of structures, and in much longer sequences even a large random sample leads only to unique structures. For instance, a sample of 106 random sequences of length L = 75 typically contains only structures that occur merely once in the sample. Sequences of modest length (L = 30) occupy a middle ground of being structurally diverse, yet being tractable with realistic sample sizes.
Population simulation and random walks on genotype networks
I simulated the evolution of populations on a genotype network through cycles of mutation and “soft selection” as follows. For populations of size N > 1, all members of a population initially had the same genotype, which forms some native phenotype P. I subjected each individual to exactly one point mutation, that is, I replaced one nucleotide at a randomly chosen sequence position with a randomly chosen nucleotide. After this mutation step, I determined the phenotype of each mutant sequence and considered those sequences that had changed their native phenotype inviable. I then sampled from the remaining viable sequences exactly N sequences with replacement to form a population for the next generation.
For populations of N = 1 individuals, this process reduces to a random walk on a genotype network. This random walk starts from a single sequence with a given phenotype P, mutates the sequence as described, and mutates the mutant sequence’s phenotype. If this phenotype is different from P, the mutation is rejected, another mutation is introduced, and so on, until a new genotype is found that has the phenotype P. Once such a sequence has been found, a single step of the random walk is considered completed.
Statistical analyses
All statistical analyses were performed in Statistica (StatSoft Inc., Tulsa, OK, http://www.statsoft.com/). Box plots include information about the nonoutlier range, defined as follows. If l designates the 25th percentile and u the 75th percentile of a distribution, then the nonoutlier range (whiskers in box plots) span the interval (u + (u - l), l - (u - l)). Where shown, the extremes of the distribution comprise data points that lie outside the interval (u + 3(u - l), l - 3(u - l)).
Results
Genotype networks greatly increase the number of phenotypes accessible through phenotypic plasticity
I define plasticity as the number of all secondary structures that an RNA molecule can adopt within a specific energy interval E above the minimum free energy structure. I also refer to this set as the molecule’s plastic repertoire (10). E is conveniently given in units of kT, the product of the Boltzmann constant k and the absolute temperature T (see Methods). I then explore energy intervals E between one and five kT units. Much larger energy intervals are prohibitive, because the number of alternative secondary structures increases rapidly with free energy. Moreover, the phenotypes found far above the minimum free energy are also of little biological relevance, because molecules spend vanishing amounts of time in them. As a point of reference, a change in free energy of 3 kT corresponds to ∼1.8 kcal/mol, which is the energy involved in the stacking interaction of one adjacent G-C/C-G base pairs, or that of two adjacent A-U/U-A base pairs (44).
For my analysis, two different kinds of information are useful. First, many RNA molecules sampled at random from RNA genotype space can provide information about properties of typical RNA molecules. (Exhaustive analysis is infeasible for all but the shortest sequences, because sequence space contains 4L sequences of length L.) Second, analysis of biological RNA molecules isolated from some organism can show whether such molecules are unusual, in that their properties deviate from those of randomly sampled molecules. In a preliminary analysis, I compared the plasticity of 30 different biological RNA molecules with that of randomly sampled RNA molecules of comparable length. They are similar (see Figs. S1–S4 in the Supporting Material), which suggests that the generic properties of RNA genotype space revealed by random sampling are relevant for the evolution of biological molecules. I juxtapose observations from both kinds of analysis in the next sections.
The more alternative phenotypes a molecule can explore—either through mutation or through plasticity—the greater the chances that it stumbles upon the few new mutants that are not deleterious (45) and that may constitute adaptations. The genotype networks that robustness brings forth could aid such exploration, if different genotypes with the same native phenotype produce different alternative secondary structures through plasticity. I now address whether this is the case.
The left-most black bar in Fig. 1 shows the total number of unique (different) alternative phenotypes that can be found in a E = 3kT energy interval above the native phenotype of a guide RNA G (L = 40, Table S1, also shown in Fig. S1 a, inset). This number is equal to 65.7 (± 27.5 standard errors of the mean [s.e.m.]), averaged over 10 genotypes obtained through inverse folding of P. These molecules have on average 52 1-mutant neighbors with the same mfe structure P. The left-most medium gray bar in Fig. 1 a—note the logarithmic vertical axis—shows the number of unique alternative phenotypes that these 1-neighbors can form through plasticity. Here, “unique” means that if a phenotype occurs in the plastic repertoire of two neighbors, it is counted only once. The mean number of unique phenotypes is 525.7 (± 112.8 s.e.m.), again averaged over 10 inversely folded mfe sequences with phenotype P and their 1-neighbors. Taken together, the plastic repertoire of molecules in the 1-neighborhood is about eight times greater than the number of phenotypes found in the plastic repertoire of the genotype G itself. Thus, the mere exploration of all 1-mutant neighbors with phenotype P leads to a large increase in the number of different phenotypes that become accessible through plasticity. This increase is even larger if one includes not only 1-neighbors, but also 2-neighbors of G with phenotype P, which renders 3814.4 (± 446.1 s.e.m.) (see Fig. 1 a, left-most light gray bar) alternative phenotypes accessible through plasticity, more than 58 times as many as in the plastic repertoire of G itself. (The exploration of larger neighborhoods is computationally prohibitive.) Fig. 1 a also shows similar results for two further RNA molecules, and Fig. S5 summarizes analogous results for all 30 biological RNA molecules considered in this study. For example, at E = 3kT, the number of phenotypes that are accessible through plasticity from a sequence itself, from its neutral 1-neighbors, and from its neutral 1- and 2-neighbors averages to 62.1 (± 6.2), 441.7 (± 49.5), and 2396 (± 319.8) for the 30 biological RNA molecules. Taken together, these observations show that even small neighborhoods of a genotype network can render many novel phenotypes accessible through phenotypic plasticity. More generally, mutational robustness greatly facilitates the exploration of new phenotypes through phenotypic plasticity.
Figure 1.
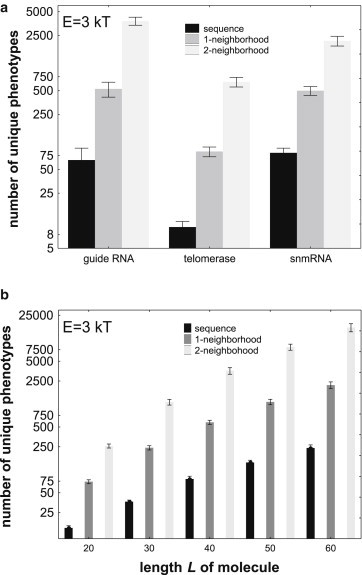
Even small neutral neighborhoods of a sequence render many novel phenotypes accessible through plasticity. (a) Each group of three bars corresponds to data based on one biological RNA molecule indicated on the horizontal axis. The molecules (Table S1) are part of a guide RNA (L = 40nt; Genbank Acc. No. L25590), a telomerase fragment (L = 33nt; Acc. No. AF061109), and a snmRNA (L = 35nt; Acc. No. AJ430256, all from fRNAdb (41)). Predicted native phenotypes P for these molecules are shown in Table S1. The black bar in each group of bars indicates the mean number of unique phenotypes, i.e., phenotypes different from one another, in the plastic repertoire P0 of an (inversely folded) sequence with the same native phenotype P as the biological molecule. The height of the medium gray (middle) bar indicates the number of unique phenotypes in the union of P0 and P1, where P1 is the number of all different phenotypes in those 1-neighbors of the sequence that have the same native phenotype P as the sequence itself. Light gray bars indicate, analogously, the number of unique phenotypes in the union of P0, P1, and P2,where P2 denotes the plastic repertoire of all 2-neighbors of the sequence with the same phenotype P as the sequence itself. The height of each bar indicates an average over 10 inversely folded sequences. (b) As in (a), but for random RNA sequences of varying length (horizontal axis). For each L with the exception of L = 60 nucleotides, data are based on n = 20 different RNA phenotypes of randomly chosen RNA sequences, and on five inversely folded sequences per phenotype. For length 60, n = 18. The height of each bar indicates an average over the 5 × 20 = 100 (or 5 × 18 = 90) inversely folded sequences. Whiskers indicate one standard error of the mean.
A related question is whether the number of novel phenotypes accessible through plasticity is smaller or greater than those accessible through mutation. For example, one can ask whether the number of novel phenotypes found in the plastic repertoire of a sequence is greater than the number of new phenotypes that can be produced from this sequence through single-point mutations as novel native phenotypes. The answer must depend on the energy interval one considers. It turns out that only for E = 1kT is the number of novel phenotypes accessible through plasticity smaller than those accessible through mutation (Fig. S6 a). For E = 3kT and greater, more novel phenotypes are accessible through plasticity (Fig. S6 a). Larger neighborhoods lead to the same answers. Specifically, at E = 3kT and higher, more phenotypes are accessible from the neutral 1-neighbors of a sequence through plasticity than through mutations of these 1-neighbors, and analogously for neutral 2-neighbors (Fig. S6 b and c).
Random RNA sequences give rise to the same observations as biological RNA sequences, as shown in Fig. 1 b for E = 3kT (and in Fig. S7 for different energy intervals E). Note the logarithmic scale on the vertical axis, which indicates that the number of unique phenotypes accessible through plasticity increases approximately exponentially, both with the length of the molecule, and with the size of the neighborhood considered. For example, for RNA molecules of length 40, which lies within the length range of the biological molecules considered in this study, the number of phenotypes that are accessible through plasticity from a sequence itself, from its neutral 1-neighbors, and from its neutral 1- and 2-neighbors averages to 80.0 (± 8.1), 589.1 (± 43.1), and 3577.3 (± 410.9) phenotypes (Fig. 1 b).
In sum, in both biological and random RNA molecules, mutational robustness leads to a massive increase in the number of phenotypes that can be explored through plasticity, even if one just considers the neutral 1-mutant and 2-mutant neighborhoods of genotype G.
The plastic repertoires of distant sequences are very different
Because genotype network sizes are generally very large—for the biological sequences examined in this study, they can exceed 1020 genotypes (Table S1, 42)—it is not feasible to examine the total number of phenotypes that all of these genotypes can form through plasticity. However, other approaches can help to understand the phenotypic diversity of genotypes with the same native phenotype. In the first of them, one examines pairs of genotypes G1 and G2 drawn at random from the same genotype network, i.e., they have the same native phenotype P. One asks whether the set of alternative phenotypes P1 and P2 in the plastic repertoires of each genotype overlap to a great extent. If so, the observation that the plastic repertoire increases greatly when one examines not only a sequence but also its neutral neighbors (Fig. 1) would not extend to genotypes distant from this sequence. Specifically, one can examine the fraction U of unique phenotypes, i.e., phenotypes that occur in P2 but not in P1, as indicated by the gray region in the inset of Fig. 2 a. The data in Fig. 2 a is a histogram of U based on 500 sequence pairs obtained through inverse folding of a guide RNA secondary structure (Table S1). Regardless of the energy interval chosen, for the vast majority of sequence pairs, U is greater than 0.8. This means that more than 80 percent of structures that occur in the plastic repertoire of one sequence do not also occur in the repertoire of the other sequence. Fig. S8 shows analogous histograms for a telomerase fragment (L = 33) and a snmRNA (L = 35; Table S1), and Fig. S9 summarizes data on U for all 30 biological RNA sequences. Fig. 2 b shows that much the same holds for randomly sampled RNA molecules, where the median value of U always exceeds U = 0.79. Taken together, these observations show that in both biological and random RNA sequences, the plastic repertoires of two distant sequences with the same native phenotype are generally very different.
Figure 2.
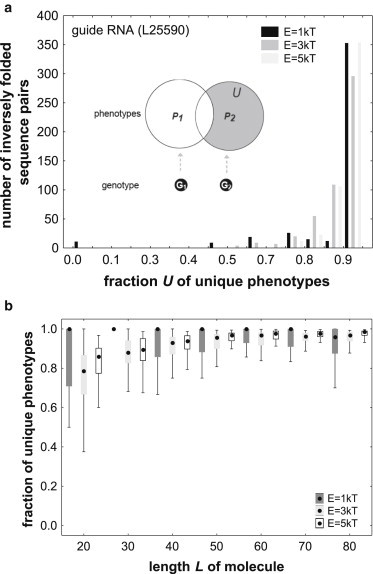
Different genotypes with the same native phenotype differ greatly in the phenotypes of their plastic repertoire. The figure shows data about the plastic repertoires of two genotypes G1 and G2 with the same native phenotype P. These plastic repertoires are indicated by circles in the inset of panel (a). Specifically, the figure displays the fraction U of phenotypes that are in the plastic repertoire P2, of G2, but not in P1, of G1, as indicated by the gray shaded region of the inset. (a) the distribution of U for 500 inversely folded sequence pairs with a predicted mfe structure identical to that of the guide RNA (L = 40nt; Genbank Acc. No. L25590) from Table S1. The distribution is shown for three different energy intervals E, as indicated in the right inset. Note that for most sequence pairs, U is close to 1, meaning that most phenotypes in the plastic repertoire of one sequence are unique. (b) Box plot of U for random sequences of different lengths (horizontal axis) and different energy intervals (inset). For each length value, data are based on 10 random RNA sequences that fold into a secondary structure phenotype, and for 5 inversely folded sequence pairs for each phenotype, i.e., for 50 sequence pairs in total. Black dots indicate medians, boxes span the 25th to 75th percentile of the distribution, and whiskers indicate the nonoutlier range (see Methods). A median of U = 1 indicates that for more than half of all sequence pairs, the plastic repertoires do not share a single structure.
The number of unique phenotypes accessible through plasticity increases steadily during long random walks on a genotype network
The previous analysis focused on pairs of genotypes with the same phenotype P, and showed that their plastic repertoires are typically very different. This might no longer hold if one compares not just two but multiple genotypes with the same P. That is, most phenotypes accessible through the plastic repertoire of one of these genotypes might occur as part of the plastic repertoire of other genotypes, and would thus no longer be new. My next analysis shows that this is not the case, at least unless the number of genotypes becomes very large. To this end, I analyzed long random walks on a given genotype network. Each such random walk begins with a genotype G that has some phenotype P. Each step in the random walk consists of a point mutation, that is, a change in a randomly chosen nucleotide of this genotype that is required to preserve the phenotype P. (If any one mutation changes P, the mutation is rejected, and another mutation is chosen, until one is found that preserves P.) After each step of this random walk, I identified all phenotypes in the plastic repertoire of the random walker. I then determined for each of these phenotypes whether it was unique, that is, whether it had not already occurred in the plastic repertoire of the random walker during any one of its previous steps. If a phenotype was unique, I added it to a list of unique phenotypes. The length of this list represents the cumulative number of unique phenotypes accessible through plasticity, a number that can only increase, never decrease during the random walk. I asked how long this cumulative number of phenotypes increases. If it stops to increase after a few steps, then the total (cumulative) plastic repertoire of multiple pairs of genotypes G with the same P could be small.
Fig. 3 a shows the answer for three biological RNA molecules and for the energy interval E = 3kT. The figure shows the cumulative number of phenotypes accessible through plasticity as a function of the number of steps (mutations) in the random walk. For any one of the three molecules, this number increases steadily, and shows no signs of saturation, at least for the 1000 steps shown here. Fig. S10 shows a very similar pattern for 15 biological RNA molecules (including these three), and for all three energy intervals. Although the rate at which new accessible phenotypes accumulate differs substantially among molecules, they accumulate approximately linearly for each of the molecules.
Figure 3.
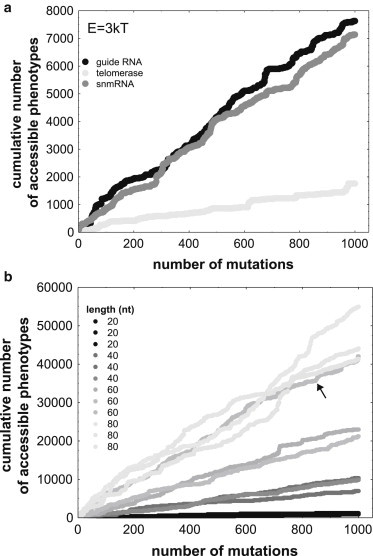
New accessible phenotypes accumulate at a nondecreasing rate. The horizontal axes show the number of steps along a random walk of 1000 steps on a genotype network. The vertical axes show the cumulative number of phenotypes that become accessible through phenotypic plasticity during the random walk. (a) Cumulative accessible phenotypes during one random walk each for three biological molecules that are part of a guide RNA (Genbank Acc. No. L25590), a telomerase fragment (Acc. No. AF061109), and a snmRNA (Acc. No. AJ430256, Table S1), all taken from fRNAdb (http://www.ncrna.org/frnadb, (41)). (b) Cumulative accessible phenotypes during 12 random walks for random starting genotypes with an arbitrary phenotype. Specifically, data are shown for starting genotypes in four different length categories (see legend), and for three random starting genotypes (with three different phenotypes) in each category. All data are shown for the energy interval E = 3kT.
To find out whether this is an unusual property that holds only for biological RNA molecules, I carried out multiple random walks starting from random RNA genotypes, each of which had a different phenotype P. Fig. 3 b shows, as an example, the results of 12 such random walks, three each for molecules of length 20, 40, 60, and 80. Again, novel accessible phenotypes accumulate at a roughly constant rate without any apparent saturating behavior. The rate is generally greater for longer molecules, which is unsurprising, because such molecules have a greater plastic repertoire (Fig. S1 c). However, substantial rate variation can exist among molecules with the same length. The arrow in Fig. 3 b highlights an example, a sequence of length 60 for which accessible phenotypes accumulate at a faster rate characteristic of longer sequences. Overall, the biological molecules accumulate accessible phenotypes at a rate comparable with those of random molecules. For example, for the energy interval E = 3kT, the mean cumulative number of accessible phenotypes after 1000 steps is 3342.5 for random walks starting from 10 random sequences of length 30 nucleotides, and 4171.7 for the 8 biological sequences of the same length (Table S1). If one were to assume that these 8 biological sequences are representative of all biological sequences, then this difference would not be not statistically significant (t-test: p = 0.25; Mann-Whitney U-test: p = 0.41; n = 10,7).
Evolving populations with robust phenotypes can access more phenotypic variation through plasticity
The preceding sections focused on structural aspects of mutational robustness, i.e., its role in structuring genotype space, whereas this section focuses on the role that robustness can play in the evolutionary dynamics of a population. To appreciate this role, it is necessary to make a distinction between two notions of mutational robustness. Thus far, I have referred to mutational robustness as the fraction of neighbors with the same native phenotype as a given RNA genotype G. This is the robustness of a genotype G, or genotypic robustness. A complementary notion of robustness, based on all genotypes with a given native phenotype P, can be calculated by averaging the genotypic robustness of all these genotypes. Because this measure of robustness is specific to a phenotype, I call it phenotypic robustness (11). The robustness of a phenotype P increases with the number of RNA genotypes that form this phenotype (11). In other words, in large RNA genotype sets or genotype networks, individual RNA molecules are on average more robust. For this reason, one can use the number of RNA genotypes that form a phenotype as a proxy for its phenotypic robustness. I express this number as f, the fraction of all 4L genotypes in genotype space that fold into a given phenotype.
The higher the mutational robustness of an RNA genotype, the lower the number of alternative phenotypes in its plastic repertoire (10). By extrapolating this simple relationship to phenotypic robustness, one might conclude that phenotypic robustness might likewise reduce the number of new phenotypes accessible through plasticity. But for populations evolving on a given genotype network this is not necessarily so. Consider a population of initially identical RNA molecules that is subject to multiple cycles (“generations”) of stabilizing selection, which maintains the phenotype P of these molecules, and point mutations in individual nucleotides. As such a population spreads through the genotype network of P, two conflicting factors will affect the number of novel phenotypes it can explore through plasticity. First, the more robust the phenotype P of this population is, the fewer alternative phenotypes will occur in the plastic repertoire of each of the population’s individuals. Second, the more robust P is, the less likely it is that any one mutation affecting a member of the population has a deleterious effect. This means that the population will, on average, experience fewer of the deleterious mutations that selection eliminates, and it will thus spread faster through P’s genotype network. In other words, at any one time, its members will have more diverse genotypes. If more diverse genotypes have a greater plastic repertoire, then the population with a robust phenotype may actually be able to access more phenotypic diversity through plasticity. In sum, although high phenotypic robustness implies that each of a population’s members has a reduced plastic repertoire, the population as a whole will be more diverse and may thus have a greater plastic repertoire. It is not clear which of these factors dominates in its influence.
To find out, I studied a large sample of 106 random RNA genotypes of length L = 30 whose phenotypes vary broadly in their robustness, as reflected in the fraction f of genotype space that form them, which spans more than three orders of magnitude (11). Such sequences strike a balance between forming many phenotypes and being short enough that their phenotypic robustness can be estimated for many of them (see Methods). I established a population of 100 initially identical RNA genotypes that form a native phenotype Pmfe with a given robustness. I then subjected this population to repeated cycles (“generations”) of mutation, at a rate of μ = 1 nucleotide per cycle per molecule, and selection, where only those molecules survived in which mutation had not altered the native phenotype P. During each such generation, I determined the total number of unique phenotypes accessible to at least one member of the population via plasticity. Fig. 4 a shows this number for two phenotypes of high and low f, and for E = 3kT (see Fig. S11 for other energy intervals). The figure demonstrates that the population with a highly robust phenotype can access many more novel phenotypes through plasticity. Fig. 4 b and c demonstrate that high phenotypic robustness is associated with greater genotypic diversity. Fig. 4 d shows data not just for two phenotypes, but for 3.8 × 10⁴ phenotypes with broadly varying robustness (f) and three replicate populations per phenotype (E = 3kT, see Fig. S12 for E = 1kT and E = 5kT). Specifically, the figure shows the total number of accessible phenotypes at generation 10 for three replicate populations per phenotype. Analogous simulations starting from each of the 30 biological molecules in this study also show that the number of accessible phenotypes at generation 10 is higher for molecules whose phenotype has a high f. Despite the few molecules used in this analysis, this association is significant for two out of the three energy intervals (E = 5kT: Spearman’s r = 0.57, p = 0.0018; E = 3kT: Spearman’s r = 0.47, p = 0.013; E = 1kT: Spearman’s r = 0.32, p = 0.095). Taken together, these observations show that populations with a highly robust phenotype are more diverse and have access to more novel phenotypes through plasticity.
Figure 4.
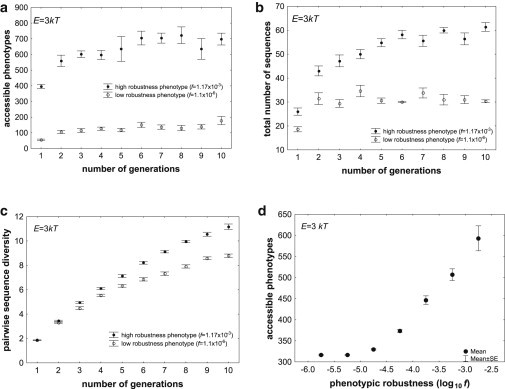
Phenotypic robustness entails access to more novel phenotypes through plasticity. (a)–(c): The horizontal axes show time in generations (mutation-selection cycles). The vertical axes show (a) the total number of unique phenotypes accessible to at least one individual in an entire population through plasticity, (b) the total number of sequences in the population, and (c) the pairwise nucleotide diversity, i.e., the number of nucleotides differing between sequence pairs, averaged over all pairs of sequences in the population. All data are based on populations of size N = 100 individuals, with a mutation rate of μ = 1 nucleotides per generation, where selection was required to preserve the native phenotype of each individual. Each population started out with identical genotypes of L = 30 nucleotides that folded into the same native phenotype. The fraction of genotype space occupied by sequences folding into that phenotype is given by the value of f in the inset. The number of accessible phenotypes is shown for the energy interval E = 3 kT. Circles indicate means over five replicate populations starting from the same genotype. Whiskers indicate one standard error of the mean. (d) Association between phenotypic robustness (log10(f), horizontal axis) and phenotypes accessible through plasticity (vertical axis), based on more than 38,000 RNA phenotypes of L = 30, and on at least three replicate evolving populations per phenotype, where each population had N = 100 members and a mutation rate of μ = 1 nucleotides per generation.
If one counts the cumulative number of accessible phenotypes, that is, the number of phenotypes accessible since generation one, the differences between the robust and less robust populations become even more pronounced (Fig. S13). For example, at E = 3kT, and after merely 10 generations, the population with a robust phenotype could access more than 2400 novel phenotypes through plasticity, whereas the population with the less robust phenotype could access fewer than 450 novel phenotypes (Fig. S13 b). I also note that all these observations were made for populations where the population genetic parameter Nμ was much greater than one. Such populations are polymorphic most of the time (46), but analogous observations hold for populations that are monomorphic most of the time (Nμ ≪1). Fig. S14 shows an example.
Discussion
Mutational robustness affects the exploration of novel phenotypes by evolving RNA molecules in two complementary ways. First, it structures genotype space into myriad interwoven networks of molecules with the same native phenotype. Evolving RNA molecules can explore these networks while preserving their native phenotype, which facilitates exploration of new phenotypes through mutation (10,18,47,48). In this study I showed that the same holds for exploration of new phenotypes through phenotypic plasticity, and for similar reasons. Specifically, small neutral neighborhoods of a molecule have a much greater plastic repertoire than the molecule itself, randomly sampled molecules from the same genotype network have very different plastic repertoires, and molecules that walk randomly along such a network gain access to ever-increasing numbers of novel phenotypes in their plastic repertoire.
Second, robustness influences the evolutionary dynamics of RNA populations. Specifically, molecules evolving on large genotype networks—those of more robust phenotypes—diversify faster, and thus gain access to more novel phenotypes in their plastic repertoire. This accelerating effect of robustness mirrors previous observations about its role in facilitating access of new phenotypes through mutation (11). A similar accelerating role has been observed in models of gene regulation circuits (49).
Biological macromolecules are important sources of exaptations, adaptive traits whose current role is different from the reasons for their origins (7). A special case are exaptations that do have nonadaptive origins. Examples include promiscuous proteins, which catalyze not only one main chemical reaction, but also multiple side reactions on alternative substrates, a byproduct of their conformational flexibility (6,50,51). Natural or artificial selection in the laboratory can increase an enzyme’s activity on such alternative substrates, which can thus become exaptations with nonadaptive origins (14,52,53). The alternative conformations of RNA molecules are also potential sources of exaptations. This “exaptive potential” is amplified by mutational robustness, because both increase the number of alternative phenotypes that RNA molecules can explore. Moreover, an intriguing connection—recently also demonstrated in metabolism (54)—exists between complexity and this exaptive potential: more complex, i.e., longer molecules generally have a greater plastic repertoire (Fig. S1 c), and their exaptive potential is therefore also greater.
It is sometimes argued that mutations are less important than plasticity in creating new phenotypes. Systems such as RNA provide a quantitative way to address this issue. One can, for example, ask how large the set of genotypes is that have a specific phenotype in their plastic repertoire. If plasticity was all-important for the accessibility of new phenotypes, then this set of genotypes should comprise all or most of genotype space for any one phenotype. This is clearly not the case for RNA. For example, for 70 nucleotide-long random RNA molecules, the set of genotypes that have a given phenotype in their plastic repertoire at E = 5kT above the mfe is more than 4000 times larger than the set of genotypes that have this phenotype as their native phenotype (Fig. S15 b), but they still only comprise a vanishing fraction 10−10 of genotype space (Fig. S15 c). Moreover, the plastic repertoire of the longest molecules considered here at E = 5kT—where the fraction of time spent by a molecule in one such phenotype may be as small as 10−5—comprise only a few thousand phenotypes (Fig. S1 c), a vanishing fraction of the total number of RNA phenotypes, which scales exponentially with sequence length L at ∼1.8L (18). Thus, to reach most RNA phenotypes, mutational alterations of sequences are clearly necessary. But whereas plasticity is no more important than mutation from the global perspective of an entire genotype space, plasticity can provide a local advantage in allowing access to new phenotypes, e.g., by making more phenotypes accessible from a given sequence and its neighbors than mutations (Fig. S6).
A potential limitation of this work is that not all of a genotype network’s parts are equally accessible to an evolving population, because sets of genotypes with the same native phenotype form multiple disjoint components or subnetworks (19,55). However, this is not likely to affect my main conclusions. First, the results of both random walkers and evolving populations studied are based on a single component of a genotype network. Second, molecular evolution data suggest that so-called compensatory mutations, which can bridge the gaps between such subnetworks, are frequent in nature (56–59), such that evolving populations can explore more than one subnetwork. A further limitation is the tacit assumption that accessible phenotypes are those that occur in a molecule’s plastic repertoire in thermodynamic equilibrium, which neglects phenomena such as kinetic folding (60). The incorporation of such nonequilibrium scenarios is computationally demanding, and thus needs to be deferred to future work.
A genotype network may have regions where robustness can be so high that the accessibility of novel phenotypes is reduced, which can lead to entrapment of populations in such regions (10,61). The observations reported in this study do not show any signs of such entrapment, even though they are based on many different RNA phenotypes. However, entrapment may well occur in the evolution of some biological RNA molecules, and to examine where it occurs remains another task for future work.
Because my observations are based on many molecules sampled at random from genotype space, and because they also apply to 30 biological RNA molecules, they are generic properties of sequence space and relevant for biological molecules. Conversely, this means that I characterized typical properties of RNA genotype space, and exceptions may exist. For example, some RNA molecules may show greater structural variability in response to mutations than through plasticity. The incidence and biological significance of such exceptions remains to be elucidated.
The plasticity of the biological molecules in this study is similar to those of random molecules with similar length, suggesting that natural selection has neither favored increased plasticity nor reduced plasticity in them. One might think that is surprising. For example, it is sometimes argued that being plastic is advantageous in adaptive evolution, because it provides more rapid access to novel phenotypes than mutations. The same plasticity can be a hindrance if the biological role of a molecule requires that it spends the vast majority of its time in its native phenotype (62). To identify biological molecules that show signatures of selection for or against plasticity is yet another question for future work.
Acknowledgments
I acknowledge support through Swiss National Science Foundation grant 315230-129708, as well as through the University Priority Research Program in Evolutionary Biology at the University of Zurich.
Supporting Material
References
- 1.West-Eberhard M.J. Oxford University Press; Oxford, UK: 2003. Developmental Plasticity and Evolution. [Google Scholar]
- 2.Mandal M., Breaker R.R. Gene regulation by riboswitches. Nat. Rev. Mol. Cell Biol. 2004;5:451–463. doi: 10.1038/nrm1403. [DOI] [PubMed] [Google Scholar]
- 3.Vitreschak A.G., Rodionov D.A., Gelfand M.S. Riboswitches: the oldest mechanism for the regulation of gene expression? Trends Genet. 2004;20:44–50. doi: 10.1016/j.tig.2003.11.008. [DOI] [PubMed] [Google Scholar]
- 4.Tokuriki N., Tawfik D.S. Protein dynamism and evolvability. Science. 2009;324:203–207. doi: 10.1126/science.1169375. [DOI] [PubMed] [Google Scholar]
- 5.Muralidhara B.K., Sun L., Halpert J.R. Thermodynamic fidelity of the mammalian cytochrome P450 2B4 active site in binding substrates and inhibitors. J. Mol. Biol. 2008;377:232–245. doi: 10.1016/j.jmb.2007.12.068. [DOI] [PubMed] [Google Scholar]
- 6.O’Brien P.J., Herschlag D. Catalytic promiscuity and the evolution of new enzymatic activities. Chem. Biol. 1999;6:R91–R105. doi: 10.1016/S1074-5521(99)80033-7. [DOI] [PubMed] [Google Scholar]
- 7.Gould S., Vrba E. Exaptation—a missing term in the science of form. Paleobiology. 1982;8:4–15. [Google Scholar]
- 8.McKenzie H.A., White F.H., Jr. Lysozyme and alpha-lactalbumin: structure, function, and interrelationships. Adv. Protein Chem. 1991;41:173–315. doi: 10.1016/s0065-3233(08)60198-9. [DOI] [PubMed] [Google Scholar]
- 9.Gerhart J., Kirschner M. Blackwell; Boston: 1998. Cells, Embryos, and Evolution. [Google Scholar]
- 10.Ancel L.W., Fontana W. Plasticity, evolvability, and modularity in RNA. J. Exper. Zoo./Molec. Dev. Evol. 2000;288:242–283. doi: 10.1002/1097-010x(20001015)288:3<242::aid-jez5>3.0.co;2-o. [DOI] [PubMed] [Google Scholar]
- 11.Wagner A. Robustness and evolvability: a paradox resolved. Proc. Biol. Sci. 2008;275:91–100. doi: 10.1098/rspb.2007.1137. [DOI] [PMC free article] [PubMed] [Google Scholar]
- 12.Bloom J.D., Romero P.A., Arnold F.H. Neutral genetic drift can alter promiscuous protein functions, potentially aiding functional evolution. Biol. Direct. 2007;2:17. doi: 10.1186/1745-6150-2-17. [DOI] [PMC free article] [PubMed] [Google Scholar]
- 13.Bloom J.D., Gong L.I., Baltimore D. Permissive secondary mutations enable the evolution of influenza oseltamivir resistance. Science. 2010;328:1272–1275. doi: 10.1126/science.1187816. [DOI] [PMC free article] [PubMed] [Google Scholar]
- 14.Bloom J.D., Labthavikul S.T., Arnold F.H. Protein stability promotes evolvability. Proc. Natl. Acad. Sci. USA. 2006;103:5869–5874. doi: 10.1073/pnas.0510098103. [DOI] [PMC free article] [PubMed] [Google Scholar]
- 15.Bershtein S., Goldin K., Tawfik D.S. Intense neutral drifts yield robust and evolvable consensus proteins. J. Mol. Biol. 2008;379:1029–1044. doi: 10.1016/j.jmb.2008.04.024. [DOI] [PubMed] [Google Scholar]
- 16.Ferrada E., Wagner A. Protein robustness promotes evolutionary innovations on large evolutionary time-scales. Proc. Biol. Sci. 2008;275:1595–1602. doi: 10.1098/rspb.2007.1617. [DOI] [PMC free article] [PubMed] [Google Scholar]
- 17.Wagner A. The molecular origins of evolutionary innovations. Trends Genet. 2011;27:397–410. doi: 10.1016/j.tig.2011.06.002. [DOI] [PubMed] [Google Scholar]
- 18.Schuster P., Fontana W., Hofacker I.L. From sequences to shapes and back: a case study in RNA secondary structures. Proc. Biol. Sci. 1994;255:279–284. doi: 10.1098/rspb.1994.0040. [DOI] [PubMed] [Google Scholar]
- 19.Reidys C., Stadler P.F., Schuster P. Generic properties of combinatory maps: neutral networks of RNA secondary structures. Bull. Math. Biol. 1997;59:339–397. doi: 10.1007/BF02462007. [DOI] [PubMed] [Google Scholar]
- 20.Wagner A. The role of robustness in phenotypic adaptation and innovation. Proc. Biol. Sci. 2012;279:1249–1258. doi: 10.1098/rspb.2011.2293. [DOI] [PMC free article] [PubMed] [Google Scholar]
- 21.Espinosa-Soto C., Martin O.C., Wagner A. Phenotypic plasticity can facilitate adaptive evolution in gene regulatory circuits. BMC Evol. Biol. 2011;11:5. doi: 10.1186/1471-2148-11-5. [DOI] [PMC free article] [PubMed] [Google Scholar]
- 22.Ponting C.P., Oliver P.L., Reik W. Evolution and functions of long noncoding RNAs. Cell. 2009;136:629–641. doi: 10.1016/j.cell.2009.02.006. [DOI] [PubMed] [Google Scholar]
- 23.Storz G., Altuvia S., Wassarman K.M. An abundance of RNA regulators. Annu. Rev. Biochem. 2005;74:199–217. doi: 10.1146/annurev.biochem.74.082803.133136. [DOI] [PubMed] [Google Scholar]
- 24.Waters L.S., Storz G. Regulatory RNAs in bacteria. Cell. 2009;136:615–628. doi: 10.1016/j.cell.2009.01.043. [DOI] [PMC free article] [PubMed] [Google Scholar]
- 25.Bartel D.P. MicroRNAs: target recognition and regulatory functions. Cell. 2009;136:215–233. doi: 10.1016/j.cell.2009.01.002. [DOI] [PMC free article] [PubMed] [Google Scholar]
- 26.Alberts B., Johnson A., Walter P. Garland Science; New York: 2008. Molecular Biology of the Cell. [Google Scholar]
- 27.Dayton E.T., Konings D.A., Dayton A.I. Extensive sequence-specific information throughout the CAR/RRE, the target sequence of the human immunodeficiency virus type 1 Rev protein. J. Virol. 1992;66:1139–1151. doi: 10.1128/jvi.66.2.1139-1151.1992. [DOI] [PMC free article] [PubMed] [Google Scholar]
- 28.Baudin F., Marquet R., Ehresmann C. Functional sites in the 5′ region of human immunodeficiency virus type 1 RNA form defined structural domains. J. Mol. Biol. 1993;229:382–397. doi: 10.1006/jmbi.1993.1041. [DOI] [PubMed] [Google Scholar]
- 29.Powell D.M., Zhang M.J., Dayton A.I. Sequence specificity in the higher-order interaction of the Rev protein of HIV-1 with its target sequence, the RRE. J. Acquir. Immune Defic. Syndr. Hum. Retrovirol. 1995;10:317–323. [PubMed] [Google Scholar]
- 30.Jackson R.J., Kaminski A. Internal initiation of translation in eukaryotes: the picornavirus paradigm and beyond. RNA. 1995;1:985–1000. [PMC free article] [PubMed] [Google Scholar]
- 31.Mandl C.W., Holzmann H., Heinz F.X. Spontaneous and engineered deletions in the 3′ noncoding region of tick-borne encephalitis virus: construction of highly attenuated mutants of a flavivirus. J. Virol. 1998;72:2132–2140. doi: 10.1128/jvi.72.3.2132-2140.1998. [DOI] [PMC free article] [PubMed] [Google Scholar]
- 32.Manzella J.M., Rychlik W., Blackshear P.J. Insulin induction of ornithine decarboxylase. Importance of messenger RNA secondary structure and phosphorylation of eukaryotic initiation factor eIF-4B and factor eIF-4E. J. Biol. Chem. 1991;266:2383–2389. [PubMed] [Google Scholar]
- 33.Van de Guchte M., Van der Lende T., Venema G. A possible contribution of messenger-RNA secondary structure to translation initiation efficiency in Lactococcus lactis. FEMS Microbiol. Lett. 1991;81:201–208. doi: 10.1111/j.1574-6968.1991.tb04746.x. [DOI] [PubMed] [Google Scholar]
- 34.Okamura-Ikeda K., Fujiwara K., Motokawa Y. Molecular cloning of a cDNA encoding chicken T-protein of the glycine cleavage system and expression of the functional protein in Escherichia coli. Effect of mRNA secondary structure in the translational initiation region on expression. J. Biol. Chem. 1992;267:18284–18290. [PubMed] [Google Scholar]
- 35.Pati S., DiSilvestre D., Brusilow W.S. Regulation of the Escherichia coli uncH gene by mRNA secondary structure and translational coupling. Mol. Microbiol. 1992;6:3559–3566. doi: 10.1111/j.1365-2958.1992.tb01791.x. [DOI] [PubMed] [Google Scholar]
- 36.Hofacker I.L., Fontana W., Schuster P. Fast folding and comparison of RNA secondary structures. Monatsh. Chem. 1994;125:167–188. [Google Scholar]
- 37.Wuchty S., Fontana W., Schuster P. Complete suboptimal folding of RNA and the stability of secondary structures. Biopolymers. 1999;49:145–165. doi: 10.1002/(SICI)1097-0282(199902)49:2<145::AID-BIP4>3.0.CO;2-G. [DOI] [PubMed] [Google Scholar]
- 38.Reference deleted in proof.
- 39.Sumedha O.C.M., Martin O.C., Wagner A. New structural variation in evolutionary searches of RNA neutral networks. Biosystems. 2007;90:475–485. doi: 10.1016/j.biosystems.2006.11.007. [DOI] [PubMed] [Google Scholar]
- 40.McCaskill J.S. The equilibrium partition function and base pair binding probabilities for RNA secondary structure. Biopolymers. 1990;29:1105–1119. doi: 10.1002/bip.360290621. [DOI] [PubMed] [Google Scholar]
- 41.Kin T., Yamada K., Asai K. fRNAdb: a platform for mining/annotating functional RNA candidates from non-coding RNA sequences. Nucleic Acids Res. 2007;35(Database issue):D145–D148. doi: 10.1093/nar/gkl837. [DOI] [PMC free article] [PubMed] [Google Scholar]
- 42.Jörg T., Martin O.C., Wagner A. Neutral network sizes of biological RNA molecules can be computed and are not atypically small. BMC Bioinformatics. 2008;9:464. doi: 10.1186/1471-2105-9-464. [DOI] [PMC free article] [PubMed] [Google Scholar]
- 43.Gruner W., Giegerich R., Schuster P. Analysis of RNA sequence structure maps by exhaustive enumeration. I. Neutral networks. Monatsh. Chem. 1996;127:355–374. [Google Scholar]
- 44.Freier S.M., Kierzek R., Turner D.H. Improved free-energy parameters for predictions of RNA duplex stability. Proc. Natl. Acad. Sci. USA. 1986;83:9373–9377. doi: 10.1073/pnas.83.24.9373. [DOI] [PMC free article] [PubMed] [Google Scholar]
- 45.Freeman S., Herron J.C. 4th ed. Pearson; San Francisco, CA: 2007. Evolution. [Google Scholar]
- 46.Kimura M. Cambridge University Press; Cambridge, UK: 1983. The Neutral Theory of Molecular Evolution. [Google Scholar]
- 47.Huynen M.A., Stadler P.F., Fontana W. Smoothness within ruggedness: the role of neutrality in adaptation. Proc. Natl. Acad. Sci. USA. 1996;93:397–401. doi: 10.1073/pnas.93.1.397. [DOI] [PMC free article] [PubMed] [Google Scholar]
- 48.Huynen M.A. Exploring phenotype space through neutral evolution. J. Mol. Evol. 1996;43:165–169. doi: 10.1007/BF02338823. [DOI] [PubMed] [Google Scholar]
- 49.Espinosa-Soto C., Martin O.C., Wagner A. Phenotypic robustness can increase phenotypic variability after nongenetic perturbations in gene regulatory circuits. J. Evol. Biol. 2011;24:1284–1297. doi: 10.1111/j.1420-9101.2011.02261.x. [DOI] [PubMed] [Google Scholar]
- 50.Khersonsky, O., and D. S. Tawfik. 2010.Enzyme promiscuity: A mechanistic and evolutionary perspective. In Annual Review of Biochemistry, Vol. 79. R. D. Kornberg, C. R. H. Raetz, J. E. Rothman, and J. W. Thorner, editors. 471–505. [DOI] [PubMed]
- 51.Sikosek T., Chan H.-S., Bornberg-Bauer E. Escape from Adaptive Conflict follows from weak functional trade-offs and mutational robustness. Proc. Natl. Acad. Sci. USA. 2012;109:14888–14893. doi: 10.1073/pnas.1115620109. [DOI] [PMC free article] [PubMed] [Google Scholar]
- 52.Amitai G., Gupta R., Tawfik D. Latent evolutionary potentials under the neutral mutational drift of an enzyme. HFSP Journal. 2007;1:67–78. doi: 10.2976/1.2739115. [DOI] [PMC free article] [PubMed] [Google Scholar]
- 53.Aharoni A., Gaidukov L., Tawfik D.S. The ‘evolvability’ of promiscuous protein functions. Nat. Genet. 2005;37:73–76. doi: 10.1038/ng1482. [DOI] [PubMed] [Google Scholar]
- 54.Barve A., Wagner A. A latent capacity for evolutionary innovation through exaptation in metabolic systems. Nature. 2013;500:203–206. doi: 10.1038/nature12301. [DOI] [PubMed] [Google Scholar]
- 55.Schaper S., Johnston I.G., Louis A.A. Epistasis can lead to fragmented neutral spaces and contingency in evolution. Proc. Biol. Sci. 2012;279:1777–1783. doi: 10.1098/rspb.2011.2183. [DOI] [PMC free article] [PubMed] [Google Scholar]
- 56.Parsch J., Braverman J.M., Stephan W. Comparative sequence analysis and patterns of covariation in RNA secondary structures. Genetics. 2000;154:909–921. doi: 10.1093/genetics/154.2.909. [DOI] [PMC free article] [PubMed] [Google Scholar]
- 57.Kondrashov A.S., Sunyaev S., Kondrashov F.A. Dobzhansky-Muller incompatibilities in protein evolution. Proc. Natl. Acad. Sci. USA. 2002;99:14878–14883. doi: 10.1073/pnas.232565499. [DOI] [PMC free article] [PubMed] [Google Scholar]
- 58.Kern A.D., Kondrashov F.A. Mechanisms and convergence of compensatory evolution in mammalian mitochondrial tRNAs. Nat. Genet. 2004;36:1207–1212. doi: 10.1038/ng1451. [DOI] [PubMed] [Google Scholar]
- 59.Meer M.V., Kondrashov A.S., Kondrashov F.A. Compensatory evolution in mitochondrial tRNAs navigates valleys of low fitness. Nature. 2010;464:279–282. doi: 10.1038/nature08691. [DOI] [PubMed] [Google Scholar]
- 60.Tacker M., Stadler P., Schuster P. Algorithm independent properties of RNA secondary structure predictions. Eur. Biophys. J. 1996;25:115–130. [Google Scholar]
- 61.Manrubia, S. C., and J. A. Cuesta. 2013. Evolution on genotype networks leads to phenotypic entrapment. (http://arxiv.org/abs/1307.0968) (submitted).
- 62.Ancel L.W. Undermining the Baldwin expediting effect: does phenotypic plasticity accelerate evolution? Theor. Popul. Biol. 2000;58:307–319. doi: 10.1006/tpbi.2000.1484. [DOI] [PubMed] [Google Scholar]
- 63.Riley G.R., Corell R.A., Stuart K. Multiple guide RNAs for identical editing of Trypanosoma brucei apocytochrome b mRNA have an unusual minicircle location and are developmentally regulated. J. Biol. Chem. 1994;269:6101–6108. [PubMed] [Google Scholar]
- 64.Benson D.A., Cavanaugh M., Sayers E.W. GenBank. Nucleic Acids Res. 2013;41(Database issue):D36–D42. doi: 10.1093/nar/gks1195. [DOI] [PMC free article] [PubMed] [Google Scholar]
Associated Data
This section collects any data citations, data availability statements, or supplementary materials included in this article.