

Abstract
Mechanosensitive channel proteins are important safety valves against osmotic shock in bacteria, and are involved in sensing touch and sound waves in higher organisms. The mechanosensitive channel of small conductance (MscS) has been extensively studied. Pulsed electron-electron double resonance (PELDOR or DEER) of detergent-solubilized protein confirms that as seen in the crystal structure, the outer ring of transmembrane helices do not pack against the pore-forming helices, creating an apparent void. The relevance of this void to the functional form of MscS in the bilayer is the subject of debate. Here, we report PELDOR measurements of MscS reconstituted into two lipid bilayer systems: nanodiscs and bicelles. The distance measurements from multiple mutants derived from the PELDOR data are consistent with the detergent-solution arrangement of the protein. We conclude, therefore, that the relative positioning of the transmembrane helices is preserved in mimics of the cell bilayer, and that the apparent voids are not an artifact of detergent solution but a property of the protein that will have to be accounted for in any molecular mechanism of gating.
Introduction
The Escherichia coli mechanosensitive channel of small conductance (MscS) has served as an influential model for gating of channels, especially those that are gated by mechanical means. To date, there are eight reported crystal structures of MscS: four in a closed state (2oau (1), 3udc, 3t9n (2), and 4hw9 (3)) and four in an open state (2vv5 (4), 4hwa (3), 4age, and 4agf (5)). Six of these were E. coli MscS, but 4hw9 and 3t9n were homologs from other organisms. The first crystal structure of this channel (1) showed that the functional channel form is a homoheptamer, and that each monomer consists of three N-terminal transmembrane helices (TM1, TM2, and TM3) and two C-terminal cytoplasmic domains. TM3 has a significant kink at Gly-113 and thus was redefined as two helices called TM3a and TM3b. The TM3 helices interact to form the pore of the channel. The pore has a constriction point (∼11 Å) created by the side chains of residues Leu-105 and Leu-109. A comparison of the closed and open crystal structures (2oau and 2vv5, respectively) suggested that the gating process (closed to open) is characterized by a concerted rotation of TM1-TM2 (almost as a rigid body) with a concomitant twist and pivot of TM3a about G113. This movement of TM3a causes the side chains of residues L105 and L109 to move outward from the central pore of the heptamer, thereby opening a route for ions and small molecules to exit the cell and hence release internal pressure. It is noteworthy that TM3b does not significantly move between closed and open crystal structures. In both crystal structures, TM1 and TM2 are splayed out from the central axis of the channel, akin to exposed paddles, creating a large apparent void between these helices and TM3. The presence and functional relevance of this void in MscS within the lipid bilayer have been challenged (6–8) by results from extrapolated motion dynamics (EMD) and continuous-wave electron paramagnetic resonance (cwEPR), which, unlike crystallography, can be applied to lipid-embedded proteins. The voids either do not exist or are very much smaller in the structural models generated by these approaches. The relatively low resolution of the crystal structures determined to date preclude visualization of any nonprotein molecules; therefore, although they are described as a void, they could be filled with weakly ordered molecules. The very different models that have emerged from these multiple approaches have hindered progress (see Fig. 1), and central to any understanding is resolving whether the voids are real or artifacts.
Figure 1.
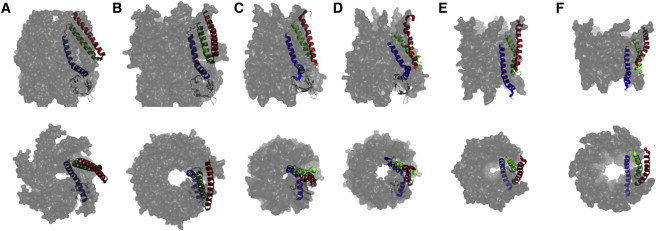
Crystal structures and models of E. coli MscS show different structural arrangements of the transmembrane helices in both the closed and open states. (A) Crystal structure of the closed state (2oau). (B) Crystal structure of the open state (2vv5). (C and D) Closed and open structural models, respectively, derived from cwEPR restraints. (E and F) Closed and open structural models, respectively, generated by EMD. For one monomer the transmembrane helices 1, 2, and 3 are highlighted while the rest of the channel is gray. Both perpendicular (top) and parallel (bottom) views, relative to the central axis, are shown. To see this figure in color, go online.
Pulsed electron-electron double resonance spectroscopy (PELDOR or DEER) can measure distances between spin labels on the nanometer scale (1.5–8 nm) (9,10). One of the first oligomeric membrane protein systems this approach was applied to was the major light-harvesting chlorophyll a/b complex (LHCII). By measuring multiple distances within this complex, previous researchers proposed that the N-terminus, for which there is no electron density, is in two conformational states (11,12). The tetrameric potassium ion channel proteins KvAP (13) and KcsA (14,15), and the octameric translocation channel protein Wza (16) have also been characterized by this approach. However, these multispin (i.e., more than two spins) systems are more complex than a standard two-spin system both in theory and in practice, with additional effects that should be taken into account during data analysis (17,18). In a recent PELDOR study (5) of MscS in detergent (n-Dodecyl-β-D-maltoside (DDM)) solution, MscS was found to be predominantly in a form resembling the open crystal structure (2vv5). That study firmly established that the arrangement of the helices and the resulting void were not an artifact of crystal packing, but existed in detergent solution as well as in the crystal. Careful examination of the data suggested that in detergent solution, MscS may exist in both closed and open forms. In contrast to the crystal structures, the structures generated from cwEPR or EMD data were inconsistent with the PELDOR measurements. Although detergent extraction of some oligomeric membrane proteins produces no discernible change in their activity (19), in some cases it can lead to disaggregation of the target protein and subsequent loss of activity (20). Thus, it remains plausible that the voids are artifacts of detergent micelles. The extension of PELDOR to lipid-bilayer-embedded MscS is thus critical for probing the arrangements of the transmembrane helices and confirming or disproving the presence of the voids.
Liposomes, perhaps the best-known mimic of the cell membrane, are known to be inherently unstable and can change morphology over the timescale of sample preparation (21). In addition, PELDOR studies of liposome-embedded proteins have reported significant shortening of the spin label’s phase memory time (Tm) due to molecular crowding effects (9,12,22). This is a critical experimental limitation, especially for challenging multispin systems. Therefore, more recent PELDOR studies on membrane proteins have used lipid-bilayer mimetics such as bicelles (23,24) or nanodiscs (25) to overcome the problems of molecular crowding.
Here, we report PELDOR measurements of MscS reconstituted into both bicelles (26) and nanodiscs (27). These results were used to test the validity of the splayed-out arrangement of the TM1 and TM2 helices relative to the pore TM3a helix within a lipid bilayer environment.
Materials and Methods
All chemicals were purchased from Sigma-Aldrich unless otherwise stated. 1-Oxyl-2,2,5,5-tetramethyl-Δ3-pyrroline-3-methyl)methane-thiosulfonate (MTSL) was obtained from Toronto Research Chemicals (Toronto, Canada). 1,2-Dimyristoyl-sn-glycero-3-phosphocholine (DMPC) lipids were purchased from Avanti Polar Lipids (Alabaster, AL). 3-[(3-cholamideopropyl)-dimethylammonio]-2-hydroxy-1-propanesulfonate (CHAPSO) and DDM detergents were purchased from Anatrace (www.affymetrix.com). Copper grids were purchased from Agar Scientific (Stansted, UK). Nickel-NTA nanogold was purchased from Nanoprobes (Cambridge, UK). The MSP1D1E3 plasmid (addgene plasmid 20066) was obtained from addgene. Penta-His antibody used for expression tests was obtained from Qiagen.
Protein expression and purification
All E. coli MscS single cysteine mutants were grown, expressed, purified, and spin labeled with MTSL on nickel affinity resin as previously described (5). Spin labeling efficiency was tested using a method recently described (28).
Reconstitution of MscS into bicelles
A 10% (w/v) CHAPSO solution was made up in Buffer A (100 mM TES pH 7.4, 100 mM NaCl). DMPC lipids were mixed with the 10% (w/v) CHAPSO solution to make a 40% (w/v) stock solution using cycles of cooling on ice, vortexing, sonication, and centrifugation until a mixture with the properties of a clear liquid-like solution or a viscous gel was obtained at ∼16°C and 4°C, respectively (29). CHAPSO was chosen over DHPC because it is far less hygroscopic and thus easier to work with. The 40% (w/v) bicelle solution was added to spin-labeled MscS in Buffer B (100 mM TES, pH 7.4, 100 mM NaCl, 0.05% DDM) at a concentration of 15–17 mg ml−1 and Buffer A. The sample was mixed until a homogeneous solution was obtained. Deuterated ethylene glycol was then added to a final concentration of 25% v/v. The final spin concentration was calculated to be ∼200 μM and the final bicelle concentration was 8% (w/v). The PELDOR sample was prepared as described previously (16).
Reconstitution of MscS into nanodiscs
MSP1D1E3 proteins were prepared as previously described (30,31). A 1:2 ratio of MscS monomer to MSP1D1E3 protein was used. A stock of 0.47 M cholate was added to MSP1D1E3 to a final concentration of 110 mM cholate. DMPC was dissolved in buffer C (50 mM sodium phosphate pH 7.5, 300 mM NaCl, 0.1 M sodium cholate) by vortex and sonication, and then added to the MSP1 protein to give a molar ratio of 150:1 of DMPC to MSP1E3. Subsequently, 2 mg of MscS in Buffer D (0.05% DDM, 50 mM sodium phosphate pH 7.5, 300 mM NaCl) was added to the MSP1D1E3 lipid mixture, and Buffer C was added to the mixture such that the concentration of DDM in the sample was diluted to below the critical micelle concentration. The reconstitution mixture was incubated at 21°C for 2 hr. After extensive dialysis against PBS at 21°C overnight, the buffer was exchanged into Buffer A and the reconstitution was concentrated to ∼30 mg ml−1. Deuterated ethylene glycol was then added to a final concentration of 50%. The PELDOR sample was prepared as described previously (16).
Electron microscopy
The structures of nanodiscs and bicelles were analyzed by transmission electron microscopy (TEM) using negative staining. Pioloform-coated 100-mesh copper grids (Agar Scientific) were placed face down on droplets containing nanodiscs or bicelles, with or without incorporated MscS, and incubated for 2 min at room temperature to allow binding of the structures to the grids. The grids were subsequently washed with distilled water and contrasted on droplets containing nine parts of 2% w/v methyl cellulose and one part of 3% w/v uranyl acetate (on ice) (32). For gold labeling of MscS-His-tagged protein, the nanodisc and bicelle samples were first applied to EM copper grids as described above, washed, and subsequently transferred to droplets of 5 nm nickel-NTA nanogold (Nanoprobes, Cambridge, UK). After a 30 min incubation at room temperature, the grids were washed and contrasted as described above. In three individual experiments, nanodisc and bicelle structures (empty as well as with incorporated MscS-His) were subjected to systematic uniform random (SUR) sampling (33) by taking 10 micrographs per sample using a JEOL 1200EX transmission electron microscope with a Gatan Orius 200 digital camera (Gatan, Abingdon Oxon, UK) at a nominal magnification of 20,000×. For quantification of the nanogold labeling, both nanodiscs and bicelles were subsampled using the forbidden line unbiased counting rule applied to quadrats-positioned SUR (∼9 quadrats per micrograph, 0.0016 μm2 per quadrat) on micrographs that were displayed in Photoshop CS6. For each experiment, 53–99 nanodiscs and 63–90 bicelles were used. For the bicelle structures with incorporated MscS, all structures that could be positively identified were sampled until 100 nonlabeled bicelles had been counted per experiment (n = 118–122). Images were selected to be representative of the quantitative data unless stated otherwise.
PELDOR spectroscopy
PELDOR experiments were performed at 50 K as previously described (5). The spin-spin interaction in a multispin system is the product of the pair interactions. Standard analysis within DeerAnalysis2013 treats such multiple interactions in the form of their sums (not products) leading to artifacts in the output distance distributions. However, this program also has a power scaling option to take multispin effects into account (34) (see Fig. S1 in the Supporting Material). To reduce these multispin contributions from the raw data, it has been suggested (34) that for a system with greater than five spins, an inversion efficiency (λ) of 0.4 or less should be used. For our system, the λ for a π pump pulse of 16 ns, which was the shortest pulse length used for our experiments, was calculated to be 0.4 for a synthetic biradical, i.e., where there should be 100% labeling. Since the labeling efficiency for our system is at best 95%, we would anticipate the effective λ to be lower than this and thus the multispin effects to be minimized. To test this, we obtained control data sets with a λ = 0.2 (by using a reduced pump pulse power, but the same pulse length) for mutants S196 and S147, which showed that although the 1-2 distance did not change, the 1-3 and 1-4 distances were altered. Previous studies on model systems (35) and the octameric Wza protein (16) also concluded that the 1-2 distance vector was the least effected by multispin contributions for similar values of λ. Hence, in this work we relied only on the 1-2 distance vector.
Modeling of distance distributions using MtsslWizard
In silico spin labeling, rotamer conformation searching, and distance measurements were all carried out within the software package PyMOL (www.pymol.org) using the mtsslWizard plugin (36,37). Rotamer conformations were allowed according to suggested defaults. Distance distributions were obtained by binning the data into 1 Å bins. The following atomic coordinates of MscS were used for this modeling procedure: the crystal structures of E. coli MscS (2OAU and 2VV5), the closed and open models generated by extrapolated motion dynamics (8), and the cwEPR closed and open models (6,7).
Cell viability assays and electrophysiological studies
Western blot analysis of whole-cell samples with Penta-His antibody was carried out to examine the expression of mutants. For MscS cysteine mutants S196, S147, D67, S58C, and M47, the survival assay for osmotic downshock was used as previously described (5). For A51C and I61C, the assay was essentially the same as described previously with minor modifications (see Fig. S2).
Results and Discussion
Labeling and characterization of bicelle- and nanodisc-reconstituted MscS
Cysteine mutants of residues M47, A51, S58, I61, D67, S147, and S196 (Fig. 2, A and B) were cloned, expressed, purified, and spin labeled with MTSL to gain information about both the transmembrane and cytoplasmic regions of the protein. Except for A51 and I61, these are the same mutants that were used in the previous PELDOR study of MscS in detergent (5), enabling a direct comparison.
Figure 2.
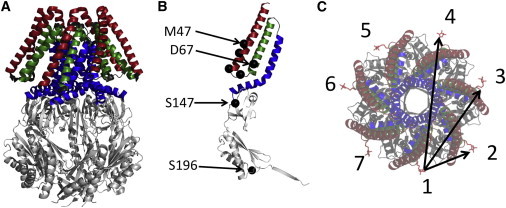
Crystal structure of MscS and spin-label locations. (A) 2oau closed crystal structure. Transmembrane helices 1, 2, and 3 are highlighted. Cytoplasmic domains are shown in light gray. (B) Monomer of MscS showing spin-labeling sites, which are shown as black spheres. (C) Incorporation of a single cysteine into an MscS monomer and subsequent spin labeling will lead to a heptamer with seven spin labels and three different spin-spin distances. To see this figure in color, go online.
In the case of a heptamer, such as MscS (Fig. 2 A), if a single label is attached to each monomer, there will be seven spin labels in the heptamer. Due to the symmetry of the heptamer, three different distance vectors (1-2, 1-3, and 1-4) arise, with vectors 1-5, 1-6, and 1-7 being symmetry related to the former ones (Fig. 2 C). Out of these three distances, the 1-2 vector can be reliably determined with PELDOR (5,13), whereas the others are prone to larger errors due to 1), multispin effects (31); 2), too-short time traces to accommodate one full period of the dipolar oscillation of these longer distances (10); and 3), related to this, artifacts induced by the division of the time trace by the intermolecular background function. Therefore, we rely only on the 1-2 distance.
Each labeled protein was incorporated into both nanodiscs and bicelles, using DMPC as the lipid. Incorporation was verified by negatively stained EM coupled with NTA-nanogold labeling, which also showed that 94% of the nanogold particles (and therefore MscS) was associated with the nanostructures (Fig. 3; see Fig. S10). The remaining 6% of the nanogold particles may be nonlipid-associated MscS or the result of nonspecific binding of the nanogold to the film. The absence of free spin label was checked with cwEPR, and based on double integration and comparison with a standard sample, the labeling degree was established to be between 45% (M47R1) and 95% (S196R1) depending on the mutant.
Figure 3.
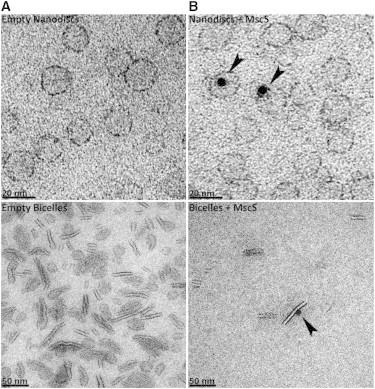
Analysis of MscS-His-tag incorporation into nanodiscs and bicelles using 5 nm nickel-NTA nanogold. (A and B) Nanodiscs (top) and bicelles (bottom) in the absence (A) or presence (B) of reconstituted MscS. The micrographs were selected to illustrate the gold labeling specificity. Black arrows indicate positively labeled nanostructures. The scale bar in the bottom left-hand corner of each micrograph indicates 20 nm and 50 nm for the nanodisc and bicelle samples, respectively.
PELDOR-derived distance distributions and comparisons with modeled distances
To obtain reliable and accurate distance distributions, data were measured out to times that were long enough to include at least one period of the dipolar oscillation for the shortest distance (1,2). Signals were averaged for a sufficiently long period of time to ensure that any oscillation would be visible by eye above the noise. The experimental data are shown in Figs. 4 and 5 and the derived modal 1-2 distances are shown in Table 1. Only time traces in which oscillations were judged to be visible were employed in our analysis (see Figs. S3–S9). Consequently, M47R1 in bicelles and nanodiscs, A51R1 in DDM and nanodiscs, and I61R1 in DDM were excluded from our distance distribution analysis. All other time traces were analyzed with DeerAnalysis2013 (34). The power-scaling feature of DeerAnalysis was investigated to correct for multispin effects, but for the 1-2 distribution it made no significant difference (see Fig. S1). MtsslWizard was used to calculate the 1-2 distance distributions of six structural models for MscS (Table 2; Fig. S11) (5,36,37). A comparison of the PELDOR-derived and mtsslWizard-simulated distance distributions is shown in Fig. 6 for each mutant.
Figure 4.
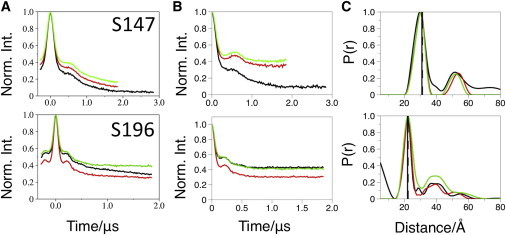
PELDOR data for control mutants S147R1 and S196R1. (A) Original PELDOR data. (B) Offset background-corrected time traces and simulated fits in blue. (C) DeerAnalysis-derived distance distributions. The data presented are from detergent-solubilized (black lines), bicelle-reconstituted (red lines), or nanodisc-reconstituted (green lines) MscS. In the distance distribution, the vertical lines represent the modal distances predicted from mtsslWizard (36,37) for the crystal structures.
Figure 5.
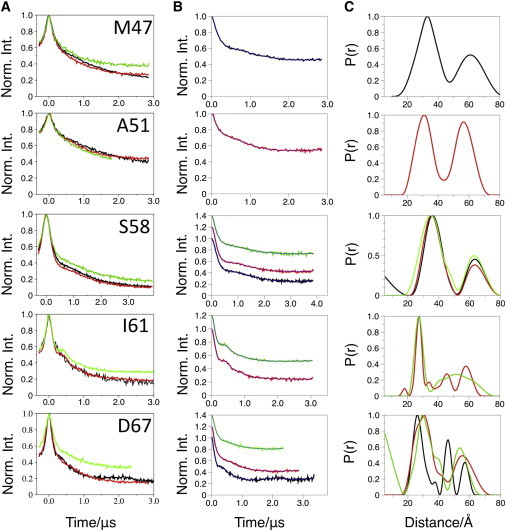
PELDOR data for mutants that differentiate between the model structures. (A) Original PELDOR data. (B) Offset background-corrected time traces with simulated fits in blue. (C) DeerAnalysis-derived distance distributions. The data presented are from detergent-solubilized (black lines), bicelle-reconstituted (red lines), or nanodisc-reconstituted (green lines) MscS.
Table 1.
PELDOR-derived modal distances in angstroms for the 1-2 distance vector of MscS in different lipid environments
| Mutant | Detergent | Bicelles | Nanodiscs |
|---|---|---|---|
| M47R1 | 33 | n/a | n/a |
| A51R1 | n/a | 31 | n/a |
| S58R1 | 36 | 35 | 35 |
| I61R1 | n/a | 27 | 27 |
| D67R1 | 26 | 31 | 29 |
| S147R1 | 30 | 30 | 30 |
| S196R1 | 22 | 22 | 22 |
n/a, not applicable.
Table 2.
MtsslWizard-simulated 1-2 distances in angstroms for each mutant in the open and closed states of the different structural models
| Mutant | X-ray |
X-ray |
cwEPR |
cwEPR |
EMD |
EMD |
|---|---|---|---|---|---|---|
| Closed | Open | Closed | Open | Closed | Open | |
| M47R1 | 27 | 34 | 25 | 27 | 29 | 34 |
| A51R1 | 28 | 32 | 20 | 26 | 29 | 34 |
| S58R1 | 37 | 37 | 26 | 31 | 26 | 28 |
| I61R1 | 36/26a | 26 | 33 | 33 | 27 | 29 |
| D67R1 | 33 | 26 | 28 | 31 | 24 | 32 |
| S147R1 | 31 | 31 | 30 | 33 | n/a | n/a |
| S196R1 | 22 | 22 | n/a | n/a | n/a | n/a |
Distance derived for the remodeled loop region upon which I61 sits (see text and Fig. S12 for more details).
Figure 6.
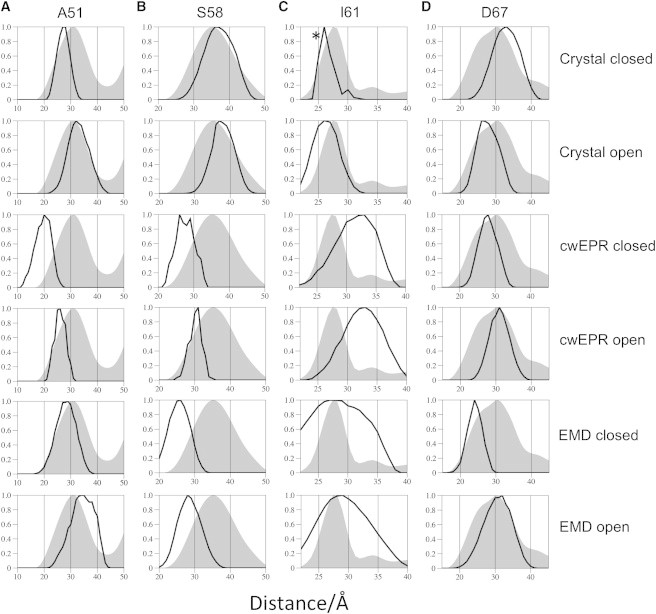
Comparison of experimental (gray shaded areas) and simulated (black line) distance distributions. Column A shows the 1-2 distance vector determined by PELDOR for A51R1 (reconstituted into bicelles) overlaid with the mtsslWizard-simulated distance distributions for each model (specified on the far right). Columns B–D make similar comparisons, but for S58R1, I61R1, and D67R1, respectively. Only the 1-2 distance vector is used because this is the most reliable and accurate experimental distance distribution. ∗I61 modal distance obtained from a hybrid closed structure using the loop from the higher-resolution 2vv5 (open) structure. See Fig. S12.
S196R1 and S147R1 are valuable controls for the method because they are located in the cytoplasmic region of the protein and are predicted to be unperturbed by incorporation into the lipid-bilayer mimics. The PELDOR data recorded from both mutants in both lipid environments show very similar time traces (Fig. 4). Interestingly, the depth of modulation is slightly deeper for the bicelle samples when compared with the nanodisc samples. Converting the time traces into distance distributions shows that they match precisely the predicted distances and the distances from MscS solubilized in DDM (Table 2). These results are evidence that our experimental approach, including the treatment of the data, is reliable.
A51R1, S58R1, I61R1, and D67R1 are located on TM1 and TM2, and report on the helical arrangement of the MscS structure in the lipid environment (Fig. 5). S58R1, I61R1, and D67R1 showed oscillations in both lipid environments, and the bicelle samples yielded a deeper modulation than the nanodisc. Disappointingly, we have been unable to rationalize why some mutants in some conditions give visible oscillations and others do not, nor have we been able to develop empirical rules to guide future experiments.
Converting the time traces into distance distributions confirms that, as observed in detergent solution, for S58R1 the experimental distance distribution does not match those derived from the EMD or cwEPR models, and the data for I61R1 do not match those obtained from either of the cwEPR models. The other mutants do not show any consistent match to the noncrystallographic models. The S58R1 experimental distance distribution agrees very well with the distance distributions derived from the crystallographic models (the open and closed structures give rise to the same distance distribution). The PELDOR-derived experimental distance distribution for A51R1 peaks at a most probable distance of 31 Å and shows a shoulder toward shorter distances. We interpret this distance distribution to mean that both crystal structures of MscS (the open and closed forms) are present in the lipid-bilayer mimics. Indeed, adding the in silico-derived distance distributions for both x-ray models in a ratio of ∼1:2 (2oau:2vv5) resembles the PELDOR-derived distance distribution very well (see Fig. S13 A). The PELDOR distance distribution for D67R1 possesses a pronounced shoulder. The shoulder can be matched by adding the distributions from both x-ray structures in a ratio of ∼1:1 (2oau:2vv5) (see Fig. S13 B). I61 is positioned in a loop, which is noted to be flexible, and has a different orientation in the closed and open crystal structures. A reexamination of the electron density of the lower-resolution closed structure in light of the PELDOR data for I61R1, which clearly matches the open structure, reveals that the conformation of the loop seen in the open structure fits the electron density at least as well as that originally modeled. Thus, the predicted distributions for the open and closed structures of I61R1 are most likely the same and match the observed PELDOR distribution.
When compared with the detergent samples, the lipid-embedded samples in general exhibit shallower modulations and more damped oscillations. The data consistently show that bicelles give rise to a slightly larger modulation depth than nanodiscs. The decreased modulation may indicate that MscS is less aggregated in nanodiscs (which because of its size can only hold a single multimer (30)) than in bicelles or DDM micelles. Damped oscillations result in broader distance distributions and could indicate increased conformational flexibility within lipid bilayers.
The observation that I61R1 gives a strikingly sharper oscillation in the lipid-bilayer mimics is reminiscent of that observed by Georgieva et al. (38) for the E296 spin-labeled mutant in the sodium-coupled aspartate transporter, GltPh. In that case, the authors speculated that the spin label’s mobility could be restricted by interacting with both the trimerization and transport domains simultaneously. They also excluded the possibility that the spin label was interacting with the lipids, since the crystal structures do not suggest that it would be in close proximity to them. In the MscS case, I61 is in the loop between TM1 and TM2, and points toward the TM3b helix, but does not obviously interact with any other portion of the protein. Since the position of the lipids with respect to the structure has not been experimentally established, we cannot exclude the possibility that I61R1 has a specific interaction with the lipids. A similar discussion cannot be made for A51R1, since only a marginal improvement in the oscillation was observed.
Overall, our PELDOR data establish that the crystal structures accurately predict the distance distributions measured for MscS in the lipid-bilayer mimics. The data suggest that, as in detergent, MscS may exist in a mixture of conformational states. Something similar was observed for the aspartate transporter GltPh in previous studies (38,39), in which the widths of the distance distributions were rationalized in terms of each monomer being able to adopt either an inward-facing or outward-facing state, and to isomerize between the two states independently of each other (i.e., the oligomer is asymmetric in the transport domain). MscS is also known to exist in a nonconducting substate (40,41), so it is plausible that there is some heterogeneity in the conformational state even in the lipid bilayer. It could be argued that suppression of the multispin effects, which can lead to distortions in the distance distributions obtained (34,35), might allow us to obtain more reliable 1-3 distances, and thus it would be possible to identify and quantitate more robustly the conformational state of MscS in the lipid-bilayer mimics. We could have reduced the multispin effects by underlabeling the heptamer; however, this would have resulted in a decreased signal/noise ratio, since increasing the protein concentration significantly was not possible, and thus would have resulted in less reliable distance distributions. An alternative approach, in principle, would be to mix labeled and nonlabeled monomers; however, a reversible dissociation of the heptamer has not been described. Even though it would be desirable to have a data set that is definitely free of multispin effects, it is still the case that the 1-3 distance is inherently less reliable than the 1-2 distance, since less of the dipolar coupling frequency is described by the PELDOR time window and it is more affected by the choice of background correction imposed. There is clearly a need for improved experimental approaches for these most challenging systems.
It has been shown that MscS can be isolated from cells and reconstituted into liposomes with full recovery of activity (42,43). We therefore assume that neither extraction nor reconstitution into lipid bilayers would in and of itself disrupt the function and hence the structure of MscS. If this is true, the successful prediction of distance distributions by the crystal structures indicates that the voids observed in both open and closed structures are preserved inside the lipid bilayer. In particular, the data from D67R1, I61R1, and A51R1 are all consistent with the splayed-out conformation of TM1/TM2 observed in the detergent micelle crystal structure and PELDOR analyses. In one sense this is not surprising, since no differences between detergent micelles and lipid bilayers, as judged by PELDOR analyses, have been observed for other membrane proteins, including the maltose ABC transporter MalFGK2-E (44), the lipid flippase ABC transporter MsbA (45), and the potassium ion channel KcsA (14). However, experimental confirmation was important since there are well-known examples of significant conformational changes occurring. Most notably, the two α-helices of α-synuclein adopt an antiparallel arrangement that is sensitive to the physical nature of the detergent micelle to which it is bound. For example, it has been shown that the α-helices are splayed farther apart when bound to lyso-1-palmitoylphosphotidylglycerol (LPPG), as compared with sodium dodecyl sulfate micelles, which is consistent with the larger LPPG micelle size (46). More recently, two independent studies presented PELDOR data for the homotrimeric sodium-coupled aspartate transporter GltPh (38,39), which demonstrated that the transport domain was highly dynamic in detergent micelles, but the populations of these states were altered when the protein was reconstituted into lipid bilayers. For a protein such as MscS, where the structure in detergent is unusual and true voids between helices are unlikely in the lipid bilayer, PELDOR of the protein in the bilayer provides an important structural tool. Our data lead us to conclude that MscS in the lipid bilayer does adopt a structure that is usefully modeled by the crystal structures determined in detergent solution. This implies that the transmembrane helices are not closely packed and thus could allow (and structural stability may even require) nonprotein molecules to fill these spaces. Any model for MscS gating will have to identify and account for these molecules.
Conclusions
Bicelles, nanodiscs, and liposomes are well-characterized experimental systems that are extensively used to study membrane proteins by a wide range of techniques. We have verified by EM that the spin-labeled MscS protein is embedded within the bilayer in both bicelles and nanodisc systems. The key advantage of bicelles and nanodiscs over liposomes for PELDOR is that the former systems do not increase molecular crowding as much within the lipid bilayer. Using these systems, we obtained multiple measurements from spin labels that were attached to residues that were fully embedded in the lipid-bilayer mimics rather than at the lipid-solvent interface. The signal/noise ratio for these measurements is high, and thus for those with clearly visible oscillations in the raw data, it is possible to extract highly accurate distances. This allows us to test whether the voids between the outer ring of transmembrane helices and the pore-forming helices in MscS, as observed in the crystal structures, genuinely exist within the lipid-bilayer mimics. Our data clearly show that the crystal structures of MscS are reliable models for this protein within the lipid environment, even though MscS was extracted from the cell membrane by detergent.
Acknowledgments
We thank EaStCHEM for a studentship to E.B. The work was funded by BBSRC grant BB/H017917/1 to JNH, OS & IRB, The Leverhulme Foundation (EM-2012-60\2) and equipment from a Wellcome Trust Capital Award.
Footnotes
R. Ward, C. Pliotas, and E. Branigan contributed equally to this work
This is an Open Access article distributed under the terms of the Creative Commons-Attribution Noncommercial License (http://creativecommons.org/licenses/by-nc/2.0/), which permits unrestricted noncommercial use, distribution, and reproduction in any medium, provided the original work is properly cited.
Contributor Information
James H. Naismith, Email: jhn@st-andrews.ac.uk.
Olav Schiemann, Email: schiemann@pc.uni-bonn.de.
Supporting Material
References
- 1.Bass R.B., Strop P., Rees D.C. Crystal structure of Escherichia coli MscS, a voltage-modulated and mechanosensitive channel. Science. 2002;298:1582–1587. doi: 10.1126/science.1077945. [DOI] [PubMed] [Google Scholar]
- 2.Zhang X., Wang J., Yang M. Structure and molecular mechanism of an anion-selective mechanosensitive channel of small conductance. Proc. Natl. Acad. Sci. USA. 2012;109:18180–18185. doi: 10.1073/pnas.1207977109. [DOI] [PMC free article] [PubMed] [Google Scholar]
- 3.Lai J.Y., Poon Y.S., Rees D.C. Open and shut: crystal structures of the dodecylmaltoside solubilized mechanosensitive channel of small conductance from Escherichia coli and Helicobacter pylori at 4.4 Å and 4.1 Å resolutions. Protein Sci. 2013;22:502–509. doi: 10.1002/pro.2222. [DOI] [PMC free article] [PubMed] [Google Scholar]
- 4.Wang W., Black S.S., Booth I.R. The structure of an open form of an E. coli mechanosensitive channel at 3.45 A resolution. Science. 2008;321:1179–1183. doi: 10.1126/science.1159262. [DOI] [PMC free article] [PubMed] [Google Scholar]
- 5.Pliotas C., Ward R., Naismith J.H. Conformational state of the MscS mechanosensitive channel in solution revealed by pulsed electron-electron double resonance (PELDOR) spectroscopy. Proc. Natl. Acad. Sci. USA. 2012;109:E2675–E2682. doi: 10.1073/pnas.1202286109. [DOI] [PMC free article] [PubMed] [Google Scholar]
- 6.Vásquez V., Sotomayor M., Perozo E. Three-dimensional architecture of membrane-embedded MscS in the closed conformation. J. Mol. Biol. 2008;378:55–70. doi: 10.1016/j.jmb.2007.10.086. [DOI] [PMC free article] [PubMed] [Google Scholar]
- 7.Vásquez V., Sotomayor M., Perozo E. A structural mechanism for MscS gating in lipid bilayers. Science. 2008;321:1210–1214. doi: 10.1126/science.1159674. [DOI] [PMC free article] [PubMed] [Google Scholar]
- 8.Akitake B., Anishkin A., Sukharev S. Straightening and sequential buckling of the pore-lining helices define the gating cycle of MscS. Nat. Struct. Mol. Biol. 2007;14:1141–1149. doi: 10.1038/nsmb1341. [DOI] [PubMed] [Google Scholar]
- 9.Jeschke G. DEER distance measurements on proteins. Annu. Rev. Phys. Chem. 2012;63:419–446. doi: 10.1146/annurev-physchem-032511-143716. [DOI] [PubMed] [Google Scholar]
- 10.Schiemann O., Prisner T.F. Long-range distance determinations in biomacromolecules by EPR spectroscopy. Q. Rev. Biophys. 2007;40:1–53. doi: 10.1017/S003358350700460X. [DOI] [PubMed] [Google Scholar]
- 11.Jeschke G., Bender A., Paulsen H. Localization of the N-terminal domain in light-harvesting chlorophyll a/b protein by EPR measurements. J. Biol. Chem. 2005;280:18623–18630. doi: 10.1074/jbc.M501171200. [DOI] [PubMed] [Google Scholar]
- 12.Dockter C., Müller A.H., Paulsen H. Rigid core and flexible terminus: structure of solubilized light-harvesting chlorophyll a/b complex (LHCII) measured by EPR. J. Biol. Chem. 2012;287:2915–2925. doi: 10.1074/jbc.M111.307728. [DOI] [PMC free article] [PubMed] [Google Scholar]
- 13.Vamvouka M., Cieslak J., Gross A. The structure of the lipid-embedded potassium channel voltage sensor determined by double-electron-electron resonance spectroscopy. Protein Sci. 2008;17:506–517. doi: 10.1110/ps.073310008. [DOI] [PMC free article] [PubMed] [Google Scholar]
- 14.Endeward B., Butterwick J.A., Prisner T.F. Pulsed electron-electron double-resonance determination of spin-label distances and orientations on the tetrameric potassium ion channel KcsA. J. Am. Chem. Soc. 2009;131:15246–15250. doi: 10.1021/ja904808n. [DOI] [PMC free article] [PubMed] [Google Scholar]
- 15.Dalmas O., Hyde H.C., Perozo E. Symmetry-constrained analysis of pulsed double electron-electron resonance (DEER) spectroscopy reveals the dynamic nature of the KcsA activation gate. J. Am. Chem. Soc. 2012;134:16360–16369. doi: 10.1021/ja3069038. [DOI] [PMC free article] [PubMed] [Google Scholar]
- 16.Hagelueken G., Ingledew W.J., Naismith J.H. PELDOR spectroscopy distance fingerprinting of the octameric outer-membrane protein Wza from Escherichia coli. Angew. Chem. Int. Ed. Engl. 2009;48:2904–2906. doi: 10.1002/anie.200805758. [DOI] [PMC free article] [PubMed] [Google Scholar]
- 17.Jeschke G., Sajid M., Godt A. Three-spin correlations in double electron-electron resonance. Phys. Chem. Chem. Phys. 2009;11:6580–6591. doi: 10.1039/b905724b. [DOI] [PubMed] [Google Scholar]
- 18.Bode B.E., Margraf D., Schiemann O. Counting the monomers in nanometer-sized oligomers by pulsed electron-electron double resonance. J. Am. Chem. Soc. 2007;129:6736–6745. doi: 10.1021/ja065787t. [DOI] [PubMed] [Google Scholar]
- 19.Joseph B., Jeschke G., Bordignon E. Transmembrane gate movements in the type II ATP-binding cassette (ABC) importer BtuCD-F during nucleotide cycle. J. Biol. Chem. 2011;286:41008–41017. doi: 10.1074/jbc.M111.269472. [DOI] [PMC free article] [PubMed] [Google Scholar]
- 20.Klare J.P., Bordignon E., Engelhard M. Effects of solubilization on the structure and function of the sensory rhodopsin II/transducer complex. J. Mol. Biol. 2006;356:1207–1221. doi: 10.1016/j.jmb.2005.12.015. [DOI] [PubMed] [Google Scholar]
- 21.Agmo Hernández V., Karlsson G., Edwards K. Intrinsic heterogeneity in liposome suspensions caused by the dynamic spontaneous formation of hydrophobic active sites in lipid membranes. Langmuir. 2011;27:4873–4883. doi: 10.1021/la1049919. [DOI] [PubMed] [Google Scholar]
- 22.Dastvan R., Bode B.E., Prisner T.F. Optimization of transversal relaxation of nitroxides for pulsed electron-electron double resonance spectroscopy in phospholipid membranes. J. Phys. Chem. B. 2010;114:13507–13516. doi: 10.1021/jp1060039. [DOI] [PubMed] [Google Scholar]
- 23.Georgieva E.R., Ramlall T.F., Eliezer D. Membrane-bound α-synuclein forms an extended helix: long-distance pulsed ESR measurements using vesicles, bicelles, and rodlike micelles. J. Am. Chem. Soc. 2008;130:12856–12857. doi: 10.1021/ja804517m. [DOI] [PMC free article] [PubMed] [Google Scholar]
- 24.Georgieva E.R., Ramlall T.F., Eliezer D. The lipid-binding domain of wild type and mutant α-synuclein: compactness and interconversion between the broken and extended helix forms. J. Biol. Chem. 2010;285:28261–28274. doi: 10.1074/jbc.M110.157214. [DOI] [PMC free article] [PubMed] [Google Scholar]
- 25.Zou P., McHaourab H.S. Increased sensitivity and extended range of distance measurements in spin-labeled membrane proteins: Q-band double electron-electron resonance and nanoscale bilayers. Biophys. J. 2010;98:L18–L20. doi: 10.1016/j.bpj.2009.12.4193. [DOI] [PMC free article] [PubMed] [Google Scholar]
- 26.Whiles J.A., Deems R., Dennis E.A. Bicelles in structure-function studies of membrane-associated proteins. Bioorg. Chem. 2002;30:431–442. doi: 10.1016/s0045-2068(02)00527-8. [DOI] [PubMed] [Google Scholar]
- 27.Ritchie T.K., Grinkova Y.V., Sligar S.G. Reconstitution of membrane proteins in phospholipid bilayer nanodiscs. Methods Enzymol. 2009;464:211–231. doi: 10.1016/S0076-6879(09)64011-8. [DOI] [PMC free article] [PubMed] [Google Scholar]
- 28.Branigan E., Pliotas C., Hagelueken G., Naismith J.H. Quantification of free cysteines in membrane and soluble proteins using a fluorescent dye and thermal unfolding. Nat. Protoc. 2013;8:2090–2097. doi: 10.1038/nprot.2013.128. [DOI] [PMC free article] [PubMed] [Google Scholar]
- 29.Faham S., Bowie J.U. Bicelle crystallization: a new method for crystallizing membrane proteins yields a monomeric bacteriorhodopsin structure. J. Mol. Biol. 2002;316:1–6. doi: 10.1006/jmbi.2001.5295. [DOI] [PubMed] [Google Scholar]
- 30.Denisov I.G., Grinkova Y.V., Sligar S.G. Directed self-assembly of monodisperse phospholipid bilayer Nanodiscs with controlled size. J. Am. Chem. Soc. 2004;126:3477–3487. doi: 10.1021/ja0393574. [DOI] [PubMed] [Google Scholar]
- 31.Denisov I.G., Baas B.J., Sligar S.G. Cooperativity in cytochrome P450 3A4: linkages in substrate binding, spin state, uncoupling, and product formation. J. Biol. Chem. 2007;282:7066–7076. doi: 10.1074/jbc.M609589200. [DOI] [PubMed] [Google Scholar]
- 32.Lucocq J., Manifava M., Ktistakis N.T. Immunolocalisation of phospholipase D1 on tubular vesicular membranes of endocytic and secretory origin. Eur. J. Cell Biol. 2001;80:508–520. doi: 10.1078/0171-9335-00186. [DOI] [PubMed] [Google Scholar]
- 33.Lucocq J. Can data provenance go the full monty? Trends Cell Biol. 2012;22:229–230. doi: 10.1016/j.tcb.2012.03.001. [DOI] [PubMed] [Google Scholar]
- 34.von Hagens T., Polyhach Y., Jeschke G. Suppression of ghost distances in multiple-spin double electron-electron resonance. Phys. Chem. Chem. Phys. 2013;15:5854–5866. doi: 10.1039/c3cp44462g. [DOI] [PubMed] [Google Scholar]
- 35.Giannoulis A., Ward R., Bode B.E. PELDOR in rotationally symmetric homo-oligomers. Mol. Phys. 2013;111:2845–2854. doi: 10.1080/00268976.2013.798697. [DOI] [PMC free article] [PubMed] [Google Scholar]
- 36.Hagelueken G., Ward R., Schiemann O. MtsslWizard: in silico spin-labeling and generation of distance distributions in PyMOL. Appl. Magn. Reson. 2012;42:377–391. doi: 10.1007/s00723-012-0314-0. [DOI] [PMC free article] [PubMed] [Google Scholar]
- 37.Hagelueken G., Abdullin D., Schiemann O. mtsslSuite: In silico spin labelling, trilateration and distance-constrained rigid body docking in PyMOL. Mol. Phys. 2013;111:2757–2766. doi: 10.1080/00268976.2013.809804. [DOI] [PMC free article] [PubMed] [Google Scholar]
- 38.Georgieva E.R., Borbat P.P., Boudker O. Conformational ensemble of the sodium-coupled aspartate transporter. Nat. Struct. Mol. Biol. 2013;20:215–221. doi: 10.1038/nsmb.2494. [DOI] [PMC free article] [PubMed] [Google Scholar]
- 39.Hänelt I., Wunnicke D., Slotboom D.J. Conformational heterogeneity of the aspartate transporter Glt(Ph) Nat. Struct. Mol. Biol. 2013;20:210–214. doi: 10.1038/nsmb.2471. [DOI] [PubMed] [Google Scholar]
- 40.Levina N., Tötemeyer S., Booth I.R. Protection of Escherichia coli cells against extreme turgor by activation of MscS and MscL mechanosensitive channels: identification of genes required for MscS activity. EMBO J. 1999;18:1730–1737. doi: 10.1093/emboj/18.7.1730. [DOI] [PMC free article] [PubMed] [Google Scholar]
- 41.Koprowski P., Kubalski A. C termini of the Escherichia coli mechanosensitive ion channel (MscS) move apart upon the channel opening. J. Biol. Chem. 2003;278:11237–11245. doi: 10.1074/jbc.M212073200. [DOI] [PubMed] [Google Scholar]
- 42.Sukharev S. Purification of the small mechanosensitive channel of Escherichia coli (MscS): the subunit structure, conduction, and gating characteristics in liposomes. Biophys. J. 2002;83:290–298. doi: 10.1016/S0006-3495(02)75169-2. [DOI] [PMC free article] [PubMed] [Google Scholar]
- 43.Battle A.R., Petrov E., Martinac B. Rapid and improved reconstitution of bacterial mechanosensitive ion channel proteins MscS and MscL into liposomes using a modified sucrose method. FEBS Lett. 2009;583:407–412. doi: 10.1016/j.febslet.2008.12.033. [DOI] [PubMed] [Google Scholar]
- 44.Grote M., Polyhach Y., Jeschke G., Steinhoff H.J., Schneider E., Bordignon E. Transmembrane signaling in the maltose ABC transporter MalFGK2-E: periplasmic MalF-P2 loop communicates substrate availability to the ATP-bound MalK dimer. J. Biol. Chem. 2009;284:17521–17526. doi: 10.1074/jbc.M109.006270. [DOI] [PMC free article] [PubMed] [Google Scholar]
- 45.Zou P., Bortolus M., McHaourab H.S. Conformational cycle of the ABC transporter MsbA in liposomes: detailed analysis using double electron-electron resonance spectroscopy. J. Mol. Biol. 2009;393:586–597. doi: 10.1016/j.jmb.2009.08.050. [DOI] [PMC free article] [PubMed] [Google Scholar]
- 46.Borbat P., Ramlall T.F., Freed J.H., Eliezer D. Inter-helix distances in lysophospholipid micelle-bound α-synuclein from pulsed ESR measurements. J. Am. Chem. Soc. 2006;128:10004–10005. doi: 10.1021/ja063122l. [DOI] [PubMed] [Google Scholar]
Associated Data
This section collects any data citations, data availability statements, or supplementary materials included in this article.