

Abstract
Combination Antiretroviral Therapy (cART) can suppress plasma HIV below the limit of detection in normal assays. Recently reported results suggest that viral replication may continue in some patients, despite undetectable levels in the blood. It has been suggested that the appearance of the circularized episomal HIV DNA artifact 2-LTR following treatment intensification with the integrase inhibitor raltegravir is a marker of ongoing viral replication. Other work has suggested that lymphoid organs may be a site of reduced antiviral penetration and increased viral production. In this study we model the hypothesis that this ongoing replication occurs in lymphoid follicle sanctuary sites and investigate the patterns of 2-LTR formation expected after raltegravir application. Experimental data is used to estimate the reaction and diffusion parameters in the model, and Monte-Carlo simulations are used to explore model behavior subject to variation in these rates. The results suggest that conditions for the formation of an observed transient peak in 2-LTR formation following raltegravir intensification include a sanctuary site diameter larger than 0.2 mm, a viral basic reproductive ratio within the site larger than 1, and a total volume of active sanctuary sites above 20 mL. Significant levels of uncontrolled replication can occur in the sanctuary sites without measurable changes in the plasma viral load. By contrast, subcritical replication (where the basic reproductive ratio of the virus is less than 1 in all sites) always results in monotonic increases of measured 2-LTR following raltegravir intensification, occurring at levels below the limit of detection.
Keywords: HIV, Mathematical biology, Cryptic Viremia, Drug Sanctuary
1. Introduction
Combination Antiretroviral Therapy (cART) is a combination therapy consisting of three separate antiviral agents [1] that can efficiently suppress HIV viral replication to be below the limit of detection in most patients as tested by normal commercial assays [2]. Despite this great advance in treatment, cART cannot eliminate the virus, as shown by residual virus detected by ultra-sensitive viral load assays [3], resulting in rapid viral rebound when treatment is interrupted. [4].
Reactivation of viral reservoirs in latently infected CD4+ T cells has been proposed as the main source of HIV-1 persistence in patients under cART [5, 6, 7]. However, the existence of de novo infection of active T-cells during suppressive therapy has recently been suggested as another possible source of residual viremia [8, 9, 10]. Such ongoing replication would occur in anatomical reservoirs, possibly inside the lymph nodes [11, 12], where there is evidence of poor antiviral penetration and resulting viral replication [13, 14, 15].
Potential evidence of ongoing replication in remote compartments is the presence in peripheral blood of circular episomal HIV DNA artifacts, which are formed during failed viral infection events [9, 10, 14]. Because these circles contain a unique region with two adjacent copies of the viral long-terminal repeat (LTR), they are know as 2-LTR circles. These 2-LTR circles are formed when host cell DNA repair enzymes modify linear viral cDNA that has failed to integrate into the host cell DNA. In the study by Buzon et al., 29% of the apparently fully-suppressed HIV-positive patients on cART were observed to have transient increases in CD4+ T cells containing HIV 2-LTR following raltegravir intensification. Raltegravir specifically prevents the integration of linear viral cDNA in targeting cells, and linear cDNA is a product of a recent infection event. This evidence strongly supports the hypothesis that episomal HIV-1 genomes are biomarkers of recent virus replication [10, 14].
While several studies have failed to show evidence of ongoing cycles of HIV-1 infection due to the lack of plasma viral load changes under the conditions described in Buzon et al [13, 15, 16], the absence of significant changes in plasma HIV-1 is not inconsistent with the existence of ongoing replication in compartments with limited communication with the plasma [13, 15, 17, 16]. There is evidence that viral replication is compartmentalized, isolated by possible barriers between plasma and certain tissues and organs [18, 19]. This compartmentalization could also explain the lack of observed sequence evolution in HIV [20, 21], as the samples taken from the blood may not reflect replication occurring in other compartments.
Lymph nodes have been suggested as sanctuary sites, compartments where antiretroviral drugs are inefficient or do not have penetration [11, 22, 23]. Follicles and paracortex in the lymph nodes are known to serve as a preferred location for HIV replication [24]. Studies with patients treated with cART for more than one year, described long-term persistence of HIV-1 structural proteins and glycoproteins in the germinal centers of lymph nodes despite undetectable plasma HIV-1 replication, suggesting the additional role of lymph nodes as anatomical reservoirs [12, 25]. Systemic analysis of SIV-infected Rhesus macaques receiving cART for 1 year also found high levels of vRNA in the lymph nodes [26].
Previously, we presented a reduced model for the formation of 2-LTR in [27] with excellent fit to the data showed in [10]. This reduced model showed a dramatic qualitative difference in the expected behavior of measured 2-LTR following raltegravir intensification. If the primary source of new infection events was the activation of latently infected cells, consistent with controlled viremia, the 2-LTR response to raltegravir intensification should be monotonically increasing. If the primary source of new infection were a stable cycle of successful infection and lysis of target cells, the 2-LTR response to raltegravir intensification would be a sharp, transient increase, as was observed in [10]. If replication rates were homogenous, this would result in measurable plasma viremia; as this was not observed, the replication resulting in the formation of 2-LTR episomes must be occurring in a spatially isolated sanctuary site [27].
The results of our previous research are only biologically feasible if there exist sites within the body that allow ongoing viral replication. These sites must have the spatial dynamics that provide the balance of isolation and connectivity required to allow ongoing viral replication that cannot be observed in the blood to be revealed through the production of 2-LTR products that can be measured in the blood. These sites would have to be sufficiently isolated from the blood that reduced concentrations of the antiviral drugs can be maintained. They would also have to be sufficiently isolated that neither virus nor infected cells produced in the sites are likely to survive the time required to diffuse into the blood. They would, however, need to be sufficiently connected that the cells containing 2-LTR circles created in the site do survive long enough to be measured in the blood. Furthermore, they need to be connected enough that the drug raltegravir is able to penetrate the site in concentrations adequate to cause the observed reduction in virus production. For the reasons discussed above, lymph nodes, specifically the follicle region, could potentially satisfy these requirements. Many of the spatial diffusion rates of the cells, viruses, and drugs within the lymphoid follicle regions have been measured experimentally; others can be adequately estimated using basic physical principles. By modeling the interactions between the fluid, well-mixed blood and fluid lymph and a semi-solid, diffusive lymphoid follicle based sanctuary site, we can determine whether it is feasible that lymphoid follicle sanctuary sites are producing the pattern of 2-LTR and viral load blood measurements seen experimentally.
In this paper we propose a mathematical model to investigate whether lymph nodes can function as sanctuary sites for ongoing viral replication, incorporating the spatial dynamics neglected in [27]. We describe the mechanisms by which this could be possible, and the conditions needed to generate the transient behavior of both measured 2-LTR and HIV viremia in the blood after administering raltegravir in patients on apparently suppressive cART regimens as shown in [10]. A spatial differential equation is described taking into account the dynamics of infected and uninfected CD4+ T cells, free virus, and cells containing 2-LTR circles. The sanctuary site is modeled with limited penetration of the antiviral drugs. Monte-Carlo simulation of the model using previously published distributions of the model parameters is performed to determine what parameter values are consistent with the observed 2-LTR transient behavior.
2. Methods
2.1. Compartmental Mathematical Model
Biological Background
When viral cDNA fails to integrate into host CD4+T cells, episomal artifacts including linear unintegrated DNA, 1-LTR circles, and 2-LTR circles form. This can only happen following a successful reverse transcription event. Previous studies have shown no significant viral change in the blood after raltegravir intensification in patients under cART. If the 2-LTR production is arising from interrupted rounds of successful infection, this implies that the 2-LTR containing T-cells come from an anatomical compartment diffusively remote from the blood. The model we propose assumes that the paracortex/follicle within lymph nodes are anatomical compartments with reduced drug efficacy, from which T-cells with 2-LTR recirculate after raltegravir is applied. The main objective is to determine whether this hypothesis is consistent with the observed dynamics of 2-LTR following raltegravir intensification.
The re-circulation and motility of T-cells has been broadly studied. Re-circulation includes the entry into the lymph node, the motility inside and the exit from the paracortex of the node. There are two main entries for lymphocytes into the lymph nodes, through high endothelial venules (HEV) and the afferent lymphatic vessels (AL) in the sub-capsular sinus. The HEV route is preferred over the AL for T -cells so that in the absence of infection, up to ~ 2 percent of T-cells are recruited via HEVs from the recirculating pool per day [28]. This preferred way for T-Cells to enter the lymph nodes is highly selective and efficient. A guided cascade facilitates the crossing of the lymphocytes through the HEV's wall. Inside the paracortex of the lymph node, the cells follow a random walk in a cord-like arrangement of concentric layers of fibroblastic reticular cells (FRCs). Each paracortical cord is between 10 and 15 μm in length, and the T-cells has been reported to have an average 3D velocity of and a motility coefficient about [19, 28, 29, 30]. The random walk permits the interaction of T-cells with dendritic cells needed to recognize antigens [28, 29]. In uninflamed lymph nodes, the T cells will explore a particular lymph node for between 6 and 18 hours [31, 28], though cytokine signals in inflamed lymph nodes can make this considerably longer [29]. If naive lymphocytes do not encounter antigens, they eventually leave the paracortex by the cortical sinus and the lymph node through efferent lymphatics. The total recirculation time is estimated to be between 52 and 69 hours on average [32]
Previous Models
Several different approaches have been used to model lymph nodes [19, 33, 34, 35], but none with the purpose of explaining ongoing viral replication. Some researchers have explained HIV dynamics in compartments but none have accounted for 2-LTR formation as a marker of low level replication [36, 37]. In this 147 work, we model the viral dynamics in the blood and the in lymph nodes paracortex/follicle sites, including the transport of cells and virus between them. We show that the observed patterns of 2-LTR and virus dynamics following raltegravir intensification can be reproduced by our model if the sanctuary sites are sufficiently large and the drug efficacy within the sites is sufficiently small. We show that, in the absence of these conditions, fundamentally different patterns of measured 2-LTR and virus in the blood are predicted following raltegravir intensification.
Description of the Model
The model represents the conditions for the formation of 2-LTR in T-cells due to HIV dynamics both inside the lymphoid follicles and the blood as well as the motility of the CD4+ T cells among them. We used the basic model of HIV dynamics with its associated assumptions [38, 39, 40, 41, 42]. Furthermore, we include the assumptions that the two sources of 2-LTR formation in T-cells are the intrinsic one unenhanced by raltegravir and the one caused by the application of raltegravir formulated in [27] and used in [17]. Several assumptions of the recirculation and motility of the T-cells and HIV in the initial compartmental model are proposed in [17]. Firstly, the recirculation of T-cells from the inner sites of the lymph nodes to the lymphatic vessels and the blood is diffusion-like. Second, the motility of T-cells inside the lymphoid follicles is also analogous to diffusion, moving in apparently random walk fashion [19]. Third, HIV is only transported in/out the lymphoid follicles inside infected T-cells [43]. Fourth, HIV moves inside the lymphoid follicles by diffusion. Fifth, T-Cells and virions move rapidly enough such that the Lymphoid Follicle is well-described by concentric homogenous spherical domains. Finally, we assume the blood and lymphatic vessels can be jointly described by a single, well-stirred compartment.
Based on these assumptions, we simplify the reaction-diffusion equations describing the dynamics into a set of compartmental diffusively-coupled ODEs as in [44, 45, 46]. The system has the following configuration: one main compartment representing the blood, the HEVs and the lymphatic vessels and N secondary compartments representing all the lymph nodes paracortex/follicle sites in human body. These N compartments have no connections between them but only with the main compartment as Figure 4 depicts. Reaction-diffusion dynamics are assumed to dominate within each of the N secondary spherical compartments. The method of lines is used to spatially discretize each of the N spherical compartments, and spherical symmetry is exploited, allowing the spheres to be subdivided into n − 1 concentric spherical shells where only the most external one is connected with the blood compartment. The different shells are denoted by the subscript s. Since all N compartments have the same geometrical configuration, this results in an ODE model of 4n equations.
Figure 4. 2-LTR Post-intensification varying and diameter size.
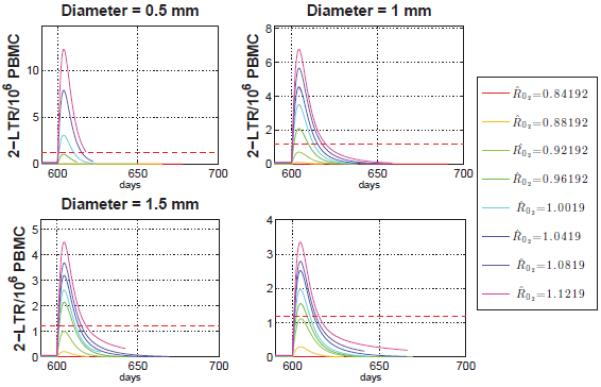
Average 2-LTR containing cells in the main compartment for a fixed total compartment volume. For diameter length 1, 1.5 and 2 mm the lower bound for detectable peaks approximately over 0.96, and for the smaller case, diameter equal to 0.5mm, the lower bound is .
As depicted in Figure 4, in each compartment CD4+ T target cells xs, are produced at a rate λ, decay at a rate dxs and are infected at a rate βxsvs. The rate is reduced by the activity of reverse transcriptase inhibitors (RTI) uRTI and integrase inhibitors (II) uII with maximum effectiveness of ηRTI and ηII. We hypothesize that the efficacy of the drug depends on the domain; therefore, we include a spatial dependence drug penetration distribution θs and ξs for RTI and II respectively. Exogenous sources, particularly the activation of latent infected T-cells, contribute to create actively infected cells at a rate ye. The infected cells ys die at a rate ays and produce virions at a rate γys. This viral production is interrupted by protease inhibitors uPI with maximum efficiency ηPI (the activity of protease inhibitors results in the production of non-infectious particles, which are neglected in this model). The activity of this drug is also assumed to vary spatially by a factor φs. Free virus exponentially decays at a rate ωvs. Viral entry leads to the formation of linear unintegrated HIV DNA at a rate inhibited by the activity of RTI drugs. In the case of no integrase inhibitor intensification (uII = 0), DNA copies may fail to integrate into the host cell genome at a small intrinsic rate kINT resulting in the formation of cells with 2-LTR cs. In the case of intensification with integrase inhibitors (uII = 1), this rate of 2-LTR production is increased to kIIηIIuIIξs in this compartment, with a concomitant decrease in the intrinsic rate to avoid the possibility of counting the same 2-LTR formation event twice. The 2-LTR containing cells decay at a rate δcs.
Communication between the compartments is modeled as diffusion, where represents the set of the adjacent layers of s, Ai,s represents the surface area between each layer in the sphere, Vs represent the volume of the layer, and and represents the effective diffusivity of T-Cells and HIV virions between layers.
The first compartment (s = 1) represents the blood and free-flowing lymph, and connects with all the N spherical sites. As a result, the equations for the first compartment have a special form, which may be written as:
| (1) |
For the remaining n − 1 spherical shell compartments (representing the reaction-diffusion dynamics within the LF site), the equations may be written as:
| (2) |
2.2. Parameters Definition
To obtain realistic conditions for the 2-LTR dynamics observed in blood assuming lymph nodes paracortex/follicle acting as sanctuary sites, the parameters for viral dynamics, 2-LTR formation, drug penetration, and diffusion/geometry values have to be defined. The parameters include the local reaction rates and the diffusion rates between compartments.
HIV reaction rates
For viral dynamic parameters and drug efficiency, we use the values obtained by parameter identification in [47] generated by a Bayesian Markov-Chain Monte Carlo technique. This study estimates the parameters from data taken from HIV patients who had 3 to 5 treatment interruptions cycles each. These data produced a posterior distribution of parameter values, including drug efficacy, conditioned on the observed data. Table 1 shows the parameter ranges used in this study.
Table 1.
Parameter values for HIV Dynamics from [47]
| Parameters | Value | Units | |
|---|---|---|---|
| log10(λ) | (1.54, 2.88) |
|
|
| log10(d) | (−1.35, −0.34) |
|
|
| log10(β) | (−5.78, −5.23) |
|
|
| log10(a) | (−0.76, 0.42) |
|
|
| log10(γ) | (3.39, 4.00) |
|
|
| log10(ω) | 18.8 |
|
|
| log10(η) | (0.60, 0.89) | – |
2-LTR formation rates
The parameters for the 2-LTR formation include KII, KINT, and δ. KII and KINT are the product of a scaling factor which describes the volume that contains 106 PBMC (Peripheral Blood Mononuclear cells) and non-dimensional factors that relate the fraction of integration events that fail after raltegravir is applied and before application, respectively. δ is the decay rate of observed 2-LTR in vivo. Shown in Table 2 are the maximum likelihood estimation for δ and confidence intervals for KII and KINT obtained in [27] using data from [10] and the values estimated from previous studies [48, 49, 50].
Table 2.
Parameter values for 2-LTR formation from [27]
| Parameters | Value | Units | |
|---|---|---|---|
| kII | (270, 910) |
|
|
| kINT | (0.54, 1.82) |
|
|
| δ | 0.46 |
|
Diffusion
The diffusion parameters in the model depend on the diameter of the spherical compartment and the values for effective diffusivity of the T-cells and the virus. Studies have shown that hyperplastic lymphoid follicles can be as large as 1mm in diameter [51]. Thus, we vary the site diameter between 0.1 to 2 mm to determine the effect site size has on the 2-LTR transient behavior.
To estimate the effective diffusivity of T-cells between the main compartment and the paracortex/follicle site , and we note that without infection, one mouse lymph node recruits approximately 2% of the T-cells from recirculating pool per day, and the average diameter of a mouse LN is 1mm [33, 52]. Diffusion into the lymph node is given by the equation , where is the effective diffusivity between the blood and one mouse lymph node, and Ab,LN and VLN the surface area and volume of the mouse lymph node. Thus, must be approximately , which we use as the estimated value of , and .
The effective diffusion of T-cells between layers within the lymphoid paracortex/follicle is the average value of the experimentally observed motility coefficient of T-Cells within lymphoid follicles of [19, 28, 29, 30] divided by the length of each layer , where r is the radius of the paracortex/follicle site.
The effective diffusion of the virus approximately is assumed to be zero between the main compartment and the spherical sites and that the virus is carried into them only by T-cells. This is because the separating boundary is known to act as a molecular sieve for particles smaller than an HIV particle [28]. The effective diffusivity between compartments is assumed to follow the derivation in [53, 54] for a spherical virus. Assuming the diameter of HIV equal to 120 nm a diffusion coefficient of is calculated and divided by the width of each layer, to obtain the effective diffusivity.
Sanctuary sites and Drug Penetration
The drug penetration distribution in each compartment is not well understood, and we investigate multiple possibilities. If the compartments were isolated, then prior to integrase inhibitor application each compartment has a basic reproductive ratio,
| (3) |
When the system reaches equilibrium and integrase inhibitor intensification uII is applied, each compartment has a basic reproductive ratio with the form
| (4) |
Note that the smaller the values of θs, φs or ξs, the larger the initial growth rate of the virus in the compartment. We assume that each drug has a penetration of 100% in the first compartment, and for θs and φs we assume a geometric sequence with ratio while for ξs a geometric ratio equal to 1 and has a value of 0.7 for compartment 1 to n. Since we assume 100% penetration in compartment 1, is guaranteed. Consequently, the region between the third and the nth compartment composes the true sanctuary site, with drug efficacy sufficiently low to enable persistent virus replication. The region diffusively furthest from the plasma has the smallest drug efficacy. This last compartment has an extremely low drug efficacy and . The second compartment composes a transition region, with reduced drug efficacy relative to the main compartment and .
These equations for drug efficacy are consistent with poor diffusion of the drug into the sanctuary site, and assume that the intracellular half-life of the drugs is shorter than the time spent in the sites by the T Cells. For the nominal parameters used in this study, the median time spent by a T Cell in the sanctuary site depends on the site diameter, and ranges between 1.5 days for site diameters of 0.1 mm up to 16.3 days for site diameters of 1 mm. This is compatible with the experimentally determined times discussed previously [31, 28, 29], and also provides a mechanism for the longer times associated with lymphoid inflammation. These times are also longer than the half-lives of all of the antiviral drugs [55], though a few drugs, such as the non-nucleoside reverse transcriptase inhibitors or the nucleotide analogue tenofovir, have half-lives comparable to the time spent in smaller lymph nodes. Other mechanisms besides diffusion may also result in reduced concentrations and/or efficacies of the antiretrovirals in the lymphoid follicles; the model could be modified to account for alternative mechanisms through modification of the equations ξs, θs and φs.
2.3. Monte-Carlo Simulation
Based on the models of equations (1) and (2), two Monte-Carlo simulations characterize the conditions under which the 2-LTR transient behavior (the initial rise follow by a fall of the episomes) is possible, subject to random variation of the HIV reaction and diffusion parameters within the prior distributions described in Tables 1 and 2.
The first simulation seeks to determine the the minimum value of for which the 2-LTR transient behavior in blood is observed. In this simulation we randomly generated 1,000 set of parameters for virus and T-cell rates from the posterior distributions estimated in [47]. We made the simulations for a fixed volume value of 30 mL, for all N spherical sites tissue, with each individual site having diameters of 0.5, 1, 1.5 or 2 mm. For each set of parameters the simulations were run after 600 days when each variable have reach its steady state, and thus take those values to obtain the cryptic viremia conditions results.
Using the results of the first simulation, the second examines the change in the transient peak value of 2-LTR in the blood as the total tissue volume of the N compartments and the individual sphere diameter of lymph nodes varies. In this second simulation, we run a 80,000-trial Monte-Carlo simulation using the priors previously described with total tissue volume and individual sphere diameter drawn from the uniform distributions 30 – 499 mL and 0.1 – 2 mm respectively. We applied raltegravir in the simulation after 600 days, and use the simulated time series to do the analysis.
3. Results
3.1. Reproductive Ratio and Conditions for Cryptic Viremia
defines the reproductive ratio of the virus in compartment s prior to raltegravir intensification if the compartment were isolated (as the compartments are not isolated, the actual reproductive ratio can be greater or smaller depending on the behavior of neighboring compartments). This parameter relates each phase of the HIV cycle, drug efficiency and drug penetration in each compartment with the form of equation (2.2). When the value is greater than 1, the virus grows exponentially, and when smaller than 1 the virus decays exponentially. Since the drug distribution is assumed to decrease with compartment, the s = 2 compartment has the highest drug activity in the sphere and thus the smallest . Consequently, if there is viral replication in compartment s = 2, this implies the presence of viral replication in all compartments s > 2. Given this, we can use as a measure to determine lower bound conditions for cryptic viremia under cART before intensification and for 2-LTR transient results after intensification. To that end, a 1,000-trial Monte-Carlo simulation of the model defined by Equations (1) and (2) is run using parameters drawn from the prior distributions generated by a Bayesian Markov-Chain Monte Carlo technique in [47] leading to the values for in the range 0.8 to 1.15 and a total volume of all N spherical sites tissue of 30 mL, with each individual site having diameters of either 0.5, 1, 1.5 or 2 mm. Note that, we are using a fixed tissue volume for the N spherical lymph nodes and for each change in an individual sphere, consequently the total number of spherical compartments N is variable. The median observed viral loads in the center of the spherical site (compartment 10) prior to integrase inhibitor intensification are plotted against in Figure 4.
The plot describes the median steady state viral load in compartment 10 before intensification and the horizontal line the normal assays limit of detection. In all cases, the viral load in Compartment 1, which describes the blood and free-flowing lymph, was well below the limit of detection, demonstrating that the model is consistent with cryptic viremia not detectable in the blood. As shown in Figure 4, must be greater than 0.85, 0.86, 0.88 and 0.93 for diameter size of 2, 1.5, 1 and 0.5 mm respectively to have a detectable viral load in the most remote compartment. Above the critical threshold, the total viral load saturates quickly, and target-cell depletion determines the steady-state viral load. The conditions for cryptic viremia before intensification are related to the transient behavior of 2-LTR in blood after adding raltegravir.
3.2. Reproductive Ratio and 2-LTR Formation
To better understand the role of in the 2-LTR formation in blood after raltegravir intensification we use the results of the 80,000 trials where we simulated the application of raltegravir after 600 days, allowing all populations to reach steady state. Then we plot the behavior of 2-LTR in compartment 1 after applying intensification for different diameters as shown in Figure 4. Note the smaller the size of the compartment, the higher the maximum value of 2-LTR in the main compartment after raltegravir intensification. This is because smaller compartments diffuse more rapidly into the blood. However, as shown in Figure 4, the smaller the site diameter the larger the value of is required to allow viral replication. Figure 4 also demonstrates that the smaller the site the greater to find detectable 2-LTR peaks in the main compartment. More specifically has to be in the range between 0.96 – 1 to find detectable 2-LTR peaks for diameter length from 0.5 to 2 mm. This implies that a significant reduction in drug efficacy throughout the site is necessary to explain the transient 2-LTR peaks observed in [10]. It is worth pointing out that the shape of the transient peaks predicted by the model, as shown in Figure 4, match the median observed dynamics reported in [10].
3.3. Infected T-Cell turnover rate, 2-LTR Formation and Sanctuary Site Size
To understand the relation between the total tissue volume, individual site size, infected T-Cell turnover rate and predicted 2-LTR peaks in compartment 1, we use the data from the 80,000-trial Monte-Carlo simulation using the priors previously described with values of drawn from the uniform distribution 0.93 – 1.5 and total tissue volume and individual sphere diameter drawn from the uniform distributions 30 – 499 mL and 0.1 – 2 mm respectively. The scatterplot in Figure 4 shows the steady state value of the total infected cells turnover rate before intensification versus the maximum value of the 2-LTR transient behavior in blood.
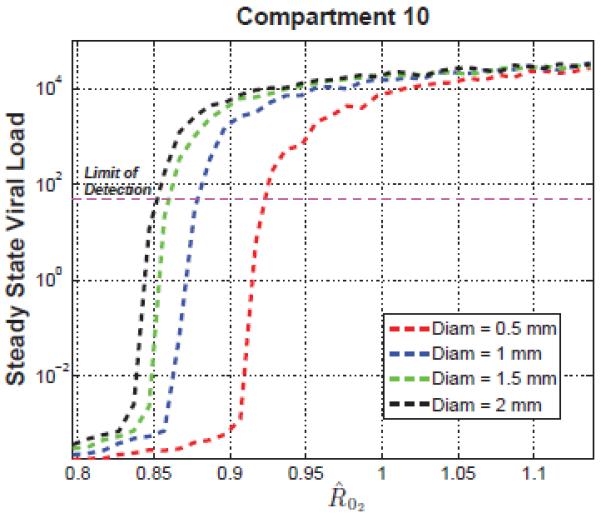
There is a positive, approximately linear correlation between the 2-LTR peak and the T-Cell infection, suggesting that the 2-LTR peak post-intensification is a useful surrogate measurement of cryptic replication. In Figure 4, the plot is divided into four regions according to the total tissue volume of all N sites and the diameter of each site. Region I has the largest tissue volume and diameter, region II, large tissue volume but small diameter, region III small tissue volume and large diameter and region IV for small volume tissue and diameter. Larger peaks of 2-LTR positively correlate with greater total tissue volume as well as more infection, and weakly negatively correlate with site diameter, as long as the diameter is above the threshold necessary to allow replication. For total sanctuary site volumes above 30 mL, 2-LTR peaks in compartment 1 are larger than the limit of detection in greater than 95% of the cases. In general, neither cryptic replication nor a 2-LTR peak is present when the site diameter is less than 0.2 mm. This is because virus replication cannot be supported in sites smaller than 0.2 mm in diameter; the rate of loss of infected cells to compartment 1 via diffusion makes sustained replication impossible. The median viral load in the center of the sanctuary site is plotted vs. site diameter in Figure 4.
We also investigated the case where is below 1; that is, only inefficient residual viremia is present in all compartments. Under these conditions, the predicted 2-LTR concentrations in compartment 1 following integrase inhibitor intensification always follow a monotonic, rather than a transient increase, as shown in Figure 4. The maximum predicted value of 2-LTR in compartment 1 is below the limit of detections in normal assays (1.2 2-LTR/106PBMC [27]) for greater than 95% of the trials when is below 1.
4. Discussion
In this paper, we have shown that a spatial, compartmental model of lymphoid follicles as sanctuary sites supporting ongoing viral replication is capable of reproducing the transient behavior of plasma HIV 2-LTR observed after application of raltegravir in patients undergoing cART therapy. Using Monte-Carlo methods, we explored the behavior of these sites across the feasible range of parameter values as determined from prior experimental data. The results demonstrated that the behavior of the compartments, and the dependence of the observed 2-LTR dynamics on the presence of locally uncontrolled cryptic viremia, was robust to the uncertainty in the model parameters.
We have shown that a necessary condition for the formation of a transient 2-LTR peak is a sufficiently low drug efficacy in the sanctuary site, such that the local reproductive ratio in the site is larger than 1. For the most restrictive scenario, with compartment diameters of 0.5 mm, the drug efficacy at the interface between the site and the blood/lymphatic sinus compartment has to be greater than 0.93 to allow any significant level of HIV replication in the site. A second necessary condition is that the individual lymphoid follicles are sufficiently large to support virus replication. For site diameters below 0.2 mm, fewer than 5% of the Monte-Carlo trials resulted in any significant virus replication in the site.
If the sites are sufficiently large, and have sufficiently low antiviral activity to allow efficient replication of HIV within the site, than the addition of raltegravir resulted in the transient production of 2-LTR circles within the site. Detectable 2-LTR peaks in the blood require that the total volume of sanctuary site tissue also be large enough that the diffusion of these 2-LTR from the sites into the blood occur at a rate large enough to bring the observed peak in the blood above the limit of detection, approximated 1 2-LTR per 106 PBMC. If the total infected cell turnover in the sites was larger that 106 infected cells per day, than the observed peak in plasma 2-LTR would be above the limit of detection over 95% of the time.
For infected cell turnover rates in the sanctuary sites as high as 2 × 10⁷ infected cells per day, there was no measurable contribution of virus to compartment 1, neither was there any measurable change in the predicted plasma viral load following integrase inhibitor intensification, despite orders-of-magnitude reductions in the total infected cell turnover rates following intensification. This is consistent with the efficient viremia in the sanctuary sites being cryptic, undetectable from standard plasma viral load assays.
We have further shown that when the antiviral activity within the sites is sufficiently high that R0 < 1 everywhere, it is impossible to produce a transient 2-LTR curve following raltegravir intensification. Under these conditions, the only possible 2-LTR dynamics following raltegravir intensification are a monotonic increase of 2-LTR in compartment 1. For the range of parameters considered in our Monte-Carlo study, this monotonic increase never resulted in a 2-LTR concentration above the limit of detection of 1.2 2-LTR per 106 PBMC.
In the INTEGRAL study [10], 13 out of 45 patients exhibited measurable 2-LTR peaks in their blood following raltegravir intensification. These 2-LTR dynamics followed a characteristic pattern with a dramatic peak at week 2, decaying below baseline by week 24. Our model is able to reproduce these dynamics if and only if reduced drug activity in anatomically isolated sanctuary sites enables high levels of efficient cryptic HIV replication. The median observed 2-LTR peak at week 2 from the 13 patients was 5.8 2-LTR per 106 PBMC. If the assumptions of our spatial model are correct, this would correspond to a pre-intensification cryptic replication rate of between 2 × 10⁶ and 2 × 10⁷ infected cells per day. The highest measured peak among the 13 patients was 72.8 2-LTR per 106 PBMC; this would correspond to a pre-intensification cryptic replication rate of between 3 × 10⁷ and 3 × 10⁸ infected cells per day.
Viral replication rates this high will certainly result in the production of novel viral mutants. These novel mutations may result in accelerated treatment failure. The contribution of the cryptic viremia to the development of resistance-based treatment failure will depend on many factors. The degree of residual activity of the antivirals in the sanctuary site will affect how strongly resistance mutations are selected for within the site, and the diffusion rates between the site and the blood will determine whether intermediate mutations are likely to be observed in blood-based assays before a full escape mutant is generated. Future work will focus on developing a predictive model for the evolution of resistance in the presence of cryptic viremia.
Figure 1. Configuration of compartments.
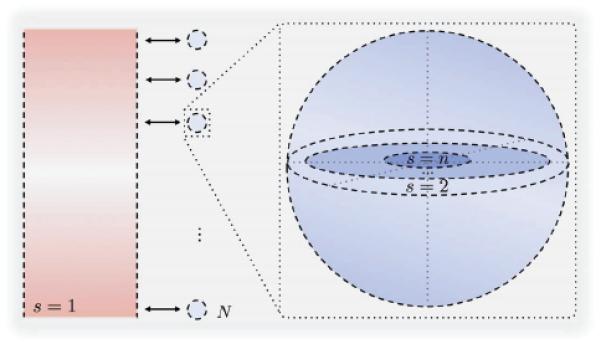
On the left the main compartment representing the blood, HEVs and lymphatic vessels, In the middle the N secondary spherical compartments representing the lymph nodes paracortex/follicle sites and on the right the formulation of each sphere as n − 1 concentric homogenous shells.
Figure 2. Illustration of the model.
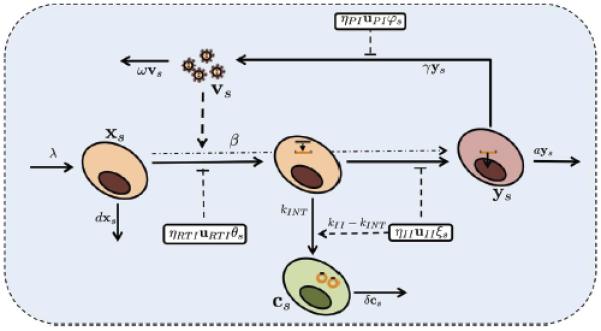
Description of the HIV life cycle, the formation of 2-LTR circles in T-cells and the influence of the drug in each compartment and the variables that represent each element.
Figure 3. Pre-intensification Viral Load in Sanctuary site.
Average steady state of viral load in the most remote compartment versus for diameter length of 0.5, 1, 1.5 and 2 mm.
Figure 5. Correlation of total infection pre-intensification and 2-LTR peak post-intensification.
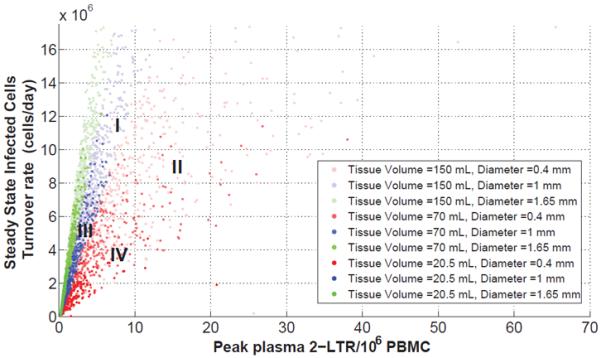
Regions of the scattered plot depending on the N compartments volume tissue and individual sphere diameter length. Region I, the largest tissue volume and diameter, region II, large tissue volume but small diameter, region III small tissue volume and large diameter and region IV for small volume tissue and diameter.
Figure 6. Viral load in sanctuary site centers vs. site diameter.
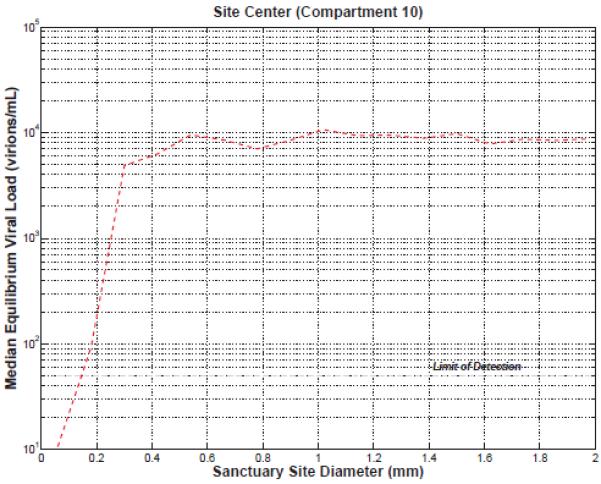
Viral replication can not be sustained in sanctuary sites with diameters less than 0.2 mm.
Figure 7. 2-LTR behavior when .
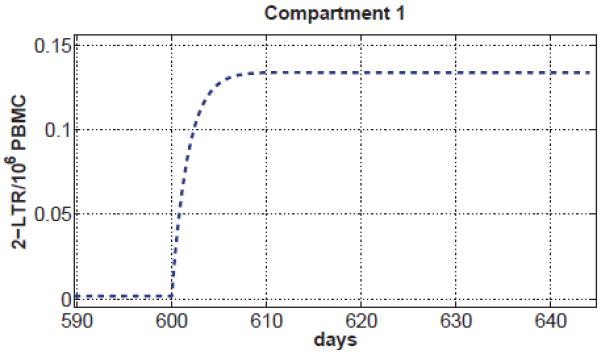
Monotonic 2-LTR dynamics in compartment 1 for all parameter values where . Under these conditions, no transient 2-LTR dynamics are possible.
Acknowledgments
The project described was supported by Award Number R21AI078842 from the National Institute Of Allergy and Infectious Diseases. The content is solely the responsibility of the authors and does not necessarily represent the official views of the National Institute of Allergy and Infectious Diseases or the National Institutes of Health. The funders had no role in study design, data collection and analysis, decision to publish, or preparation of the manuscript.
Footnotes
Publisher's Disclaimer: This is a PDF file of an unedited manuscript that has been accepted for publication. As a service to our customers we are providing this early version of the manuscript. The manuscript will undergo copyediting, typesetting, and review of the resulting proof before it is published in its final citable form. Please note that during the production process errors may be discovered which could affect the content, and all legal disclaimers that apply to the journal pertain.
References
- [1].Thompson MA, Aberg JA, Hoy JF, Telenti A, Benson C, Cahn P, Eron JJ, Günthard HF, Hammer SM, Reiss P, Richman DD, Rizzardini G, Thomas DL, Jacobsen DM, Volberding PA. Antiretroviral treatment of adult HIV infection: 2012 recommendations of the International Antiviral Society-USA panel. JAMA. 2012;308(4):387–402. doi: 10.1001/jama.2012.7961. [DOI] [PubMed] [Google Scholar]
- [2].Michaels SH, Clark R, Kissinger P. Declining morbidity and mortality among patients with advanced human immunodeficiency virus infection. N Engl J Med. 1998;339(6):405–406. doi: 10.1056/NEJM199808063390612. [DOI] [PubMed] [Google Scholar]
- [3].Dornadula G, Zhang H, VanUitert B, Stern J, Livornese L, Ingerman MJ, Witek J, Kedanis RJ, Natkin J, DeSimone J, Pomerantz RJ. Residual HIV-1 RNA in blood plasma of patients taking suppressive highly active antiretroviral therapy. JAMA. 1999;282(17):1627–1632. doi: 10.1001/jama.282.17.1627. [DOI] [PubMed] [Google Scholar]
- [4].Frost S, Martinez-Picado J, Ruiz L, Clotet B, Brown A. Viral dynamics during structured treatment interruptions of chronic human immunodeficiency virus type 1 infection. J Virol. 2002;76(3):968–979. doi: 10.1128/JVI.76.3.968-979.2002. [DOI] [PMC free article] [PubMed] [Google Scholar]
- [5].Finzi D, Hermankova M, Pierson T, Carruth LM, Buck C, Chaisson RE, Quinn TC, Chadwick K, Margolick J, Brookmeyer R, Gallant J, Markowitz M, Ho DD, Richman DD, Siliciano RF. Identification of a reservoir for HIV-1 in patients on highly active antiretroviral therapy. Science. 1997;278(5341):1295–1300. doi: 10.1126/science.278.5341.1295. [DOI] [PubMed] [Google Scholar]
- [6].Wong JK, Hezareh M, Günthard HF, Havlir DV, Ignacio CC, Spina CA, Richman DD. Recovery of replication-competent HIV despite prolonged suppression of plasma viremia. Science. 1997;278(5341):1291–1295. doi: 10.1126/science.278.5341.1291. [DOI] [PubMed] [Google Scholar]
- [7].Chun TW, Stuyver L, Mizell SB, Ehler LA, Mican JA, Baseler M, Lloyd AL, Nowak MA, Fauci AS. Presence of an inducible HIV-1 latent reservoir during highly active antiretroviral therapy. Proc Natl Acad Sci USA. 1997;94(24):13193–13197. doi: 10.1073/pnas.94.24.13193. [DOI] [PMC free article] [PubMed] [Google Scholar]
- [8].Chun TW, Davey RT, Ostrowski M, Justement J. Shawn, Engel D, Mullins JI, Fauci AS. Relationship between pre-existing viral reservoirs and the re-emergence of plasma viremia after discontinuation of highly active anti-retroviral therapy. Nat Med. 2000;6(7):757–761. doi: 10.1038/77481. [DOI] [PubMed] [Google Scholar]
- [9].Sharkey M, Triques K, Kuritzkes DR, Stevenson M. In vivo evidence for instability of episomal human immunodeficiency virus type 1 cDNA. J Virol. 2005;79(8):5203–5210. doi: 10.1128/JVI.79.8.5203-5210.2005. [DOI] [PMC free article] [PubMed] [Google Scholar]
- [10].Buźon MJ, Massanella M, Llibre JM, Esteve A, Dahl V, Puertas MC, Gatell JM, Domingo P, Paredes R, Sharkey M, Palmer S, Stevenson M, Clotet B, Blanco J, Martinez-Picado J. HIV-1 replication and immune dynamics are affected by raltegravir intensification of HAART-suppressed subjects. Nat Med. 2010;16(4):460–465. doi: 10.1038/nm.2111. [DOI] [PubMed] [Google Scholar]
- [11].Lafeuillade A, Khiri H, Chadapaud S, Hittinger G, Halfon P. Persistence of HIV-1 resistance in lymph node mononuclear cell RNA despite effective HAART. AIDS. 2001;15(15):1965–1969. doi: 10.1097/00002030-200110190-00008. [DOI] [PubMed] [Google Scholar]
- [12].Popovic M, Tenner-Racz K, Pelser C, Stellbrink H-J, van Lunzen J, Lewis G, Kalyanaraman VS, Gallo RC, Racz P. Persistence of HIV-1 structural proteins and glycoproteins in lymph nodes of patients under highly active antiretroviral therapy., Proc Natl Acad Sci USA. 2005;102(41):14807–14812. doi: 10.1073/pnas.0506857102. [DOI] [PMC free article] [PubMed] [Google Scholar]
- [13].Gandhi RT, Zheng L, Bosch RJ, Chan ES, Margolis DM, Read S, Kallungal B, Palmer S, Medvik K, Lederman MM, Alatrakchi N, Jacobson JM, Wiegand A, Kearney M, Coffin JM, Mellors JW, Eron JJ. AIDS Clinical Trials Group A5244 team, The effect of raltegravir intensification on low-level residual viremia in HIV-infected patients on antiretroviral therapy: a randomized controlled trial. PLoS Med. 7(8) doi: 10.1371/journal.pmed.1000321. [DOI] [PMC free article] [PubMed] [Google Scholar]
- [14].Sharkey M, Babic DZ, Greenough T, Gulick R, Kuritzkes DR, Stevenson M. Episomal viral cDNAs identify a reservoir that fuels viral rebound after treatment interruption and that contributes to treatment failure. PLoS Pathog. 2011;7(2):e1001303. doi: 10.1371/journal.ppat.1001303. [DOI] [PMC free article] [PubMed] [Google Scholar]
- [15].Gandhi RT, Coombs RW, Chan ES, Bosch RJ, Zheng L, Margolis DM, Read S, Kallungal B, Chang M, Goecker EA, Wiegand A, Kearney M, Jacobson JM, D'Aquila R, Lederman MM, Mellors JW, Eron JJ. AIDS Clinical Trials Group (ACTG) A5244 Team, No effect of raltegravir intensification on viral replication markers in the blood of HIV-1-infected patients receiving antiretroviral therapy. J Acquir Immune Defic Syndr. 2012;59(3):229–235. doi: 10.1097/QAI.0b013e31823fd1f2. [DOI] [PMC free article] [PubMed] [Google Scholar]
- [16].Sloan RD, Wainberg MA. The role of unintegrated DNA in HIV infection. Retrovirology. 2011;8:52. doi: 10.1186/1742-4690-8-52. [DOI] [PMC free article] [PubMed] [Google Scholar]
- [17].Cardozo EF, Vargas CA, Zurakowski R. A Compartment Based Model for the Formation of 2-LTR Circles after Raltegravir Intensification. 51st IEEE Conference on Decision and Control; Maui, HI. 2012. pp. 4924–4929. [Google Scholar]
- [18].Dahl V, Josefsson L, Palmer S. HIV reservoirs, latency, and reactivation: prospects for eradication. Antiviral Res. 2010;85(1):286–294. doi: 10.1016/j.antiviral.2009.09.016. [DOI] [PubMed] [Google Scholar]
- [19].Mirsky HP, Miller MJ, Linderman JJ, Kirschner DE. Systems biology approaches for understanding cellular mechanisms of immunity in lymph nodes during infection. J Theor Biol. 2011;287:160–170. doi: 10.1016/j.jtbi.2011.06.037. [DOI] [PMC free article] [PubMed] [Google Scholar]
- [20].Evering TH, Mehandru S, Racz P, Tenner-Racz K, Poles MA, Figueroa A, Mohri H, Markowitz M. Absence of HIV-1 evolution in the gut-associated lymphoid tissue from patients on combination antiviral therapy initiated during primary infection. PLoS Pathog. 2012;8(2):e1002506. doi: 10.1371/journal.ppat.1002506. [DOI] [PMC free article] [PubMed] [Google Scholar]
- [21].Anderson JA, Archin NM, Ince W, Parker D, Wiegand A, Coffin JM, Kuruc J, Eron J, Swanstrom R, Margolis DM. Clonal sequences recovered from plasma from patients with residual HIV-1 viremia and on intensified antiretroviral therapy are identical to replicating viral RNAs recovered from circulating resting CD4+ T cells. J Virol. 2011;85(10):5220–5223. doi: 10.1128/JVI.00284-11. [DOI] [PMC free article] [PubMed] [Google Scholar]
- [22].Pantaleo G, Graziosi C, Butini L, Pizzo PA, Schnittman SM, Kotler DP, Fauci AS. Lymphoid organs function as major reservoirs for human immunodeficiency virus. Proc Natl Acad Sci USA. 1991;88(21):9838–9842. doi: 10.1073/pnas.88.21.9838. [DOI] [PMC free article] [PubMed] [Google Scholar]
- [23].Kraehenbuhl JP. The gut-associated lymphoid tissue: a major site of HIV replication and CD4 cell loss. Trends in Microbiology. 1998;6(11):419–20. doi: 10.1016/s0966-842x(98)01393-6. discussion 420–1. [DOI] [PubMed] [Google Scholar]
- [24].Folkvord JM, Armon C, Connick E. Lymphoid follicles are sites of heightened human immunodeficiency virus type 1 (HIV-1) replication and reduced antiretroviral effector mechanisms. AIDS Res Hum Retroviruses. 2005;21(5):363–370. doi: 10.1089/aid.2005.21.363. [DOI] [PubMed] [Google Scholar]
- [25].Voltersvik P, Bostad L, Dyrhol-Riise AM, Eide GE, Røsok BI, Olofsson J, Asjö B. Cystatin A and HIV-1 p24 antigen expression in tonsillar lymphoid follicles during HIV-1 infection and during highly active antiretroviral therapy. J Acquir Immune Defic Syndr. 2006;41(3):277–284. doi: 10.1097/01.qai.0000199234.77081.a2. [DOI] [PubMed] [Google Scholar]
- [26].Horiike M, Iwami S, Kodama M, Sato A, Watanabe Y, Yasui M, Ishida Y, Kobayashi T, Miura T, Igarashi T. Lymph nodes harbor viral reservoirs that cause rebound of plasma viremia in SIV-infected macaques upon cessation of combined antiretroviral therapy. Virology. 2012;423(2):107–118. doi: 10.1016/j.virol.2011.11.024. [DOI] [PubMed] [Google Scholar]
- [27].Luo R, Cardozo EF, Piovoso MJ, Wu H, Buzón MJ, Martinez-Picado J, Zurakowski R. Modelling HIV-1 2-LTR dynamics following raltegravir intensification. J R Soc Interface. 2013;10(84):20130186. doi: 10.1098/rsif.2013.0186. [DOI] [PMC free article] [PubMed] [Google Scholar]
- [28].von Andrian UH, Mempel TR. Homing and cellular traffic in lymph nodes. Nat Rev Immunol. 2003;3(11):867–878. doi: 10.1038/nri1222. [DOI] [PubMed] [Google Scholar]
- [29].Girard J-P, Moussion C, Förster R. HEVs, lymphatics and homeostatic immune cell trafficking in lymph nodes. Nat Rev Immunol. 2012;12(11):762–773. doi: 10.1038/nri3298. [DOI] [PubMed] [Google Scholar]
- [30].Beltman JB, Marée AFM, Lynch JN, Miller MJ, De Boer RJ. Lymph node topology dictates T cell migration behavior. J Exp Med. 2007;204(4):771–780. doi: 10.1084/jem.20061278. [DOI] [PMC free article] [PubMed] [Google Scholar]
- [31].Mueller SN, Gebhardt T, Carbone FR, Heath WR. Memory T cell subsets, migration patterns, and tissue residence. Annu Rev Immunol. 2013;31:137–161. doi: 10.1146/annurev-immunol-032712-095954. [DOI] [PubMed] [Google Scholar]
- [32].Perelson AS, Wiegel FW. Scaling aspects of lymphocyte trafficking. J Theor Biol. 2009;257(1):9–16. doi: 10.1016/j.jtbi.2008.11.007. [DOI] [PMC free article] [PubMed] [Google Scholar]
- [33].Kirschner D, Webb GF, Cloyd M. Model of HIV-1 disease progression based on virus-induced lymph node homing and homing-induced apoptosis of CD4+ lymphocytes. J Acquir Immune Defic Syndr. 2000;24(4):352–362. doi: 10.1097/00126334-200008010-00010. [DOI] [PubMed] [Google Scholar]
- [34].Baldazzi V, Paci P, Bernaschi M, Castiglione F. Modeling lymphocyte homing and encounters in lymph nodes. BMC Bioinformatics. 2009;10:387. doi: 10.1186/1471-2105-10-387. [DOI] [PMC free article] [PubMed] [Google Scholar]
- [35].Marinho EBS, Bacelar FS, Andrade RFS. A model of partial differential equations for HIV propagation in lymph nodes. Physica A: Statistical Mechanics and its Applications. 2012;391(1–2):132–141. [Google Scholar]
- [36].Callaway DS, Perelson AS. HIV-1 infection and low steady state viral loads. Bull Math Biol. 2002;64(1):29–64. doi: 10.1006/bulm.2001.0266. [DOI] [PubMed] [Google Scholar]
- [37].Rong L, Perelson AS. Modeling latently infected cell activation: viral and latent reservoir persistence, and viral blips in HIV-infected patients on potent therapy. PLoS Comput Biol. 2009;5(10):e1000533. doi: 10.1371/journal.pcbi.1000533. [DOI] [PMC free article] [PubMed] [Google Scholar]
- [38].Perelson AS, Ribeiro RM. Modeling the within-host dynamics of HIV infection. BMC Biol. 2013;11(1):96. doi: 10.1186/1741-7007-11-96. [DOI] [PMC free article] [PubMed] [Google Scholar]
- [39].Nowak M, May R. Virus Dynamics: Mathematical Principles of Immunology and Virology. Oxford University Press; New York: 2000. [Google Scholar]
- [40].Wei X, Ghosh SK, Taylor ME, Johnson VA, Emini EA, Deutsch P, Lifson JD, Bonhoeffer S, Nowak MA, Hahn BH. Viral dynamics in human immunodeficiency virus type 1 infection. Nature. 1995;373(6510):117–122. doi: 10.1038/373117a0. [DOI] [PubMed] [Google Scholar]
- [41].Perelson A, Essunger P, Ho D. Dynamics of HIV-1 and CD4+ lymphocytes in vivo. AIDS. 1997;11(Suppl A):S17–24. [PubMed] [Google Scholar]
- [42].Ho DD, Neumann AU, Perelson AS, Chen W, Leonard JM, Markowitz M. Rapid turnover of plasma virions and CD4 lymphocytes in HIV-1 infection. Nature. 1995;373(6510):123–126. doi: 10.1038/373123a0. [DOI] [PubMed] [Google Scholar]
- [43].Murooka TT, Deruaz M, Marangoni F, Vrbanac VD, Seung E, von Andrian UH, Tager AM, Luster AD, Mempel TR. HIV-infected T cells are migratory vehicles for viral dissemination. Nature. 2012;490(7419):283–287. doi: 10.1038/nature11398. [DOI] [PMC free article] [PubMed] [Google Scholar]
- [44].Bielecki A, Kalita P, Lewandowski M, Skomorowski M. Compartment model of neuropeptide synaptic transport with impulse control. Biol Cybern. 2008;99(6):443–458. doi: 10.1007/s00422-008-0250-0. [DOI] [PubMed] [Google Scholar]
- [45].Bielecki A, Kalita P. Model of neurotransmitter fast transport in axon terminal of presynaptic neuron. Journal of Mathematical Biology. 2008;56(4):559–576. doi: 10.1007/s00285-007-0131-5. [DOI] [PubMed] [Google Scholar]
- [46].Dreij K, Chaudhry QA, Jernstrm B, Morgenstern R, Hanke M. A method for efficient calculation of diffusion and reactions of lipophilic compounds in complex cell geometry. PLoS ONE. 2011;6(8):e23128. doi: 10.1371/journal.pone.0023128. doi:10.1371/journal.pone.0023128. URL http://dx.doi.org/10.1371/journal.pone.0023128. [DOI] [PMC free article] [PubMed] [Google Scholar]
- [47].Luo R, Piovoso MJ, Martinez-Picado J, Zurakowski R. HIV model parameter estimates from interruption trial data including drug efficacy and reservoir dynamics. PLoS ONE. 2012;7(7):e40198. doi: 10.1371/journal.pone.0040198. [DOI] [PMC free article] [PubMed] [Google Scholar]
- [48].Crosley LK, Duthie SJ, Polley AC, Bouwman FG, Heim C, Mulholland F, Horgan G, Johnson IT, Mariman EC, Elliott RM, Daniel H, de Roos B. Variation in protein levels obtained from human blood cells and biofluids for platelet, peripheral blood mononuclear cell, plasma, urine and saliva proteomics. Genes Nutr. 2009;4(2):95–102. doi: 10.1007/s12263-009-0121-x. [DOI] [PMC free article] [PubMed] [Google Scholar]
- [49].Reigadas S, Andréola M-L, Wittkop L, Cosnefroy O, Anies G, Recordon-Pinson P, Thiébaut R, Masquelier B, Fleury H. Evolution of 2-long terminal repeat (2-LTR) episomal HIV-1 DNA in raltegravir-treated patients and in in vitro infected cells. J Antimicrob Chemother. 2010;65(3):434–437. doi: 10.1093/jac/dkp473. [DOI] [PubMed] [Google Scholar]
- [50].Zhu W, Jiao Y, Lei R, Hua W, Wang R, Ji Y, Liu Z, Wei F, Zhang T, Shi X, Wu H, Zhang L. Rapid turnover of 2-LTR HIV-1 DNA during early stage of highly active antiretroviral therapy. PLoS ONE. 2011;6(6):e21081. doi: 10.1371/journal.pone.0021081. [DOI] [PMC free article] [PubMed] [Google Scholar]
- [51].Orenstein JM, Feinberg M, Yoder C, Schrager L, Mican JM, Schwartzentruber DJ, Davey RT, Walker RE, Falloon J, Kovacs JA, Miller KD, Fox C, Metcalf JA, Masur H, Polis MA. Lymph node architecture preceding and following 6 months of potent antiviral therapy: follicular hyperplasia persists in parallel with p24 antigen restoration after involution and CD4 cell depletion in an AIDS patient. AIDS. 1999;13(16):2219–2229. doi: 10.1097/00002030-199911120-00004. [DOI] [PubMed] [Google Scholar]
- [52].Swartz MA. The physiology of the lymphatic system. Adv. Drug Deliv. Rev. 2001;50(1–2):3–20. doi: 10.1016/s0169-409x(01)00150-8. [DOI] [PubMed] [Google Scholar]
- [53].Lai BE, Henderson MH, Peters JJ, Walmer DK, Katz DF. Transport theory for HIV diffusion through in vivo distributions of topical microbicide gels. Biophys. J. 2009;97(9):2379–2387. doi: 10.1016/j.bpj.2009.08.010. [DOI] [PMC free article] [PubMed] [Google Scholar]
- [54].Murray AG, Jackson GA. Viral dynamics: a model of the effects of size, shape, motion and abundance of single-celled planktonic organisms and other particles. Mar. Ecol. Prog. Ser. 1992;89:103–116. [Google Scholar]
- [55].Bazzoli C, Jullien V, Le Tiec C, Rey E, Mentré F, Taburet A-M. Intracellular Pharmacokinetics of Antiretroviral Drugs in HIV-Infected Patients, and their Correlation with Drug Action. Clin Pharmacokinet. 2010;49(1):17–45. doi: 10.2165/11318110-000000000-00000. [DOI] [PubMed] [Google Scholar]