

INTRODUCTION
Discography was first introduced in 1948 as a diagnostic tool to determine the disc level implicated in low back pain. Discography procedures include a fluoroscopically guided injection of fluids to pressurize the disc space and evaluate patients’ subjective pain response. In conventional provocation discography, contrast agent is injected into the disc to help visualize disc abnormalities and induce pressure which helps identify which disc is the pain generator [1]. Patients are asked to grade their pain after injection and if the pain is concordant or discordant to their back pain symptoms. Both the benefits and complications of performing discography on patients prior to planning back pain treatment or surgery have been reported. Some discography procedures include the use of anesthetics. These may be mixed directly with the contrast agent [2, 3], injected alone without contrast media [2], or may be added after a traditional provocation discography with or without the use of an intradiscal catheter for functional testing [2, 4-6]. It is under investigation if using anesthetic in discography procedures will decrease the false positive rate of conventional provocation discography [2-6].
Currently, discography remains a controversial tool and its practice varies greatly among the institutions that specialize in spine care—from a common procedure to a procedure rarely used. Negative effects on disc morphology observed 10 years after discography, as demonstrated in the study by Carragee et al., are felt attributable to the mechanical effects of the needle [7]. However, the injected reagents may have contributed to or perhaps been a primary cause of the findings [8]. Recent reports also have found that bupivacaine, a local anesthetic commonly injected into the disc, may be cytotoxic to intervertebral disc cells [9, 10]. This may also lead to increased disc degeneration in asymptomatic discs [9, 11]. In addition, local anesthetics are also known to be toxic to articular chondrocytes [12-15], which are similar in phenotype to intervertebral disc (IVD) cells.
In this study, we compared the cytotoxic effects of two contrast agents, iopamidol and iohexol, and two anesthetic agents, lidocaine and bupivacaine, commonly used in our clinic using nucleus pulposus (NP) and annulus fibrosus (AF) cells in a three-dimensional (3-D) culture system. In the last set of experiments, the contrast dyes and anesthetics were mixed together and then exposed to NP and AF cells for 6 hours to determine if the cytotoxic effects of these agents were synergistic or not. We hypothesize that local anesthetics, contrast agents or a combination of these reagents commonly injected into the disc space during discography may result in cytotoxicity in vitro. Studies on the effects of these agents on IVD cells will help guide their usage in future clinical practices.
MATERIALS AND METHODS
Tissue collection and culture
Bovine IVDs were isolated from tails of young adult (15-18 month-old) calves, obtained from a local slaughterhouse (Aurora Packing Company Incorporated, Aurora, IL). The IVDs at levels coccygeal 1-4 were isolated from four tails, separated into the NP and the outer 2/3 of the AF. The NP and AF tissues from the different levels were pooled for each experiment. The cells were first released by enzymatic digestion {0.2% pronase (Calbiochem) for 1 hour and 0.025% collagenase-P (Roche, Indianapolis, IN) for 18 hours} and then suspended in 1.2% low viscosity alginate (Keltone LVCR, FMC Biopolymer, Philadelphia, PA) at 2 × 10⁶ cells per mL. The beads were cultured as previously described [16, 17]. Briefly, the NP and AF cultures were maintained in complete media {Dulbecco’s modified Eagle medium (DMEM) and Ham’s F-12 medium (DMEM/F12: 1/1, Mediatech, Herndon, VA) containing 20% fetal bovine serum (FBS, Omega Scientific), 25 μg/ml ascorbic acid (Sigma Chemical, St. Louis, MO), 360 μg/ml L-glutamine (Mediatech) and 50 μg/ml gentamicin (Gibco BRL, Grand Island, NY)}. The beads were cultured at 37°C for 10 to 14 days. Media was changed 3 times a week [16, 17].
Treatment with anesthetics or non-ionic contrast agents
Reagents used in this study include: lidocaine (1-2% Lidocaine, Hospira, Lake Forest, IL); bupivacaine (0.5% Markaine, Hospira, Lake Forest, IL); saline (0.9% Sodium Chloride, Baxter Healthcare, Deerfield, IL); iopamidol (Isovue-M 300, Bracco Diagnostics, Princeton, NJ); and iohexol (Omnipaque-240, GE Healthcare, Princeton, NJ).
After 10 to14 days of culturing in vitro, two beads were placed in each well in a 24-well plate (Corning). Beads were treated with different concentrations of anesthetics, non-ionic contrast agents or saline as a control for 2, 6, and 16 hours. Lidocaine and bupivacaine were diluted with the same amount of complete media (500 μl) and different amounts of saline (0 to 500 μl) to reach the desired concentrations: 0.25%, 0.125%, or 0.0625%. Iopamidol and iohexol were diluted with the same amount of complete media (500 μl) and different amounts of saline (0 to 250 μl) to reach the desired dilutions: 1:2 or 1:4. After treatment, the solution was aspirated and the beads were washed two times with saline. Samples were examined with the LIVE/DEAD assay (Invitrogen) according to the manufacturer’s directions. Time course and concentration dependent experiments were performed on two to three sets of bovine cells.
Treatment with a combination of anesthetics and non-ionic contrast agents
Two beads were placed in each well in a 24-well plate (Corning). Beads were treated for 6 hours with a combination of an anesthetic and a non-ionic contrast agent or each reagent alone as controls. The treatment solutions were made with the same amount of complete media (500 μl) and saline was added until lidocaine was at final concentration of 0.5%; bupivacaine was at a concentration of 0.125%; and both contrast agents were diluted to 1:2. After treatment, the solutions were aspirated and beads were washed two times with saline. Samples were examined with the LIVE/DEAD assay (Invitrogen).
Cell viability/cytotoxicity assay
Beads were transferred to a 1.5 ml tube where 300 μl of calcein/ethidium homodimer solution from the LIVE/DEAD assay kit (Invitrogen) was added. Calcein/ethidium homodimer solution was made by diluting 1.2 μl calcein AM and 6 μl ethidium homodimer-1 into 1 mL of phosphate buffered saline (PBS). In this assay, esterase made in live cells converts non-fluorescent calcein AM into fluorescent calcein. Fluorescent calcein is retained in the live cells and produces a green fluorescence. Ethidium homodimer-1 (EthD-1) is excluded from live cells but can enter cells with damaged membranes. As it binds to DNA of dead cells, the cells fluoresce red. Alginate beads in solution were incubated at room temperature for 30 minutes. Each alginate bead was removed from the 24-well plate and placed on a microscope slide. A cover glass was put on the bead and pressed to spread the bead and cells over the slide. Slides were then viewed at excitation/emission wavelengths: 495nm/515nm to detect calcein AM and excitation/emission wavelengths: 495nm/635nm to detect ethidium homodimer-1 with a fluorescent microscope (Nikon Eclipse, Nikon Instruments, Melville, NY) or with the Olympus Fluoview Laser Confocal system (Olympus America, Center Valley, PA). Live cells fluoresced green and dead cells fluoresced red. One to two hundred fluorescent cells were counted for each treatment and the percentage of red and green cells were calculated and compared between treatments.
RESULTS
Effects of anesthetics on AF and NP bovine cell viability are concentration dependent
AF and NP cells encapsulated in alginate were treated with different concentrations of lidocaine and bupivacaine in vitro. Bupivacaine and lidocaine were diluted to 0.25%, 0.125% and 0.0625% with the same amount of complete media and different amounts of saline solution to achieve these concentrations. After 6 hours of treatment, the cells were assayed using the LIVE/DEAD assay (Invitrogen). To evaluate the effects of reagents in various concentrations, two to three sets of cells were treated; and the percentage of live and dead cells were averaged between these experiments. After treatment with 0.25% bupivacaine, only 0 to 1% of the AF cells remained alive and fluoresced green while 99-100% of the AF fluoresced red (Figure 1A). At the same treatment, 27% of NP cells remained alive and 73% fluoresced red (Figure 1B). NP cells encapsulated in alginate may be more tolerant to bupivacaine than AF cells. At lower concentrations of bupivacaine (0.125% and 0.0625%), less cell death occurred in both NP and AF cells.
Figure 1. Cytotoxic effects of anesthetics on bovine annulus fibrosus (AF) and nucleus pulposus (NP) cells 6 hours after treatment.
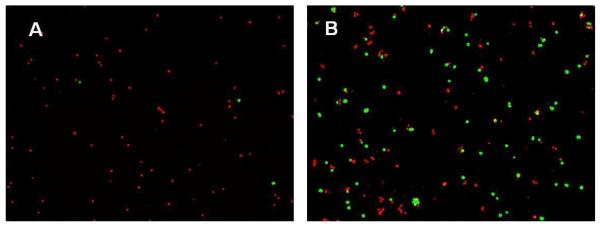
AF cells (A) and NP cells (B) were treated for 6 hours with 0.25% of bupivacaine. Cell viability and cytotoxicity were determined by using the LIVE/DEAD assay. Viable cells fluoresced green while cells with permeable membranes fluoresced red (A, B).
Treatment with 0.125% bupivacaine allowed the survival of only 28% of the AF cells and 37% of NP cells (Figure 2A and 2B). When diluted to 0.0625%, bupivacaine was less cytotoxic: 83% of AF cells and 79.5% of NP cells survived treatment (Figure 2A and 2B). At these concentrations, bupivacaine demonstrated a concentration dependent cytotoxicity on AF and NP cells. Cytotoxicity of 0.25% to 0.0625% lidocaine was similar to control levels in both NP and AF cells at 6 hours.
Figure 2. Cytotoxic effects of anesthetics on bovine annulus fibrosus (AF) and nucleus pulposus (NP) cells 6 hours after treatment.
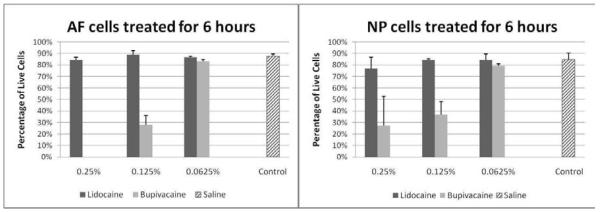
Percentage of viable cells after 6 hours of treatment with 0.25%, 0.125%, and 0.0625% of bupivacaine and lidocaine or with saline control in AF cells (n=3) (Left Panel) and NP cells (n=2) (Right Panel).
Effects of anesthetics on AF and NP bovine cell viability are time dependent
To determine if cytotoxicity of local anesthetics was time dependent, AF and NP cells were treated with lidocaine and bupivacaine for different time periods: 2, 6, and 16 hours of treatment. Two to three sets of cells were treated with local anesthetics, and percentage of live and dead cells were averaged between these experiments. Treatment with bupivacaine demonstrated concentration and time dependent cytotoxic effects (Figure 3A and 3B). When treating the cells with 0.25% bupivacaine, most of the cell death occurred before the 2 hour time point. Cytotoxic effects of 0.125% bupivacaine was time dependent on both AF and NP cells. At 2 hours post treatment with 0.125% bupivacaine, about 70% of the AF and NP cells survived. As time progressed, this concentration of bupivacaine induced cytotoxicity in both AF and NP cells. Treatment at the lowest concentration—0.0625% bupivacaine demonstrated little to no cell death when compared to treatment with the saline control. When treating cells with 0.25% to 0.0625% lidocaine, the cytotoxic levels were similar to control at all the time points (Figure 3C and 3D).
Figure 3. Cytotoxic effects of anesthetics may be time and concentration dependent.

Bovine AF (n=3) and NP (n=2) cells were treated with different concentrations of lidocaine and bupivacaine for different time periods. Cell viability and cytotoxicity were determined using the LIVE/DEAD assay. (A) AF and (B) NP cells were treated with bupivacaine diluted to 0.25%, 0.125% and 0.0625% for 2, 6 and 16 hours. (C) AF and (D) NP cells were treated with lidocaine diluted to 0.25%, 0.125% and 0.0625% for 2, 6 and 16 hours.
In our clinical practice, we commonly use 0.25% bupivacaine and 1% lidocaine, thus we consider 0.125% bupivacaine and 0.5% lidocaine as equipotent concentrations. When AF and NP cells were treated with bupivacaine (0.125%) and lidocaine (0.5%), both treatments resulted in more cell death than saline treatment (p<0.05) (Figure 5). When comparing bupivacaine and lidocaine at these concentrations, bupivacaine exposure resulted in more cell death in NP cells in vitro than lidocaine (p<0.05). In AF cells, there was a trend for bupivacaine to cause more cell death than lidocaine, but this trend was not significant. NP cells did demonstrate a significant difference in resistance to lidocaine when compared to AF cells using a paired Student t-test (p<0.05).
Figure 5. Comparison of the cytotoxic effects of anesthetics and contrast agents in equipotent concentrations.

Bovine AF and NP cells were treated with equipotent concentrations of anesthetics or contrast agents for 6 hours. Iopamidol and iohexol were diluted 1:2; and lidocaine and bupivacaine were diluted 1:4 to a final concentration of 0.5% and 0.125%, respectively. Cell viability and cytotoxicity were determined using the LIVE/DEAD assay. Number of trials of NP and AF cells is indicated in the table. (* p<0.05 using the Student t-test, ** p<0.05 using the paired Student t-test)
Effects of non-ionic contrast dyes on AF and NP cell viability
To determine if non-ionic contrast dyes (iohexol and iopamidol) are cytotoxic to IVD cells, AF and NP cells were treated with these contrast agents at different concentrations and for different time periods. Iopamidol, diluted at 1:2, was slightly cytotoxic to AF cells when compared to saline after 6 hours and 16 hours of treatment (Figure 4A). As seen in the anesthetics studies, NP cells seem more resistant to cell death than AF cells. After treatment with iopamidol, NP cell viability was not different from saline (Figure 4B). When iopamidol was diluted 1:4, the cytotoxicity of iopamidol was similar to control levels at all treatment time periods. The other non-ionic contrast dye, iohexol, was no more toxic than saline control when treating NP and AF cells at these time points and dilutions (Figure 4C and 4D).
Figure 4. Cytotoxic effects of non-ionic contrast agents.

Bovine AF (n=3) and NP (n=2) cells were treated with different concentrations of iopamidol and iohexol for different time periods. Cell viability and cytotoxicity were determined using the LIVE/DEAD assay. (A) AF and (B)
NP cells were treated with iopamidol diluted to 1:2 and 1:4 for 2, 6 and 16 hours. (C) AF and (D) NP cells were treated with iohexol diluted to 1:2 and 1:4 for 2, 6 and 16 hours.
When the experiment was repeated 4 to 6 times at the 1:2 dilution, cytotoxicity in AF cells after treatment with iopamidol (n=6, p<0.05) or iohexol (n=5, p<0.05) was significantly different from saline treated cells (Figure 5). In the NP cells, there was no significant difference between treatment with saline and with iopamidol (n=5, p>0.05) or iohexol (n=4, p>0.05). NP cells did demonstrate a significant difference in resistance to iopamidol when compared to AF cells (p<0.05).
Effects of combining anesthetics with non-ionic contrast dyes on AF and NP cell viability
NP and AF cells encapsulated in alginate were treated with different combinations of lidocaine, bupivacaine, iohexol and iopamidol. Since 0.25% lidocaine did not show cytotoxic effects in this assay, a higher concentration of lidocaine was used. The following mixtures were made: iohexol with lidocaine, iopamidol with lidocaine, iohexol with bupivacaine, and iopamidol with bupivacaine. In these solutions, lidocaine was at final concentration of 0.5%, bupivacaine was at a concentration of 0.125%, and both contrast agents were diluted to 1:2. AF and NP cells were treated with these different combinations or with each reagent alone for 6 hours and tested for cell viability and toxicity. As seen before, cells incubated with anesthetics alone had more cytotoxicity in both AF and NP cells than when incubated with contrast dyes. When bupivacaine was mixed with non-ionic contrast agents, the viability of NP cells increased from an average of 28% to 44% with iopamidol and 54% with iohexol (n=4, p=0.067) (Figure 6, right panel). At a similar but lesser extent, viability of NP cells increased from an average of 68% to 78% when lidocaine was mixed with either contrast agent (n=4, p=0.269) (Figure 6, right panel). A similar trend was seen in AF cells (Figure 6, left panel). When contrast agents were mixed with these anesthetics, instead of a synergistic effect, there was a trend for the contrast agents to decrease the cytotoxic effects of the anesthetics but this decrease was not significant.
Figure 6. Cytotoxic effects of a combination of anesthetics and non-ionic contrast agents.

Bovine AF (Left Panel) and NP (Right Panel) cells were treated with different combinations of anesthetics and contrast agents for 6 hours. Iopamidol and iohexol were diluted 1:2; and lidocaine and bupivacaine were diluted 1:4 to a final concentration of 0.5% and 0.125%, respectively. Cell viability and cytotoxicity were determined using the LIVE/DEAD assay.
DISCUSSION
Discography remains a controversial tool among clinicians to identify which or if any IVD level is the likely pain generator and a potential surgical target. Our studies, as well as other studies, have demonstrated the toxic effects of these reagents at the cellular level. It has yet to be determined whether this cytotoxicity translates to the clinical setting.
At the cellular level, studies have shown that local anesthetics can be cytotoxic to specific cell types in vitro and in vivo. Extensive studies have shown that local anesthetics have toxic effects on neuronal cells cultured in vitro [18-20]. In animal studies, lidocaine has been shown to be more neurotoxic to rats [21] than bupivacaine at equipotent concentrations (10% lidocaine and 2.13% bupivacaine). In rabbit studies, 8 to 10% lidocaine has been demonstrated to be neurotoxic [22, 23]. The other local anesthetic, bupivacaine, has been shown to be degenerative [24] and to decrease muscle function [25] in rats. These studies also showed that, over time, bupivacaine was not completely destructive but had some regenerative and healing effects. In larger animal models such as sheep, Morishima et al. showed both central nervous system and cardiovascular toxicity of bupivacaine [26]. Bupivacaine has also been found to be cardiotoxic in organ studies using isolated rabbit hearts [27]. At the molecular level, bupivacaine binds to cardiac sodium channels more extensively than lidocaine which can depress conduction in cardiac tissue [28]. This may explain why bupivacaine is more cytotoxic than lidocaine to certain cell types.
Our 3-D tissue culture studies suggest that bupivacaine is more toxic to IVD cells than lidocaine when diluted to the same concentrations. This is not surprising since bupivacaine is clinically used at lower doses than lidocaine. Concentrations of bupivacaine found in the clinics range from 0.1% to 0.75%, while concentrations of lidocaine injectable range from 1% to 4%. When treating cells with equipotent concentrations such as 0.5% lidocaine and 0.125% bupivacaine, we continue to see more cell death in bupivacaine treated cells (Figure 5). These in vitro results would support that lidocaine at these low concentrations would be a less cytotoxic anesthetic than bupivacaine when used in discography. Reports of exposing articular chondrocytes cultures at higher concentrations of lidocaine (1 to 2%) demonstrated cell death [12, 15]. In some spine clinics, 4% lidocaine is injected after a provocation discography [2]. At this high concentration of lidocaine, we would expect to see more cell death.
Contrast agents have also been found to have toxic effects in vivo and in vitro. Due to their prolonged retention in the kidneys of rats, contrast agents have been shown to have cytotoxic effects on renal cells [29, 30]. In cell culture studies using kidney cells, ionic contrast dyes (diatrizoate and ioxaglate) were significantly more cytotoxic than the non-ionic contrast dyes such as iohexol and iodixanol [31]. In our IVD cell studies, we did not test the ionic contrast dyes. We only tested the differences in cytotoxicity between two non-ionic contrast dyes. Although, both contrast agents were less cytotoxic to IVD cells than bupivacaine in these studies, there was a trend for iopamidol to be more toxic to IVD cells than iohexol. Iopamidol 300 is higher in osmolality and viscosity than Iohexol 240. Iopamidol 300 also has 300 mg organically bound iodine per mL while Iohexol 240 has 240 mg organically bound iodine per mL. These factors may account for the slight difference in cytotoxicity [29, 31]. Our in vitro results would support that iohexol is a less cytotoxic contrast agent than iopamidol when used in discography. More extensive studies to control for the iodine content, osmolality and viscosity of the two reagents may be needed to understand the molecular mechanisms of the cytotoxicity. Mixing the non-ionic contrast dyes with anesthetics did not have an additive effect on cell death. Studies have shown that mixing contrast agents, local anesthetics and steroids together did not affect the stability of the agents [32]. It is unclear if the non-ionic contrast agent can dampen the anesthetics from binding to sodium channels. Derby et al. have reported that mixing contrast dye and anesthetics 1:1 in automated pressure-controlled provocative discography did not significantly provide overall subject pain relief compared to using contrast dyes alone [2, 3]. When comparing functional anesthetic discography where anesthetics were added through catheters after the contrast dye to provocative discography, Alamin et al. were able to reduce the number of positive levels and altered the treatment plan for 49% of the patients with functional anesthetic discography [4]. Also, DePalma et al. found that 80% of the 35 painful discs identified with provocative discography yielded 50% or greater pain relief after administering anesthetics [5]. More studies will be needed to determine what effect the non-ionic contrast dyes have on the anesthetics.
It remains to be seen if these local anesthetics are cytotoxic to IVD cells in vivo. Since the cytotoxicity seen in these studies can be time and concentration dependent, a high diffusion rate of the anesthetics out of the IVD would expose the IVD cells to lesser amounts of anesthetics and cause less cytotoxicity than these studies have suggested. On the other hand, molecules can be trapped in the extracellular matrix and may remain there for longer periods of time, longer than the scope of this study. In this case, IVD cells will be exposed to anesthetics and contrast agents for longer periods of time, which may cause long term cytotoxic effects. It has yet to be determined if contrast dyes are retained in the disc for long periods of time causing significant cytotoxicity as seen in renal cells [29, 30]. The next logical steps in experimentation are studies in the explant IVD culture system in vitro and in animal models in vivo. The explant culture system would allow the reagents to diffuse out of or be retained in the IVD altering the cytotoxic effects of the reagents. However, since there is no tissue repair mechanism in this model, the effects of disc injury with the needle used to inject the reagents cannot be assessed. Finally, experiments in an in vivo model will be needed to demonstrate cell death that may be caused by needle injury, diffusion and retention rates of reagents in the IVD and the toxicity of the reagent itself.
A wide variety of anesthetics and contrast agents are available to clinicians. Identifying which anesthetic, contrast agent and combination of reagents are less cytotoxic to IVD cells would be useful for clinicians to decide which reagents would be most safe in discography. Based on our results and those by Lee et al. [9] and Wang et al. [10], local anesthetics are toxic to IVD cells at least in vitro. Our studies and those by Gruber et al. [8] showed that iopamidol can also have a toxic effect on cells in vitro. This toxic effect was smaller than those of the anesthetics in our studies. The caveat with these in vitro studies is that we do not know if the cytotoxicity translates to disc cells in vivo. On the other hand, standard provocation discography or some variation of analgesic discography may help physicians narrow down which discs if any would need to undergo surgical procedures and ultimately achieve a successful outcome. Clinicians and patients will need to weigh the risks of the toxicity of the injection agents against the potential benefit of the therapeutic guidance offered by discography, including the possibility of preventing an unnecessary surgical procedure.
Footnotes
Publisher's Disclaimer: This is a PDF file of an unedited manuscript that has been accepted for publication. As a service to our customers we are providing this early version of the manuscript. The manuscript will undergo copyediting, typesetting, and review of the resulting proof before it is published in its final citable form. Please note that during the production process errors may be discovered which could affect the content, and all legal disclaimers that apply to the journal pertain.
REFERENCES
- [1].Bogduk N, editor. Practice guidelines for spinal diagnostic and treatment proceduresed. International Spine Intervention Society; San Francisco: 2004. [Google Scholar]
- [2].Derby R, Aprill CN, Lee JE, Depalma MJ, Baker RM. Comparison of Four Different Analgesic Discogram Protocols Comparing the Incidence of Reported Pain Relief Following Local Anesthetic Injection into Concordantly Painful Lumbar Intervertebral Discs. Pain Med. 2012;13:1547–53. doi: 10.1111/j.1526-4637.2012.01499.x. [DOI] [PubMed] [Google Scholar]
- [3].Derby R, Lee JE, Lee SH. Analgesic discography: effect of adding a local anesthetic to routine lumbar provocation discography. Pain Med. 2010;11:1335–42. doi: 10.1111/j.1526-4637.2010.00930.x. [DOI] [PubMed] [Google Scholar]
- [4].Alamin TA, V, Carragee E. FAD versus Provocative Discography: Comparative Results and Postoperative Clinical Outcomes. Proceedings of the NASS 22nd Annual Meeting.2007. p. 39S. [Google Scholar]
- [5].DePalma MJ, Lee JE, Peterson L, Wolfer L, Ketchum JM, Derby R. Are outer annular fissures stimulated during diskography the source of diskogenic low-back pain? An analysis of analgesic diskography data. Pain Med. 2009;10:488–94. doi: 10.1111/j.1526-4637.2009.00602.x. [DOI] [PubMed] [Google Scholar]
- [6].Haider NR, TJ, Ali RK. Dynamic Anesthetic Discography: Technique, Indications, And Clinical Follow Up From The First 100 Patients. International Spine Intervention Society Annual Meeting.2009. [Google Scholar]
- [7].Carragee EJ, Don AS, Hurwitz EL, Cuellar JM, Carrino JA, Herzog R. 2009 ISSLS Prize Winner: Does discography cause accelerated progression of degeneration changes in the lumbar disc: a ten-year matched cohort study. Spine (Phila Pa 1976) 2009;34:2338–45. doi: 10.1097/BRS.0b013e3181ab5432. [DOI] [PubMed] [Google Scholar]
- [8].Gruber HE, Rhyne AL, 3rd, Hansen KJ, Phillips RC, Hoelscher GL, Ingram JA, et al. Deleterious effects of discography radiocontrast solution on human annulus cell in vitro: changes in cell viability, proliferation, and apoptosis in exposed cells. Spine J. 2012;12:329–35. doi: 10.1016/j.spinee.2012.02.003. [DOI] [PubMed] [Google Scholar]
- [9].Lee H, Sowa G, Vo N, Vadala G, O’Connell S, Studer R, et al. Effect of bupivacaine on intervertebral disc cell viability. Spine J. 2010;10:159–66. doi: 10.1016/j.spinee.2009.08.445. [DOI] [PubMed] [Google Scholar]
- [10].Wang D, Vo NV, Sowa GA, Hartman RA, Ngo K, Choe SR, et al. Bupivacaine decreases cell viability and matrix protein synthesis in an intervertebral disc organ model system. Spine J. 2011;11:139–46. doi: 10.1016/j.spinee.2010.11.017. [DOI] [PMC free article] [PubMed] [Google Scholar]
- [11].Vo N, Sowa G, Ngo K, Wang D, Hartman R, Coelho P, et al. Bupivacaine Toxicity in Intervertebral Disc Tissue; Affiliated Society Meeting Abstracts; Spine. 2010 October.p. 74. [Google Scholar]
- [12].Karpie JC, Chu CR. Lidocaine exhibits dose- and time-dependent cytotoxic effects on bovine articular chondrocytes in vitro. Am J Sports Med. 2007;35:1621–7. doi: 10.1177/0363546507304719. [DOI] [PubMed] [Google Scholar]
- [13].Piper SL, Kim HT. Comparison of ropivacaine and bupivacaine toxicity in human articular chondrocytes. J Bone Joint Surg Am. 2008;90:986–91. doi: 10.2106/JBJS.G.01033. [DOI] [PubMed] [Google Scholar]
- [14].Syed HM, Green L, Bianski B, Jobe CM, Wongworawat MD. Bupivacaine and Triamcinolone May Be Toxic To Human Chondrocytes: A Pilot Study. Clin Orthop Relat Res. 2011;469:2941–47. doi: 10.1007/s11999-011-1834-x. [DOI] [PMC free article] [PubMed] [Google Scholar]
- [15].Grishko V, Xu M, Wilson G, Pearsall AWt. Apoptosis and mitochondrial dysfunction in human chondrocytes following exposure to lidocaine, bupivacaine, and ropivacaine. J Bone Joint Surg Am. 2010;92:609–18. doi: 10.2106/JBJS.H.01847. [DOI] [PubMed] [Google Scholar]
- [16].Zhang Y, An HS, Song S, Toofanfard M, Masuda K, Andersson GB, et al. Growth factor osteogenic protein-1: differing effects on cells from three distinct zones in the bovine intervertebral disc. Am J Phys Med Rehabil. 2004;83:515–21. doi: 10.1097/01.phm.0000130031.64343.59. [DOI] [PubMed] [Google Scholar]
- [17].Zhang Y, An HS, Toofanfard M, Li Z, Andersson GB, Thonar EJ. Low-dose interleukin-1 partially counteracts osteogenic protein-1-induced proteoglycan synthesis by adult bovine intervertebral disk cells. Am J Phys Med Rehabil. 2005;84:322–9. doi: 10.1097/01.phm.0000159972.85053.7e. [DOI] [PubMed] [Google Scholar]
- [18].Perez-Castro R, Patel S, Garavito-Aguilar ZV, Rosenberg A, Recio-Pinto E, Zhang J, et al. Cytotoxicity of local anesthetics in human neuronal cells. Anesth Analg. 2009;108:997–1007. doi: 10.1213/ane.0b013e31819385e1. [DOI] [PubMed] [Google Scholar]
- [19].Radwan IA, Saito S, Goto F. The neurotoxicity of local anesthetics on growing neurons: a comparative study of lidocaine, bupivacaine, mepivacaine, and ropivacaine. Anesth Analg. 2002;94:319–24. doi: 10.1097/00000539-200202000-00016. [DOI] [PubMed] [Google Scholar]
- [20].Werdehausen R, Fazeli S, Braun S, Hermanns H, Essmann F, Hollmann MW, et al. Apoptosis induction by different local anaesthetics in a neuroblastoma cell line. Br J Anaesth. 2009;103:711–8. doi: 10.1093/bja/aep236. [DOI] [PubMed] [Google Scholar]
- [21].Sakura S, Kirihara Y, Muguruma T, Kishimoto T, Saito Y. The comparative neurotoxicity of intrathecal lidocaine and bupivacaine in rats. Anesth Analg. 2005;101:541–7. doi: 10.1213/01.ANE.0000155960.61157.12. [DOI] [PubMed] [Google Scholar]
- [22].Ready LB, Plumer MH, Haschke RH, Austin E, Sumi SM. Neurotoxicity of intrathecal local anesthetics in rabbits. Anesthesiology. 1985;63:364–70. [PubMed] [Google Scholar]
- [23].Yamashita A, Matsumoto M, Matsumoto S, Itoh M, Kawai K, Sakabe T. A comparison of the neurotoxic effects on the spinal cord of tetracaine, lidocaine, bupivacaine, and ropivacaine administered intrathecally in rabbits. Anesth Analg. 2003;97:512–9. doi: 10.1213/01.ANE.0000068885.78816.5B. [DOI] [PubMed] [Google Scholar]
- [24].Benoit PW, Belt WD. Destruction and regeneration of skeletal muscle after treatment with a local anaesthetic, bupivacaine (Marcaine) J Anat. 1970;107:547–56. [PMC free article] [PubMed] [Google Scholar]
- [25].McNeill Ingham SJPAC, Oliveira DA, Garcia Lisboa BC, Beutel A, Valero-Lapchik VB, Ferreira AM, Abdalla RJ, Cohen M, Han SW. Bupivacaine injection leads to muscle force reduction and histologic changes in a murine model. Pm R. 2011;3:1106–9. doi: 10.1016/j.pmrj.2011.05.027. [DOI] [PubMed] [Google Scholar]
- [26].Morishima HO, Pedersen H, Finster M, Hiraoka H, Tsuji A, Feldman HS, et al. Bupivacaine toxicity in pregnant and nonpregnant ewes. Anesthesiology. 1985;63:134–9. doi: 10.1097/00000542-198508000-00003. [DOI] [PubMed] [Google Scholar]
- [27].Simon L, Kariya N, Edouard A, Benhamou D, Mazoit JX. Effect of bupivacaine on the isolated rabbit heart: developmental aspect on ventricular conduction and contractility. Anesthesiology. 2004;101:937–44. doi: 10.1097/00000542-200410000-00019. [DOI] [PubMed] [Google Scholar]
- [28].Clarkson CW, Hondeghem LM. Mechanism for bupivacaine depression of cardiac conduction: fast block of sodium channels during the action potential with slow recovery from block during diastole. Anesthesiology. 1985;62:396–405. [PubMed] [Google Scholar]
- [29].Duarte CG, Zhang J, Ellis S. Review of studies establishing the aging male spontaneously hypertensive rat as a detector and quantifier of the kidney toxicity of radiocontrast media and other chemicals. Invest Radiol. 2001;36:56–63. doi: 10.1097/00004424-200101000-00008. [DOI] [PubMed] [Google Scholar]
- [30].Jost G, Pietsch H, Sommer J, Sandner P, Lengsfeld P, Seidensticker P, et al. Retention of iodine and expression of biomarkers for renal damage in the kidney after application of iodinated contrast media in rats. Invest Radiol. 2009;44:114–23. doi: 10.1097/RLI.0b013e318190fbd2. [DOI] [PubMed] [Google Scholar]
- [31].Schick CS, Haller C. Comparative cytotoxicity of ionic and non-ionic radiocontrast agents on MDCK cell monolayers in vitro. Nephrol Dial Transplant. 1999;14:342–7. doi: 10.1093/ndt/14.2.342. [DOI] [PubMed] [Google Scholar]
- [32].Shah K, Watson D, Campbell C, Meek RM. Intra-articular injection composed of steroid, iohexol and local anaesthetic: is it stable? Br J Radiol. 2009;82:109–11. doi: 10.1259/bjr/47132569. [DOI] [PubMed] [Google Scholar]