

Summary
To evaluate the association between haemoglobinuria and chronic kidney disease (CKD) in sickle cell anaemia (SCA), we analysed 356 adult haemoglobin SS or Sβ° thalassaemia patients from the University of Illinois at Chicago (UIC) and 439 from the multi-centre Walk-Treatment of Pulmonary Hypertension and Sickle Cell Disease with Sildenafil Therapy (PHaSST) cohort. CKD was classified according to National Kidney Foundation Kidney Disease Outcomes Quality Initiatives guidelines. Haemoglobinuria, defined as positive haem on urine dipstick with absent red blood cells on microscopy, was confirmed by enzyme-linked immunosorbent assay in a subset of patients. The prevalence of CKD was 58% in the UIC cohort and 54% in the Walk-PHaSST cohort, and haemoglobinuria was observed in 36% and 20% of the patients, respectively. Pathway analysis in both cohorts indicated an independent association of lactate dehydrogenase with haemoglobinuria and, in turn, independent associations of haemoglobinuria and age with CKD (P<0.0001). After a median of 32 months of follow-up in the UIC cohort, haemoglobinuria was associated with progression of CKD (halving of estimated glomerular filtration rate or requirement for dialysis; Hazard ratio [HR] 13.9, 95% confidence interval [CI] 1.7-113.2, P=0.0012) and increasing albuminuria (HR 3.1, 95% CI: 1.3-7.7; logrank P=0.0035). In conclusion haemoglobinuria is common in SCA and is associated with CKD, consistent with a role for intravascular haemolysis in the pathogenesis of renal dysfunction in SCA.
Keywords: Sickle Cell, Haemoglobinuria, Haemolysis, Kidney Disease, Albuminuria
Introduction
Sickle cell anaemia (SCA) is caused by a single nucleotide mutation in the HBB(β-globin) gene resulting in polymerization of deoxygenated haemoglobin in red blood cells. The polymerization triggers haemolysis and vaso-occlusion, which contribute to the protean manifestations of SCA. The kidneys are frequently involved with injury to glomeruli, tubules, and medullae.(Batlle, et al 1982, Guasch, et al 1996, Hatch, et al 1967) Pathological evaluation of kidney biopsies have demonstrated a range of findings, including glomerular hypertrophy, focal and segmental glomerulosclerosis, membranoproliferative glomerulonephritis, thrombotic microangiopathy and haemosiderin within proximal tubular cells.(da Silva, et al 2011, Elfenbein, et al 1974, Tejani, et al 1985)
In patients with SCA, the glomerular filtration rate (GFR) begins to decline as early as in the second decade of life.(Aygun, et al 2011) In the Cooperative Study of Sickle Cell Disease (CSSCD), creatinine clearance <100 ml/min was an independent predictor for early death.(Platt, et al 1994) A large cohort study with over 25 years of follow-up found that a serum creatinine concentration of ≥ 132 μmol/l was observed in 4.2-11.6% of SCA patients and the average time to haemodialysis, renal transplantation or death in these patients was 3.3 years.(Powars, et al 2005, Powars, et al 1991) Prevalences of abnormal levels of albuminuria range from 15-28% in adolescents to 40-68% in adults with SCA.(Abo-Zenah, et al 2009, Becton, et al 2010, Day, et al 2012, Dharnidharka, et al 1998, Guasch, et al 2006) SCA patients on haemodialysis have a poor prognosis with 40% mortality at 20 months of follow up.(Nissenson and Port 1989)
Single-institution studies have investigated correlations between increased markers of haemolysis and kidney disease in SCA patients with conflicting results. Several studies have not found a significant relationship (Asnani, et al 2011, Ataga, et al 2010, Guasch, et al 2006), but other studies (Gurkan, et al 2010, Maier-Redelsperger, et al 2010), including the largest ones with >250 SCA participants, each have found a strong relationship.(Bartolucci, et al 2012, Day, et al 2012)
Haemoglobinuria, which reflects intravascular haemolysis of a degree to exceed the binding capacity of haptoglobin, as estimated by urine dipstick analysis was reported in 15% of SCA patients from Saudi Arabia and 42% of SCA patients from Nigeria at steady-state.(Aleem 2008, Bolarinwa, et al 2012) Although acute haemoglobin-mediated damage to the kidneys has been observed in patients with paroxysmal nocturnal haemoglobinuria,(Forman, et al 1984) cardiac bypass surgery patients with acute haemolysis (Vermeulen Windsant, et al 2010) and pre-clinical animal models,(Baek, et al 2012, Minneci, et al 2005) the impact of chronic exposure of the kidneys to cell-free haemoglobin in SCA has not been previously explored.
In this study, the primary analyses were focused on laboratory and clinical factors associated with CKD in adult patients with SCA treated at the University of Illinois at Chicago (UIC), Comprehensive Sickle Cell Center. We repeated our analyses in the multi-centre US and UK Walk-Treatment of Pulmonary Hypertension and Sickle Cell Disease with Sildenafil Therapy (Walk-PHaSST) cohort. The objective of this investigation was to test the hypothesis that haemolysis and haemoglobinuria are associated with CKD in SCA.
Methods
Patients
We analysed 356 adults with the diagnosis of SCA (Hb SS or Sβ°-thalassaemia) receiving routine medical care at UIC between January 2003 and January 2012. The protocol was approved by the Institutional Review Board prior to undertaking the chart review. Laboratory and clinical data were extracted from the electronic medical record charting system, Cerner PowerChart. Laboratory data were collected from a steady-state clinic visit, defined as a visit without mention of the patient being in an acute vaso-occlusive pain episode and at least four weeks from a blood transfusion or an acute vaso-occlusive pain episode requiring medical attention in the emergency department, acute care centre or hospitalization. A total of 447 patients were screened and 356 had estimated GFR (eGFR) data at a steady-state clinic visit.
The validation cohort included 439 adults with SCA (Hb SS or Sβ°-thalassaemia) and eGFR data from 8 US centres and 1 UK centre, recruited between February 2008 and June 2009. UIC was a participating site for the Walk-PHaSST study and patients from this site were excluded from the validation cohort. The local institutional review boards or ethics committees had approved the protocol prior to subject enrollment.
Laboratory and clinical data were obtained at steady state, defined as in usual state of health and at least three weeks from an acute pain event, hospitalization or emergency room visit. Clinical variables included age, sex, type of SCA, medication history (hydroxycarbamide, anti-hypertensive medications and non steroidal anti-inflammatory drug therapy) and a history of SCA-related complications (vaso-occlusive pain episode frequency, leg ulcer, priapism, avascular necrosis, stroke and acute chest syndrome), blood pressure and oxygen saturation determined by pulse oximetry. Blood pressure measurements were obtained with the patient in a sitting position using automated blood pressure machines. Hypertension was defined as a systolic blood pressure > 130 mmHg, diastolic blood pressure > 85 mmHg, or the use of anti-hypertensive medications. A vaso-occlusive pain episode was defined as a pain episode severe enough to warrant an emergency room or acute care centre visit or hospitalization. Laboratory variables included haemoglobin fractionation, haemoglobin, white blood cell count, platelet count, reticulocyte count, serum creatinine, bicarbonate, lactate dehydrogenase (LDH), total and indirect bilirubin, aspartate transaminase (AST), urinalysis, urine albumin and urine creatinine. Laboratory analyses at the University of Illinois Clinical Pathology Laboratories were performed using Clinical Laboratory Improvement Amendments (CLIA) approved methods. Laboratory analyses from the Walk-PHaSST cohorts were performed in the local laboratories of the participating institutions.
Chronic kidney disease (CKD)
The eGFR was calculated using the Chronic Kidney Disease Epidemiology Collaboration (CKD-EPI) formula (GFR in ml/min/1.73 m2 = 175 × (Serum creatinine)-1.154 × (Age)-0.203 × (0.742 if female) × (1.212 if African American).(Levey, et al 2009) We created eGFR categories of ≥90, 60-89, and <60 ml/min/1.73 m2. Albuminuria was defined as microalbuminuria if the albumin to creatinine ratio was 30-300 mg/g creatinine and macroalbuminuria if the ratio was >300 mg/g creatinine. CKD was defined according to the National Kidney Foundation, Kidney Disease Outcomes Quality Initiatives (K/DOQI) guidelines (National Kidney Foundation 2002) to align the definition of CKD stage to the current evidence-based guidelines (Table I): stage 0-eGFR >60 ml/min/1.73 m2 and albuminuria <30 mg/g creatinine; stage 1- eGFR >90 ml/min/1.73 m2 and albuminuria ≥30 mg/g creatinine; stage 2- eGFR 60-89 ml/min/1.73 m2 and albuminuria ≥30 mg/g creatinine; stage 3 and greater- eGFR <60 ml/min/1.73 m2.
Table I. Definition of chronic kidney disease stage in this study (based on the National Kidney Foundation, Kidney Disease Outcomes Quality Initiatives Guidelines)(National Kidney Foundation 2002).
| Stage | Albuminuria | Glomerular Filtration Rate |
|---|---|---|
| Stage 1 | ≥ 30 mg/g creatinine | ≥ 90 ml/min/1.73 m2 |
| Stage 2 | ≥ 30 mg/g creatinine | 60 – 89 ml/min/1.73 m2 |
| Stage 3 or greater | < 60 ml/min/1.73 m2 |
Haemoglobinuria
In the UIC cohort, haemoglobinuria was defined by a reading of trace, small or moderate blood on automated urine dipstick analysis using the Aution 9EB Sticks on the IRIS 200Q machine and microscopy showing <2 red blood cells per high power field. In the Walk-PHaSST cohort, haemoglobinuria was defined by a reading of trace, small, or moderate blood and microscopy showing 0–5 red blood cells per high power field.
Forty-three UIC SCA patients were prospectively evaluated between March and May 2013 to compare urine dipstick measurements of haemoglobinuria with the urine haemoglobin directly measured by the enzyme-linked immunosorbent assay (ELISA) method (Human haemoglobin ELISA kit; Bethyl Laboratories, Montgomery, TX). They were selected based on consecutive appearances at routinely scheduled outpatient visits. Urine haemoglobin concentration (ng/ml) was prospectively and directly measured using an ELISA assay (Human haemoglobin ELISA kit; Bethyl Laboratories, Montgomery, TX) in 43 patients. Urine samples were diluted 1:1 with the assay's diluents buffer and then corrected for the dilution factor.
Longitudinal Follow-Up of UIC Patients
139 UIC subjects with urinalysis on initial steady-state evaluation had a repeat urinalysis performed at steady-state after a median of 39 months (interquartile rang [IQR] 11-58 months). 164 study subjects with initial steady-state urinalysis and eGFR determination were followed for a median of 32 months (IQR 18-52 months). Over this period, CKD progression (defined by a reduction of eGFR by 50% or requiring haemodialysis/kidney transplant) was determined. 93 patients were followed for progression of albuminuria category (defined as progression from normoalbuminuria to micro or macroalbuminuria, or microalbuminuria to macroalbuminuria).
Statistical Analysis
Linear variables were compared according to eGFR, albuminuria, haemoglobinuria and CKD stage with the Kruskall-Wallis test and categorical variables with Pearson's chi square and Cochran's linear trend test. Multivariate analysis was performed using logistic regression in both cohorts. Variables with a P ≤0.1 in univariate analysis were entered into the initial model and a stepwise approach was applied to select the final regression models. We also performed pathway analysis using structural equation modelling. The fitness of the final model to the observed data was determined by the comparative fit index (CFI), goodness-of-fit test χ2/degrees of freedom (df), and the root mean square error of approximation (RMSEA) with adjustment for site in the Walk-PhaSST cohort. A CFI >0.9, goodness-of-fit test χ 2/df <2, or RMSEA <0.05 were considered to be an excellent fit of the data to the model. The Fisher's exact test was used for comparing the initial urinalysis result to the most current steady-state urinalysis. The associations of haemoglobinuria status with CKD progression and worsening of albuminuria category were examined using the logrank method to compare Kaplan-Meier survival curves and Cox proportional hazards model to determine unadjusted hazard ratios. Systat 11 (Systat Software Corporation, Chicago, IL, USA) was used for most analyses and Lavaan (R-package, version 0.5-9, Ghent, Belgium) was used for pathway analysis.
Results
Prospective Validation of Urine Dipstick to Screen for Haemoglobinuria
Forty-three consecutive steady-state patients were evaluated with both urine dipstick and haemoglobin concentration by ELISA. Seventeen patients with a positive urine dipstick for haemoglobin had significantly higher urine haemoglobin concentrations when directly measured by the ELISA method on the same urine sample compared to 26 patients with a negative dipstick for haemoglobin (medians of 23.1 vs. 11.5 ng/ml, respectively; P<0.0001) (Figure 1).
Figure 1.

Validation of haemoglobinuria defined by dipstick urinalysis. Patients with haemoglobinuria on dipstick urinalysis (n=17) had significantly higher concentrations of urine haemoglobin directly measured by enzyme-linked immunosorbent assay than those without haemoglobinuria (n=26) (23.1 vs. 11.5ng/ml, P<0.0001).
Patient Characteristics
The UIC and Walk-PHaSST cohorts were similar with respect to age and gender distribution as well as proportions of patients on hydroxycarbamide or anti-hypertensive medications (Supplementary Table 1). Patients from the UIC cohort had higher mean arterial pressure (MAP), absolute reticulocyte counts, reticulocyte percentage and proportion of patients with haemoglobinuria and a lower serum creatinine concentration than patients from the Walk-PHaSST cohort. Steady-state clinical and laboratory data were comparable between the SCA patients with baseline eGFR and albuminuria measurements available and those with eGFR but without albuminuria measurements.
Variables Associated with Decreased eGFR
Eleven percent of patients had eGFR 60-89 ml/min/1.73 m2 and 6% had eGFR <60 ml/min/1.73 m2 in the UIC cohort and 9% of patients had eGFR 60–89 ml/min/1.73 m2 and 8% had eGFR<60 ml/min/1.73 m2 in the Walk-PHaSST cohort. On univariate analysis in both cohorts, greater age and MAP, lower haemoglobin concentration, the presence of macroalbuminuria, and the presence of haemoglobinuria were associated with progressively lower eGFR category (P≤0.004). By logistic regression analysis in the UIC cohort, increasing age (P≤0.0001), the presence of haemoglobinuria (P≤0.005), and increasing MAP (P≤0.15) were independently associated with progressively lower eGFR categories. In the Walk-PHaSST cohort, increasing age (P<0.0001), the presence of haemoglobinuria (P≤0.007), and increasing MAP (P≤0.16) were independently associated with progressively lower eGFR categories. In both the UIC and Walk-PHaSST cohort, MAP only achieved significance for the lowest eGFR category (P≤0.047).
Variables Associated with Albuminuria
Albuminuria measurements were available in 196 of 356 patients from UIC and 262 of 439 patients from the Walk-PHaSST cohorts. The prevalence of microalbuminuria in the UIC and Walk-PHaSST cohorts was 36% and 31%, respectively. Macroalbuminuria was present in 18% and 20% of patients, respectively. On univariate analysis in the UIC cohort, higher LDH, lower haemoglobin concentration and the presence of haemoglobinuria were associated with a progressive increase in albuminuria category (P≤0.004). In the Walk-PHaSST cohort, higher LDH, AST, and MAP, lower haemoglobin concentration and the presence of haemoglobinuria were associated with higher levels of albuminuria (P≤0.004). By logistic regression analysis in the UIC cohort, the presence of haemoglobinuria (P<0.0001) and increasing age (P≤0.008) were independently associated with progressively higher albuminuria categories. In the Walk-PHaSST cohort, the presence of haemoglobinuria (P≤0.027) was independently associated with progressively higher albuminuria categories.
Variables Associated with Chronic Kidney Disease
Stage of CKD was evaluable in 208 of 356 patients from UIC and 275 of 439 patients from the Walk-PHaSST cohorts, based on the availability of albuminuria measurements or an eGFR < 60 ml/min/1.73 m2. Chronic kidney disease was present in 58% of patients from the UIC cohort: 39% had stage 1 kidney disease, 8% had stage 2, and 11% had stage 3 or higher. Similarly, 54% of patients from the Walk-PHaSST cohort had CKD, 35% with stage 1, 6% with stage 2 and 13% with stage 3 or higher. On univariate analysis in the UIC cohort, greater age and LDH, lower haemoglobin concentration and the presence of haemoglobinuria were associated with CKD (P≤0.004) (Table IIA). In the Walk-PHaSST cohort, greater age, MAP, LDH and AST, lower haemoglobin concentration and the presence of haemoglobinuria were associated with CKD (P≤0.004) (Table IIB). The variables remained significantly different according to CKD stage in each cohort after stratification by hydroxycarbamide status (data not shown). Hydroxycarbamide therapy was not associated with CKD stage in either the UIC or Walk-PHaSST cohort. By multivariate logistic regression, in the UIC and Walk-PHaSST cohorts the presence of haemoglobinuria, increasing age and increasing MAP were independently associated with CKD (Table III). Haemoglobinuria remained significantly associated with CKD stage on multivariate analysis when stratifying by hydroxycarbamide status (data not shown).
Table II.
Table IIA: UIC clinical and laboratory variables according to the presence or absence of chronic kidney disease and its stage.
| UIC | |||||||||
|---|---|---|---|---|---|---|---|---|---|
| Variable | N | CKD not present | N | Stage 1 | N | Stage 2 | N | Stage 3 or higher | p-value |
| Age (years) | 88 | 28(23–38) | 81 | 30(25–41) | 17 | 45 (35 – 50) | 22 | 50(37 – 58) | < 0.0001 |
|
Gender (male : female) |
88 | 67% : 33% | 81 | 43% : 57% | 17 | 41% : 59% | 22 | 32% : 68% | 0.7 |
| MAP (mmHg) | 87 | 86(80 – 92) | 81 | 87 (82 – 93) | 17 | 89 (83 – 94) | 22 | 91(86–99) | 0.1 |
| HC therapy | 87 | 43 (49%) | 81 | 36 (44%) | 17 | 10 (59%) | 21 | 12 (57%) | 0.5 |
| Ferritin (μg/l) | 68 | 347(128–1000) | 56 | 397(176–890) | 11 | 490(226–1134) | 14 | 233 (104–634) | 0.8 |
| Haemoglobin (g/l) | 88 | 90(82–100) | 81 | 83 (78 – 92) | 17 | 77 (65 – 88) | 22 | 76 (69 – 83) | < 0.0001 |
| LDH (u/l) | 79 | 287 (223 – 394) | 69 | 364 (258 – 448) | 17 | 442(338–517) | 19 | 367(315–536) | 0.00031 |
| Indirect bilirubin (μmol/l) | 86 | 30.8 (22.2 – 46.2) | 79 | 46.2(27.4–59.9) | 17 | 29.1(23.9–59.9) | 19 | 37.6(20.5–46.2) | 0.1 |
| AST (u/L) | 69 | 37 (29 – 50) | 72 | 40(31–53) | 17 | 52 (40 – 69) | 16 | 43(34–51) | 0.034 |
| Absolute reticulocyte count (×109/l) | 88 | 354 (232 – 434) | 79 | 345(271–463) | 17 | 353 (260 – 429) | 21 | 243(150–338) | 0.018 |
| Reticulocyte percent (%) | 85 | 12.3(6.9–16.3) | 78 | 14.0(9.7–20.9) | 15 | 11.2(9.2–15.6) | 21 | 12.2(8.1–16.6) | 0.038 |
| Haemoglobin F (%) | 84 | 5.4(2.6–9.6) | 80 | 7.1(3.3–11.3) | 16 | 3.4(2.2–9.1) | 19 | 5.7(2.3–11.3) | 0.4 |
| Haemoglobinuria | 83 | 8 (10%) | 74 | 40 (54%) | 16 | 13 (81%) | 9 | 6 (67%) | < 0.0001 |
| Continuous variables are presented as median values (interquartile range). | |||||||||
| P values < 0.004 are significant after the Bonferonni Correction | |||||||||
| UIC = University of Illinois at Chicago; CKD = chronic kidney disease; MAP = mean arterial pressure; HC = hydroxycarbamide; LDH = lactate dehydrogenase; AST = aspartate transaminase | |||||||||
| Table IIB: Walk-PHaSST clinical and laboratory variables according to presence or absence of chronic kidney disease and its stage. | |||||||||
|---|---|---|---|---|---|---|---|---|---|
| Walk-PHaSST | |||||||||
| Variable | N | CKD not present | N | Stage 1 | N | Stage 2 | N | Stage 3 or higher | p-value |
| Age (years) | 126 | 34 (25 – 45) | 96 | 33 (24 – 43) | 17 | 50 (33 – 55) | 36 | 50 (45 – 55) | < 0.0001 |
|
Gender (male : female) |
126 | 48%: 52% | 96 | 47%: 53% | 17 | 47%: 53% | 36 | 50%: 50% | 0.9 |
| MAP (mmHg) | 126 | 82 (78 – 88) | 96 | 83 (77 – 89) | 17 | 88 (83 – 92) | 36 | 91(85 – 102) | < 0.0001 |
| HC therapy | 126 | 56 (44%) | 96 | 43 (45%) | 17 | 8 (47%) | 36 | 14 (39%) | 0.7 |
| Ferritin (μg/l) | 121 | 265(102–607) | 96 | 321 (142–1185) | 17 | 594 (149 – 1023) | 34 | 487(287–1801) | 0.010 |
| Haemoglobin (g/l) | 125 | 92(81–101) | 95 | 85 (75 – 94) | 16 | 82 (69 – 85) | 36 | 79 (62 – 89) | < 0.0001 |
| LDH (u/l) | 117 | 372(305–518) | 89 | 476 (368 – 727) | 16 | 601(437–928) | 34 | 469(316–707) | 0.00016 |
| Indirect bilirubin (μmol/l) | - | Not available | - | Not Available | - | Not Available | - | Not Available | - |
| AST (u/l) | 120 | 39 (29 – 53) | 95 | 50 (37 – 69) | 17 | 49 (42 – 65) | 36 | 47 (33 – 60) | 0.00027 |
| Absolute reticulocyte count (×109/l) | 111 | 246(168–331) | 92 | 269(181–362) | 16 | 266(195–389) | 36 | 216(118–297) | 0.058 |
| Reticulocyte percent (%) | 111 | 8.3(5.9–11.2) | 93 | 10.2(6.9–15.2) | 16 | 10.9(6.4–17.2) | 36 | 8.9(5.2–14.3) | 0.1 |
| Haemoglobin F (%) | 119 | 6.6(2.9–14.7) | 95 | 5.8(2.9–11.8) | 16 | 6.1(2.5–11.9) | 34 | 3.8(1.4–10.6) | 0.3 |
| Haemoglobinuria | 105 | 9 (9%) | 72 | 21 (29%) | 12 | 2 (17%) | 22 | 12 (55%) | < 0.0001 |
Continuous variables are presented as median values (interquartile range).
P values < 0.004 are significant after the Bonferonni Correction
Walk-PHaSST = Walk-Treatment of Pulmonary Hypertension and Sickle Cell Disease with Sildenafil Therapy; CKD = chronic kidney disease; MAP = mean arterial pressure; HC = hydroxycarbamide; LDH = lactate dehydrogenase; AST = aspartate transaminase
Table III.
Logistic regression model for chronic kidney disease stage in the UIC and Walk-PHaSST cohorts.
| UIC | |||||
|---|---|---|---|---|---|
| N | Variables | OR* | 95% CI | p-value | |
| CKD Stage 1 | 74 | Haemoglobinuria Age MAP |
12.8 1.5 1.0 |
5.3 – 31.1 1.1 – 2.0 0.6 – 1.4 |
< 0.0001 0.029 0.8 |
| CKD Stage 2 | 16 | Haemoglobinuria Age MAP |
112.0 4.1 1.4 |
19.8 – 634.2 2.1 – 7.8 0.7 – 2.9 |
< 0.0001 < 0.0001 0.3 |
| CKD Stage 3 or higher | 9 | Haemoglobinuria Age MAP |
110.4 11.7 2.1 |
13.7 – 891.1 3.6 – 37.9 0.9 – 5.0 |
< 0.0001 < 0.0001 0.092 |
| Walk-PHaSST | |||||
| N | Variables | OR* | 95% CI | p-value | |
| CKD Stage 1 | 72 | Haemoglobinuria Age MAP |
4.5 0.9 0.9 |
1.9 – 10.7 0.7 – 1.2 0.6 – 1.4 |
0.00062 0.4 0.8 |
| CKD Stage 2 | 12 | Haemoglobinuria Age MAP |
2.2 3.6 1.0 |
0.4 – 12.4 1.7 – 7.3 0.5 – 2.2 |
0.4 0.00048 0.9 |
| CKD Stage 3 or higher | 22 | Haemoglobinuria Age MAP |
11.3 3.3 2.8 |
3.2 – 40.4 1.8 – 6.1 1.4 – 5.5 |
0.00019 0.00020 0.0032 |
Odds ratios are based on the comparison to subjects without CKD.
UIC = University of Illinois at Chicago; Walk-PHaSST = Walk-Treatment of Pulmonary Hypertension and Sickle Cell Disease with Sildenafil Therapy; CKD = chronic kidney disease; MAP = mean arterial pressure; OR = Odds Ratio; 95% CI = 95% confidence interval. Odds ratio for Age and MAP are based on 10-year and 10-mmHg intervals, respectively.
Variables Associated with Haemoglobinuria
Haemoglobinuria was observed in 36% of patients from the UIC cohort and 20% of patients from the Walk-PHaSST cohort. On univariate analysis in both the UIC and Walk-PHaSST cohorts the presence of haemoglobinuria was associated with albuminuria, higher LDH and AST, and lower haemoglobin concentration and eGFR (Figures 2A-F). Haemoglobinuria status did not differ by hydroxycarbamide use in either cohort and the variables remained significantly associated with haemoglobinuria in each cohort after stratification by hydroxycarbamide status (data not shown). By multivariate logistic regression in both the UIC and Walk-PHaSST cohorts, the natural log of LDH had the most significant independent association with haemoglobinuria (Odds ratio [OR] 18.9, 95% CI 6.4–55.6, P<0.0001 and OR 2.6, 95% CI 1.6–4.3, P=0.0002 respectively). In both cohorts, LDH could be replaced by the other markers of haemolysis including AST and haemoglobin concentration, and association of LDH and haemoglobin concentration on multivariate analysis persisted after stratification by hydroxycarbamide status (data not shown).
Figure 2.


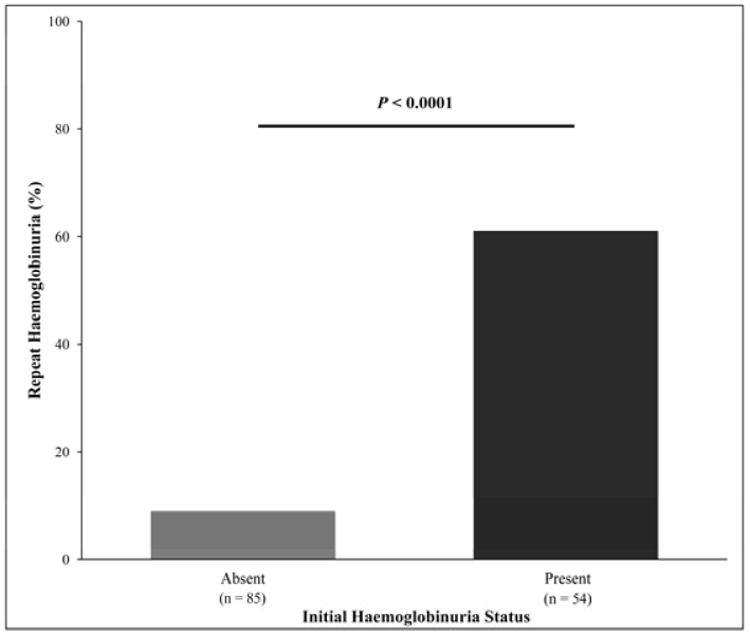
Figure 2A-D: Haemoglobinuria association with laboratory markers of haemolysis. In the UIC cohort lower haemoglobin concentration (80 vs. 90 g/l, P<0.0001), higher lactate dehydrogenase (LDH, 426 vs. 279 u/l, P<0.0001), higher aspartate transaminase (AST, 49 vs. 37 u/l, P<0.0001), and higher reticulocyte percentages (16.1% vs. 11.7%, P<0.0001) were observed in patients with haemoglobinuria. Similarly, in the Walk-PHaSST cohort, lower haemoglobin concentration (81 vs. 89 g/l, P<0.0001), higher LDH (540 vs. 428 u/l, P<0.0001), higher AST (49 vs. 42 u/l, P=0.0052), and a trend for higher reticulocyte percentage (9.6% vs. 8.5%, P=0.07) were observed in patients with haemoglobinuria. UIC = University of Illinois at Chicago; Walk-PHaSST = Walk-Treatment of Pulmonary Hypertension and Sickle Cell Disease with Sildenafil Therapy.
Figure 2E: Haemoglobinuria association with increased albuminuria. In both the UIC and Walk-PHaSST cohorts, the presence of haemoglobinuria was associated with higher levels of albuminuria (UIC: 248 vs. 20 mg/g creatinine, P<0.0001; Walk-PHaSST: 109 vs. 18 mg/g creatinine, P<0.0001). UIC = University of Illinois at Chicago; Walk-PHaSST = Walk-Treatment of Pulmonary Hypertension and Sickle Cell Disease with Sildenafil Therapy.
Figure 2F: Haemoglobinuria association with decreased GFR. In both the UIC and Walk-PHaSST cohorts, with adjustment for age the presence of haemoglobinuria was associated with decreased eGFR (UIC: 120 vs. 131 ml/min/1.73 m2, P=0.0014; Walk-PHaSST: 124 vs. 131 ml/min/1.73 m2, P=0.035). UIC = University of Illinois at Chicago; Walk-PHaSST = Walk-Treatment of Pulmonary Hypertension and Sickle Cell Disease with Sildenafil Therapy.
Pathway Analysis of Chronic Kidney Disease
In pathway analysis, the UIC and Walk-PHaSST data were consistent with a model in which, consecutively, 1) higher LDH is associated with haemoglobinuria and 2) greater age and the presence of haemoglobinuria are associated the stage of CKD (Figure 3) (CFI=1.0, goodness-of-fit test χ2/df≤0.8, RMSEA<0.0001 for UIC and Walk-PHaSST). In contrast, the alternative pathway of 1) higher LDH and age associated with stage of CKD and 2) stage of CKD associated with haemoglobinuria had a poor fit of the data (CFI≤0.89, goodness-of-fit test χ2/df≥3.7, RMSEA≥0.11).
Figure 3.

UIC and Walk-PHaSST pathway analysis for CKD stage. Standardized betas are indicated in the model. Comparative fit index=1.0; goodness-of-fit test χ2/degress of freedom≤0.8; Root Mean Square Error of Approximation of model<0.0001. According to this analysis 1) higher LDH is associated with haemoglobinuria, 2) higher age and presence of haemoglobinuria are associated with the stage of CKD. UIC = University of Illinois at Chicago; Walk-PHaSST = Walk-Treatment of Pulmonary Hypertension and Sickle Cell Disease with Sildenafil Therapy; CKD = chronic kidney disease; LDH = lactate dehydrogenase.
Clinical Correlates of Chronic Kidney Disease
Pulse pressure (medians of 46 vs. 50, 52 and 58 mmHg UIC and 50 vs. 50, 55 and 57 mmHg Walk-PHaSST; P≤0.0056) was higher in patients with increasing stage of CKD. There were no significant differences in oxygen saturation or histories of acute chest syndrome, avascular necrosis, stroke or pain crisis frequency based on CKD in either the UIC nor Walk-PHaSST cohorts and histories of priapism and leg ulcers did not differ significantly after Bonferroni correction.
Subset of UIC Patients Evaluated Longitudinally for Progression of Chronic Kidney Disease
One hundred and sixty-four SCA patients from UIC who had urine dipstick measurements were longitudinally followed to evaluate for progression of kidney disease. The baseline characteristics of the patients in the longitudinal cohort were similar to those who were not evaluable for progression. In the patients followed longitudinally, age and MAP were similar between patients with versus without haemoglobinuria at the initial steady-state visit. Of the 139 SCA patients with repeat steady-state urinalyses, 61% (33/54) of patients who were initially haemoglobinuria-positive remained positive on the most current urinalysis while 90% (8/85) of patients who were initially haemoglobinuria-negative remained negative (P<0.0001) (Figure 4A).
Figure 4.


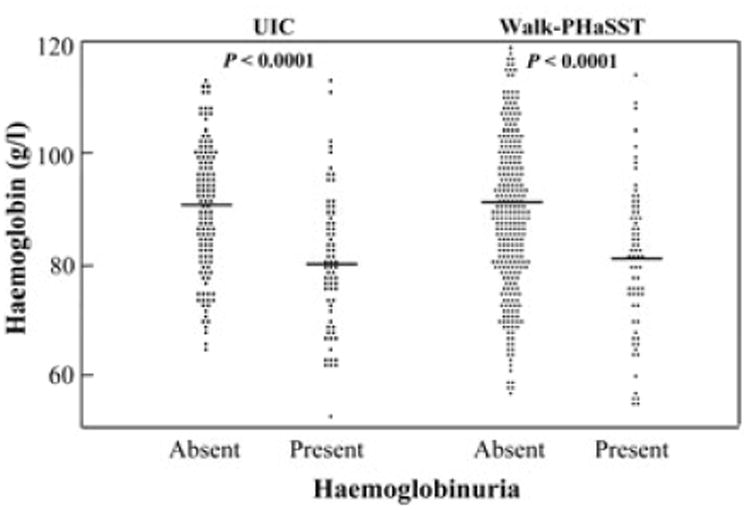
Figure 4A: Reliability of haemoglobinuria based on repeat dipstick urinalysis. Sixty-one percent (33/54) of patients with haemoglobinuria on initial assessment remained positive for haemoglobinuria on repeat urinalysis while 90% (8/85) of patients without haemoglobinuria on initial assessment remained negative on repeat uirnalysis.
Figure 4B: CKD progression based on the absence or presence of haemoglobinuria on initial urine dipstick analysis. CKD progression, defined by a reduction of eGFR by 50% or requiring haemodialysis/kidney transplant, was observed in 13% (7/56) of patients with haemoglobinuria versus 1% (1/108) of patients without haemoglobinuria (HR 13.9, 95% CI: 1.7–113.2; logrank P=0.0012). CKD = chronic kidney disease.
Figure 4C: Albuminuria category progression rate based on the absence or presence of haemoglobinuria on initial urine dipstick analysis. Forty-two percent (11/26) of patients with haemoglobinuria had progression of albuminuria category versus 13% (9/67) of patients without haemoglobinuria (HR 3.1, 95% CI: 1.3-7.7; logrank P=0.0035
The proportion of patients with CKD progression (defined by a reduction of eGFR by 50% or requiring haemodialysis/kidney transplant) at a median follow up of 32 months (IQR 18– 52 months) was higher in patients with haemoglobinuria (13%, 7/56) versus without haemoglobinuria (1%, 1/108) (HR 13.9, 95% CI: 1.7–113.2; logrank P=0.0012) (Figure 4B). Progression of albuminuria category was observed in 42% (11/26) of patients with haemoglobinuria versus 13% (9/67) of patients without haemoglobinuria (HR 3.1, 95% CI: 1.3– 7.7; logrank P=0.0035) (Figure 4C). Differences in rates of CKD or albuminuria progression were not observed based on baseline hydroxycarbamide status.
Discussion
Chronic kidney disease is a common complication of SCA that is associated with other morbidities and early mortality.(Platt, et al 1994, Powars, et al 2005, Powars, et al 1991) We observed CKD in 58% of SCA patients from the UIC cohort and in 54% of SCA patients from the Walk-PHaSST cohort. The stage of CKD was independently associated with the presence of haemoglobinuria and increasing age in both the UIC and Walk-PHaSST cohorts. Haemoglobinuria, observed in 36% of adult patients from the UIC cohort and 20% of the adult Walk-PHaSST cohort, was associated with markers of haemolysis including increased LDH and AST and decreased serum haemoglobin concentration. These results and our pathway analysis are consistent with a scenario in which increasing age in combination with yet to be determined genetic and environmental factors lead to CKD in SCA. In parallel, chronic haemolysis in association with haemoglobinuria put patients at risk for CKD.
Our findings indicate that haemoglobinuria determined by dipstick urinalysis is a valid assessment of increased urine haemoglobin concentration and is fairly consistent on repeat testing at steady-state visits. In particular, we confirmed that significantly higher levels of directly measured urine haemoglobin concentrations were present in a subset of prospective patients with dipstick-defined haemoglobinuria.
Both decreased eGFR and increasing degree of albuminuria are indicators of kidney disease and correlate with each other.(Abo-Zenah, et al 2009, Alvarez, et al 2008, Ataga, et al 2010, Guasch, et al 2006) In the UIC and Walk-PHaSST cohorts, we observed similar prevalence rates of microalbuminuria, macroalbuminuria and eGFR <90 ml/min/1.73 m2 compared to prior investigations.(Abo-Zenah, et al 2009, Day, et al 2012, Guasch, et al 2006, Powars, et al 2005, Powars, et al 1991) In addition to an association with age, we found increased MAP to be associated with CKD. The MAP in patients with SCA was in the normal range and this finding is in keeping with the concept of relative hypertension in SCA.(Gordeuk, et al 2008, Pegelow, et al 1997) Other investigators have had similar findings. Guasch et al (2006) reported that patients with SCA and a creatinine clearance <90 ml/min/1.73 m2 were significantly older and had significantly higher albuminuria levels, with a median value in the macroalbuminuria range. Reduction in GFR with increasing age in SCA has also been observed in studies that directly measured GFR using radiolabelled tracers.(Aygun, et al 2011, Barros, et al 2006) Several studies have also consistently shown correlations between elevated blood pressure and albuminuria or reduced eGFR in patients with SCA(Abo-Zenah, et al 2009, Gordeuk, et al 2008, Guasch, et al 1996, Guasch, et al 2006) or sickle cell disease.(Becton, et al 2010, Powars, et al 1991) Hypertension is thought to directly damage the kidneys through direct transmission of increased systemic pressure resulting in focal and segmental glomerulosclerosis,(Raij, et al 1984) which is a common pathologicalfinding in patients with SCA.(Bhathena and Sondheimer 1991, Tejani, et al 1985)
New in our study is the finding that haemoglobinuria determined by urinalysis, reflecting intravascular haemolysis, is independently associated with CKD and its progression. Haemoglobinuria had highly significant associations with indirect markers of haemolysis and was a stronger predictor of CKD than the indirect haemolytic markers suggesting that cell-free haemoglobin may provide a mechanism for kidney damage in SCA. Furthermore, in the longitudinal cohort of patients, the presence of haemoglobinuria was significantly associated with a greater risk for CKD progression and progression of albuminuria category. These findings are consistent with reports of other investigators of a relationship between indirect markers of haemolysis and CKD in SCA.(Bartolucci, et al 2012, Day, et al 2012, Gurkan, et al 2010, Maier-Redelsperger, et al 2010) They are also consistent with reports that increased kidney iron deposition on magnetic resonance imaging correlates with degree of haemolysis but not transfusional iron load.(Schein, et al 2008)
The potential for cell-free haemoglobin to contribute to kidney disease in SCA is plausible based on prior laboratory investigations. In patients with SCA, plasma cell-free haemoglobin levels range from 0-20 μM haem at steady-state and increase during vaso-occlusive episodes to levels greater than 20-40 μM haem.(Naumann, et al 1971, Reiter, et al 2002) Circulating plasma cell-free haemoglobin rapidly dissociates into dimers that readily pass through the glomerulus; thus chronic haemolysis in SCA may result in continuous exposure of the kidneys to cell-free haemoglobin.(Szabo, et al 1965) Haemoglobin can exist in the kidney in the ferrous (Fe+2), ferric (Fe+3) and ferryl states (Fe+4).(Gladwin, et al 2012) In the ferrous state, iron will scavenge nitric oxide (NO) and participate in the Fenton reaction to generate hydroxyl radicals; both reduced NO and increased hydroxyl radicals can cause vasoconstriction, potentially impairing kidney perfusion.(Reiter, et al 2002) In the ferric state, iron can form the oxo-ferryl radical and mediate lipid peroxidation, thought to be an important mechanism of injury in myoglobinuria.(Boutaud, et al 2010) Cell-free haemoglobin is rapidly converted to methaemoglobin with liberation of the haem group, which may also elicit cytotoxic and inflammatory-mediated kidney damage.(Nath and Katusic 2012, Tracz, et al 2007) In chronic haemolytic disease states including SCA, the scavengers of free haemoglobin (haptoglobin) and free haem (haemopexin) are consumed resulting in increased circulation of cell-free haemoglobin and haem.(Muller-Eberhard, et al 1968)
Several animal models provide additional insights into potential pathophysiological mechanisms linking cell-free haemoglobin to kidney damage in SCA. In a transgenic mouse model of SCA, increased haem, lipid peroxidation, and upregulation of haem oxygenase-1 were detected in whole kidney homogenates as well as cytosolic, mitochondrial, and microsomal fractions.(Nath, et al 2001) In a non-sickle canine model, free water-induced intravascular haemolysis triggered release of cell-free plasma haemoglobin, predominantly in the ferrous state which resulted in increased NO consumption, elevated MAP, and decreased creatinine clearance.(Minneci, et al 2005) These effects on MAP and creatinine clearance could be attenuated by concomitant inhalation of NO, suggesting that the ferrous form of cell-free haemoglobin and NO consumption play an important role in haemolysis-mediated kidney disease. In a guinea pig model, transfusion of longer-stored red blood cell (RBC) units was associated with sustained intravascular haemolysis and increased cell-free haemoglobin concentrations.(Baek, et al 2012) In this model, the cell-free haemoglobin initially predominated in the ferrous form with an increase in the ferric form over time. Transfusion with longer-stored RBC units was associated with elevated blood pressures, vascular wall injury and kidney dysfunction. Proteomic analysis of the kidneys displayed increased markers of oxidative stress and tubular injury and histopathology revealed nephrosis and tubular degeneration. Co-infusion of haptoglobin with longer-stored RBC abated the increases in oxidative and tubular injury markers. These animal models suggest that intravascular haemolysis-mediated cell-free haemoglobin causes kidney injury by NO scavenging in the ferrous form in addition to oxidative injury in the ferric or free-haem form.
There are a number of limitations to this study. The large cohort analyses were cross sectional in nature, although a prospective cohort confirmed the validity of urine dipstick and microscopy to identify haemoglobinuria and a longitudinal cohort confirmed an association between haemoglobinuria and CKD. Although associations have been demonstrated between CKD and haemoglobinuria, determining a causal relationship will require future studies. Another limitation is that stage of CKD was determined by eGFR and not by directly measured GFR, although prior studies have shown that the CKD-EPI formula correlates relatively well with measured GFR in SCA patients.(Arlet, et al 2012, Asnani, et al 2013) Haemoglobinuria may be a consequence of CKD, although when testing this direction on our pathway analysis we observed a poor fit of the data to this model. Another limitation is that the urine dipstick and microscopy analysis to assess for haemoglobinuria may be positive in the presence of myoglobinuria. This is less likely, given that plasma levels of myoglobin are not increased at steady-state in patients with SCD in comparison to healthy controls (Roth, et al 1981) Patients negative for urine dipstick-defined haemoglobinuria had significantly lower, albeit detectable, levels of haemoglobinuria and future studies to directly measure cell-free haemoglobin in urine may help to establish a threshold upon which renal damage is accelerated. Coinheritance of α-thalassaemia, which is associated with lower rates of haemolysis, has been shown to be associated with decreased rates of development and progression of increased albuminuria and will also need to be assessed in future studies.(Day, et al 2012, Guasch, et al 1999, Nebor, et al 2010) The data on hydroxycarbamide use affecting nephropathy has been less clear.(Day, et al 2012, Steinberg, et al 2010) In this study, CKD stage and rates of CKD or albuminuria progression did not differ by hydroxycarbamide use. Finally, the differences in progression of renal dysfunction observed in this study according to haemoglobinuria need to be assessed in future studies including potential genetic differences that may modulate response to intravascular haemolysis through scavenger proteins or detoxifying enzymes.
In summary, in two independent large cohorts of adults with SCA, increasing age and intravascular haemolysis, as reflected in haemoglobin-positive urine dipstick with negative microscopy, were independent factors associated with CKD. The potential contribution of cell-free haemoglobin to kidney disease in SCA warrants further investigation including prospective studies with specific assays for plasma free and urine haemoglobin. Further research is also needed to determine if measures to decrease intravascular haemolysis and cell-free haemoglobin exposure can preserve renal function in patients with SCA. Investigations to identify genomic and genetic markers that predispose patients for CKD might also assist in preventive and therapeutic interventions.
Supplementary Material
Acknowledgments
The authors are grateful for the nursing care provided by Darcell Dowell, Tara Gordan, and Glenda Pendarvis in the UIC Comprehensive Sickle Cell Center.
The project described was supported by the National Center for Advancing Translational Sciences, National Institutes of Health, through Grant KL2TR000048. The content is solely the responsibility of the authors and does not necessarily represent the official views of the NIH. The Walk-PHaSST project was supported by federal funds from the National Heart, Lung, and Blood Institute, National Institutes of Health, Department of Health and Human Services, under contract HHSN268200617182C. J.P.L receives research support from NIH grant K24DK092290. R.F.M. receives research support from NIH grants R01HL111656 and K23HL098454. M.T.G. receives research support from NIH grants R01HL098032, RO1HL096973, and P01HL103455, the Institute for Transfusion Medicine and the Hemophilia Center of Western Pennsylvania.
Footnotes
Authorship: S.L.S. collected and analysed the data, performed statistical analysis and wrote the paper. X.Z. analysed the data, performed statistical analysis and wrote the paper. T.K. contributed vital analytical tools, interpreted the data and wrote the paper. B.O., C.L., J.R. collected and analysed the data. J.P.L., R.F.M., M.G., J.H., J.D., R.F.M., M.T.G., J.A.L. wrote the paper. V.G.R. analysed the data, performed statistical analysis and wrote the paper.
Conflict-of-interest disclosure: The authors declare no competing financial interests.
References
- Abo-Zenah H, Moharram M, El Nahas AM. Cardiorenal risk prevalence in sickle cell hemoglobinopathy. Nephron Clin Pract. 2009;112:c98–c106. doi: 10.1159/000213897. [DOI] [PubMed] [Google Scholar]
- Aleem A. Renal abnormalities in patients with sickle cell disease: a single center report from Saudi Arabia. Saudi J Kidney Dis Transpl. 2008;19:194–199. [PubMed] [Google Scholar]
- Alvarez O, Lopez-Mitnik G, Zilleruelo G. Short-term follow-up of patients with sickle cell disease and albuminuria. Pediatr Blood Cancer. 2008;50:1236–1239. doi: 10.1002/pbc.21520. [DOI] [PubMed] [Google Scholar]
- Arlet JB, Ribeil JA, Chatellier G, Eladari D, De Seigneux S, Souberbielle JC, Friedlander G, de Montalembert M, Pouchot J, Prie D, Courbebaisse M. Determination of the best method to estimate glomerular filtration rate from serum creatinine in adult patients with sickle cell disease: a prospective observational cohort study. BMC Nephrol. 2012;13:83. doi: 10.1186/1471-2369-13-83. [DOI] [PMC free article] [PubMed] [Google Scholar]
- Asnani MR, Fraser RA, Reid ME. Higher rates of hemolysis are not associated with albuminuria in Jamaicans with sickle cell disease. PLoS One. 2011;6:e18863. doi: 10.1371/journal.pone.0018863. [DOI] [PMC free article] [PubMed] [Google Scholar]
- Asnani MR, Lynch O, Reid ME. Determining glomerular filtration rate in homozygous sickle cell disease: utility of serum creatinine based estimating equations. PLoS One. 2013;8:e69922. doi: 10.1371/journal.pone.0069922. [DOI] [PMC free article] [PubMed] [Google Scholar]
- Ataga KI, Brittain JE, Moore D, Jones SK, Hulkower B, Strayhorn D, Adam S, Redding-Lallinger R, Nachman P, Orringer EP. Urinary albumin excretion is associated with pulmonary hypertension in sickle cell disease: potential role of soluble fms-like tyrosine kinase-1. Eur J Haematol. 2010;85:257–263. doi: 10.1111/j.1600-0609.2010.01471.x. [DOI] [PMC free article] [PubMed] [Google Scholar]
- Aygun B, Mortier NA, Smeltzer MP, Hankins JS, Ware RE. Glomerular hyperfiltration and albuminuria in children with sickle cell anemia. Pediatr Nephrol. 2011;26:1285–1290. doi: 10.1007/s00467-011-1857-2. [DOI] [PMC free article] [PubMed] [Google Scholar]
- Baek JH, D'Agnillo F, Vallelian F, Pereira CP, Williams MC, Jia Y, Schaer DJ, Buehler PW. Hemoglobin-driven pathophysiology is an in vivo consequence of the red blood cell storage lesion that can be attenuated in guinea pigs by haptoglobin therapy. J Clin Invest. 2012;122:1444–1458. doi: 10.1172/JCI59770. [DOI] [PMC free article] [PubMed] [Google Scholar]
- Barros FB, Lima CS, Santos AO, Mazo-Ruiz MF, Lima MC, Etchebehere EC, Costa FF, Saad ST, Camargo EE, Ramos CD. 51Cr-EDTA measurements of the glomerular filtration rate in patients with sickle cell anaemia and minor renal damage. Nucl Med Commun. 2006;27:959–962. doi: 10.1097/01.mnm.0000243373.03636.6e. [DOI] [PubMed] [Google Scholar]
- Bartolucci P, Brugnara C, Teixeira-Pinto A, Pissard S, Moradkhani K, Jouault H, Galacteros F. Erythrocyte density in sickle cell syndromes is associated with specific clinical manifestations and hemolysis. Blood. 2012;120:3136–3141. doi: 10.1182/blood-2012-04-424184. [DOI] [PubMed] [Google Scholar]
- Batlle D, Itsarayoungyuen K, Arruda JA, Kurtzman NA. Hyperkalemic hyperchloremic metabolic acidosis in sickle cell hemoglobinopathies. Am J Med. 1982;72:188–192. doi: 10.1016/0002-9343(82)90809-9. [DOI] [PubMed] [Google Scholar]
- Becton LJ, Kalpatthi RV, Rackoff E, Disco D, Orak JK, Jackson SM, Shatat IF. Prevalence and clinical correlates of microalbuminuria in children with sickle cell disease. Pediatr Nephrol. 2010;25:1505–1511. doi: 10.1007/s00467-010-1536-8. [DOI] [PubMed] [Google Scholar]
- Bhathena DB, Sondheimer JH. The glomerulopathy of homozygous sickle hemoglobin (SS) disease: morphology and pathogenesis. J Am Soc Nephrol. 1991;1:1241–1252. doi: 10.1681/ASN.V1111241. [DOI] [PubMed] [Google Scholar]
- Bolarinwa RA, Akinlade KS, Kuti MA, Olawale OO, Akinola NO. Renal disease in adult Nigerians with sickle cell anemia: a report of prevalence, clinical features and risk factors. Saudi J Kidney Dis Transpl. 2012;23:171–175. [PubMed] [Google Scholar]
- Boutaud O, Moore KP, Reeder BJ, Harry D, Howie AJ, Wang S, Carney CK, Masterson TS, Amin T, Wright DW, Wilson MT, Oates JA, Roberts LJ., 2nd Acetaminophen inhibits hemoprotein-catalyzed lipid peroxidation and attenuates rhabdomyolysis-induced renal failure. Proc Natl Acad Sci U S A. 2010;107:2699–2704. doi: 10.1073/pnas.0910174107. [DOI] [PMC free article] [PubMed] [Google Scholar]
- da Silva GB, Jr, Liborio AB, Daher Ede F. New insights on pathophysiology, clinical manifestations, diagnosis, and treatment of sickle cell nephropathy. Ann Hematol. 2011;90:1371–1379. doi: 10.1007/s00277-011-1327-8. [DOI] [PubMed] [Google Scholar]
- Day TG, Drasar ER, Fulford T, Sharpe CC, Thein SL. Association between hemolysis and albuminuria in adults with sickle cell anemia. Haematologica. 2012;97:201–205. doi: 10.3324/haematol.2011.050336. [DOI] [PMC free article] [PubMed] [Google Scholar]
- Dharnidharka VR, Dabbagh S, Atiyeh B, Simpson P, Sarnaik S. Prevalence of microalbuminuria in children with sickle cell disease. Pediatr Nephrol. 1998;12:475–478. doi: 10.1007/s004670050491. [DOI] [PubMed] [Google Scholar]
- Elfenbein IB, Patchefsky A, Schwartz W, Weinstein AG. Pathology of the glomerulus in sickle cell anemia with and without nephrotic syndrome. Am J Pathol. 1974;77:357–374. [PMC free article] [PubMed] [Google Scholar]
- Forman K, Sokol RJ, Hewitt S, Stamps BK. Paroxysmal nocturnal haemoglobinuria. A clinicopathological study of 26 cases. Acta Haematol. 1984;71:217–226. doi: 10.1159/000206591. [DOI] [PubMed] [Google Scholar]
- Gladwin MT, Kanias T, Kim-Shapiro DB. Hemolysis and cell-free hemoglobin drive an intrinsic mechanism for human disease. J Clin Invest. 2012;122:1205–1208. doi: 10.1172/JCI62972. [DOI] [PMC free article] [PubMed] [Google Scholar]
- Gordeuk VR, Sachdev V, Taylor JG, Gladwin MT, Kato G, Castro OL. Relative systemic hypertension in patients with sickle cell disease is associated with risk of pulmonary hypertension and renal insufficiency. Am J Hematol. 2008;83:15–18. doi: 10.1002/ajh.21016. [DOI] [PMC free article] [PubMed] [Google Scholar]
- Guasch A, Cua M, Mitch WE. Early detection and the course of glomerular injury in patients with sickle cell anemia. Kidney Int. 1996;49:786–791. doi: 10.1038/ki.1996.109. [DOI] [PubMed] [Google Scholar]
- Guasch A, Zayas CF, Eckman JR, Muralidharan K, Zhang W, Elsas LJ. Evidence that microdeletions in the alpha globin gene protect against the development of sickle cell glomerulopathy in humans. J Am Soc Nephrol. 1999;10:1014–1019. doi: 10.1681/ASN.V1051014. [DOI] [PubMed] [Google Scholar]
- Guasch A, Navarrete J, Nass K, Zayas CF. Glomerular involvement in adults with sickle cell hemoglobinopathies: Prevalence and clinical correlates of progressive renal failure. J Am Soc Nephrol. 2006;17:2228–2235. doi: 10.1681/ASN.2002010084. [DOI] [PubMed] [Google Scholar]
- Gurkan S, Scarponi KJ, Hotchkiss H, Savage B, Drachtman R. Lactate dehydrogenase as a predictor of kidney involvement in patients with sickle cell anemia. Pediatr Nephrol. 2010;25:2123–2127. doi: 10.1007/s00467-010-1560-8. [DOI] [PubMed] [Google Scholar]
- Hatch FE, Culbertson JW, Diggs LW. Nature of the renal concentrating defect in sickle cell disease. J Clin Invest. 1967;46:336–345. doi: 10.1172/JCI105535. [DOI] [PMC free article] [PubMed] [Google Scholar]
- Levey AS, Stevens LA, Schmid CH, Zhang YL, Castro AF, 3rd, Feldman HI, Kusek JW, Eggers P, Van Lente F, Greene T, Coresh J, Ckd EPI. A new equation to estimate glomerular filtration rate. Ann Intern Med. 2009;150:604–612. doi: 10.7326/0003-4819-150-9-200905050-00006. [DOI] [PMC free article] [PubMed] [Google Scholar]
- Maier-Redelsperger M, Levy P, Lionnet F, Stankovic K, Haymann JP, Lefevre G, Avellino V, Perol JP, Girot R, Elion J. Strong association between a new marker of hemolysis and glomerulopathy in sickle cell anemia. Blood Cells Mol Dis. 2010;45:289–292. doi: 10.1016/j.bcmd.2010.08.001. [DOI] [PubMed] [Google Scholar]
- Minneci PC, Deans KJ, Zhi H, Yuen PS, Star RA, Banks SM, Schechter AN, Natanson C, Gladwin MT, Solomon SB. Hemolysis-associated endothelial dysfunction mediated by accelerated NO inactivation by decompartmentalized oxyhemoglobin. J Clin Invest. 2005;115:3409–3417. doi: 10.1172/JCI25040. [DOI] [PMC free article] [PubMed] [Google Scholar]
- Muller-Eberhard U, Javid J, Liem HH, Hanstein A, Hanna M. Plasma concentrations of hemopexin, haptoglobin and heme in patients with various hemolytic diseases. Blood. 1968;32:811–815. [PubMed] [Google Scholar]
- Nath KA, Katusic ZS. Vasculature and kidney complications in sickle cell disease. J Am Soc Nephrol. 2012;23:781–784. doi: 10.1681/ASN.2011101019. [DOI] [PMC free article] [PubMed] [Google Scholar]
- Nath KA, Grande JP, Haggard JJ, Croatt AJ, Katusic ZS, Solovey A, Hebbel RP. Oxidative stress and induction of heme oxygenase-1 in the kidney in sickle cell disease. Am J Pathol. 2001;158:893–903. doi: 10.1016/S0002-9440(10)64037-0. [DOI] [PMC free article] [PubMed] [Google Scholar]
- National Kidney Foundation. K/DOQI clinical practice guidelines for chronic kidney disease: evaluation, classification, and stratification. Am J Kidney Dis. 2002;39:S1–266. [PubMed] [Google Scholar]
- Naumann HN, Diggs LW, Barreras L, Williams BJ. Plasma hemoglobin and hemoglobin fractions in sickle cell crisis. Am J Clin Pathol. 1971;56:137–147. doi: 10.1093/ajcp/56.2.137. [DOI] [PubMed] [Google Scholar]
- Nebor D, Broquere C, Brudey K, Mougenel D, Tarer V, Connes P, Elion J, Romana M. Alpha-thalassemia is associated with a decreased occurrence and a delayed age-at-onset of albuminuria in sickle cell anemia patients. Blood Cells Mol Dis. 2010;45:154–158. doi: 10.1016/j.bcmd.2010.06.003. [DOI] [PubMed] [Google Scholar]
- Nissenson AR, Port FK. Outcome of end-stage renal disease in patients with rare causes of renal failure. I. Inherited and metabolic disorders. Q J Med. 1989;73:1055–1062. [PubMed] [Google Scholar]
- Pegelow CH, Colangelo L, Steinberg M, Wright EC, Smith J, Phillips G, Vichinsky E. Natural history of blood pressure in sickle cell disease: risks for stroke and death associated with relative hypertension in sickle cell anemia. Am J Med. 1997;102:171–177. doi: 10.1016/s0002-9343(96)00407-x. [DOI] [PubMed] [Google Scholar]
- Platt OS, Brambilla DJ, Rosse WF, Milner PF, Castro O, Steinberg MH, Klug PP. Mortality in sickle cell disease. Life expectancy and risk factors for early death. N Engl J Med. 1994;330:1639–1644. doi: 10.1056/NEJM199406093302303. [DOI] [PubMed] [Google Scholar]
- Powars DR, Elliott-Mills DD, Chan L, Niland J, Hiti AL, Opas LM, Johnson C. Chronic renal failure in sickle cell disease: risk factors, clinical course, and mortality. Ann Intern Med. 1991;115:614–620. doi: 10.7326/0003-4819-115-8-614. [DOI] [PubMed] [Google Scholar]
- Powars DR, Chan LS, Hiti A, Ramicone E, Johnson C. Outcome of sickle cell anemia: a 4-decade observational study of 1056 patients. Medicine (Baltimore) 2005;84:363–376. doi: 10.1097/01.md.0000189089.45003.52. [DOI] [PubMed] [Google Scholar]
- Raij L, Azar S, Keane W. Mesangial immune injury, hypertension, and progressive glomerular damage in Dahl rats. Kidney Int. 1984;26:137–143. doi: 10.1038/ki.1984.147. [DOI] [PubMed] [Google Scholar]
- Reiter CD, Wang X, Tanus-Santos JE, Hogg N, Cannon RO, 3rd, Schechter AN, Gladwin MT. Cell-free hemoglobin limits nitric oxide bioavailability in sickle-cell disease. Nat Med. 2002;8:1383–1389. doi: 10.1038/nm1202-799. [DOI] [PubMed] [Google Scholar]
- Roth EF, Jr, Bardfeld PA, Goldsmith SJ, Radel E, Williams JC. Sickle cell crisis as evaluated from measurements of hydroxybutyrate dehydrogenase and myoglobin in plasma. Clin Chem. 1981;27:314–316. [PubMed] [Google Scholar]
- Schein A, Enriquez C, Coates TD, Wood JC. Magnetic resonance detection of kidney iron deposition in sickle cell disease: a marker of chronic hemolysis. J Magn Reson Imaging. 2008;28:698–704. doi: 10.1002/jmri.21490. [DOI] [PMC free article] [PubMed] [Google Scholar]
- Steinberg MH, McCarthy WF, Castro O, Ballas SK, Armstrong FD, Smith W, Ataga K, Swerdlow P, Kutlar A, DeCastro L, Waclawiw MA Investigators of the Multicenter Study of Hydroxyurea in Sickle Cell, A. & Follow-Up, M.S.H.P. The risks and benefits of long-term use of hydroxyurea in sickle cell anemia: A 17.5 year follow-up. Am J Hematol. 2010;85:403–408. doi: 10.1002/ajh.21699. [DOI] [PMC free article] [PubMed] [Google Scholar]
- Szabo G, Magyar S, Kocsar L. Passage of haemoglobin into urine and lymph. Acta Med Acad Sci Hung. 1965;21:349–359. [PubMed] [Google Scholar]
- Tejani A, Phadke K, Adamson O, Nicastri A, Chen CK, Sen D. Renal lesions in sickle cell nephropathy in children. Nephron. 1985;39:352–355. doi: 10.1159/000183404. [DOI] [PubMed] [Google Scholar]
- Tracz MJ, Alam J, Nath KA. Physiology and pathophysiology of heme: implications for kidney disease. J Am Soc Nephrol. 2007;18:414–420. doi: 10.1681/ASN.2006080894. [DOI] [PubMed] [Google Scholar]
- Vermeulen Windsant IC, Snoeijs MG, Hanssen SJ, Altintas S, Heijmans JH, Koeppel TA, Schurink GW, Buurman WA, Jacobs MJ. Hemolysis is associated with acute kidney injury during major aortic surgery. Kidney Int. 2010;77:913–920. doi: 10.1038/ki.2010.24. [DOI] [PubMed] [Google Scholar]
Associated Data
This section collects any data citations, data availability statements, or supplementary materials included in this article.