

Abstract
Eicosanoids, including prostaglandins (PG) and leukotrienes, are lipid mediators derived from arachidonic acid. A quantitative and biochemical level understanding of eicosanoid metabolism would aid in understanding the mechanisms that govern inflammatory processes. Here, we present a combined experimental and computational approach to understanding the biochemical basis of eicosanoid metabolism in macrophages. Lipidomic and transcriptomic measurements and analyses reveal temporal and dynamic changes of the eicosanoid metabolic network in mouse bone marrow-derived macrophages (BMDM) upon stimulation of the Toll-like receptor 4 with Kdo2-Lipid A (KLA) and stimulation of the P2X7 purinergic receptor with adenosine 5′-triphosphate. Kinetic models were developed for the cyclooxygenase (COX) and lipoxygenase branches of arachidonic acid metabolism, and then the rate constants were estimated with a data set from ATP-stimulated BMDM, using a two-step matrix-based approach employing a constrained least-squares method followed by nonlinear optimization. The robustness of the model was validated through parametric sensitivity, uncertainty analysis, and predicting an independent dataset from KLA-primed ATP-stimulated BMDM by allowing the parameters to vary within the uncertainty range of the calculated parameters. We analyzed the functional coupling between COX isozymes and terminal enzymes by developing a PGH2-divided model. This provided evidence for the functional coupling between COX-2 and PGE2 synthase, between COX-1/COX-2 and PGD2 synthase, and also between COX-1 and thromboxane A2 synthase. Further, these functional couplings were experimentally validated using COX-1 and COX-2 selective inhibitors. The resulting fluxomics analysis demonstrates that the “multi-omics” systems biology approach can define the complex machinery of eicosanoid networks.
Introduction
Advances in “omics” technologies (genomics, transcriptomics, proteomics, and metabolomics) during the past decade are driving progress in the field of systems-level modeling and understanding of biochemical mechanisms leading to defined phenotypes (1). Owing to technological challenges in measurements, lipidomics has lagged behind genomics and proteomics. However, recent advances in mass spectrometry have enabled us to identify and quantify a large number of lipid species (2). The Lipid Metabolites and Pathways Strategy (LIPID MAPS) Consortium has classified lipids into eight categories (3). One of the major lipid classes in the fatty-acyl category is eicosanoids, including the prostaglandins (PG) and leukotrienes (LT), which are derived from arachidonic acid (AA), a 20-carbon unsaturated fatty acid (4). Biological actions of eicosanoids and other lipid mediators such as platelet-activating factor (5,6) are elicited by their binding to specific G-protein coupled receptors (7). Eicosanoids play a major role in maintaining various biological functions (e.g., contraction of the uterus by PGE2, regulation of sleep by PGD2, induction of bronchoconstriction by LTC4 and LTD4) as well as modulating pathophysiology including inflammation (8) with its involvement in disorders such as multiple sclerosis (9,10)).
Eicosanoid production is spatially and temporally regulated by the sequential actions of eicosanoid-synthesizing enzymes (4,11). In particular, the Group IVA cytosolic phospholipase A2 (cPLA2) translocates from cytosol to the nuclear envelope, endoplasmic reticulum, and Golgi apparatus in response to inflammatory stimuli (12). This enzyme hydrolyzes membrane phospholipids and produces AA. The cyclooxygenases (COXs, such as COX-1 and COX-2) metabolize AA to produce an unstable endoperoxide intermediate, PGH2, which is further metabolized to PGD2, PGE2, PGF2α, PGI2, and thromboxane A2 (TXA2) by terminal enzymes (13). Similarly, the lipoxygenases (LOXs, such as 5-LOX and 12/15-LOX) metabolize AA to produce hydroperoxyeicosatetraenoic acids, which are converted into leukotrienes (such as LTA4 and LTB4) and hydroxyeicosatetraenoic acids by enzymatic and nonenzymatic reactions. A spatial and temporal coupling between COX isozymes and terminal enzymes for PG production has been proposed previously based on reconstitution experiments in HEK293 cells (14); however, the molecular basis of the functional couplings in intact cells has not been elucidated.
Macrophages produce large amounts of eicosanoids depending upon the inflammatory stimuli, such as adenosine 5′-triphosphate (ATP) and lipopolysaccharide (LPS). ATP is an important molecule for a wide variety of cellular functions including bioenergetics and intracellular signaling, whereas extracellular ATP plays important roles in both innate and adaptive immunity through the cell-surface purinergic P2 receptors ionotropic P2X and metabotropic P2Y (15,16) (see Fig. S1 in the Supporting Material). These receptors increase intracellular calcium concentration and activate protein kinase C, resulting in the posttranslational activation of the cPLA2, release of AA and subsequent production of eicosanoids (17). Similarly, a bacterial component, LPS, binds to toll-like receptor-4 expressed on macrophages and then activates intracellular signaling through mitogen-activated protein kinases and nuclear factor-κ B (18). These signals also posttranslationally activate cPLA2 and transcriptionally induce COX-2/prostaglandin-endoperoxide synthase (Ptgs) such as Ptgs2 and microsomal PGE synthase-1 (mPGES-1/Ptges) (13,19,20).
Nonsteroidal antiinflammatory drugs (NSAIDs; e.g., aspirin, indomethacin, and ibuprofen), which inhibit COXs associated with eicosanoid metabolism, are used for the treatment of pain, fever, and inflammation. It was generally believed that specific inhibitors for COX-2 would be effective for the treatment of inflammatory disorders because of their inducible nature after exposure to proinflammatory stimuli such as LPS (13). However, a selective COX-2 inhibitor, rofecoxib (Vioxx; Merck, Whitehouse Station, NJ), was shown to display off-target effects (21), suggesting the existence of a complex machinery for AA metabolism.
The LIPID MAPS consortium has been collecting large-scale lipidomics datasets using sophisticated mass spectrometry systems in human plasma (22) and murine macrophages stimulated with Kdo2-Lipid A (KLA, a specific toll-like receptor-4 agonist) (23). A systems biology approach provides a powerful strategy for quantitative understanding of the molecular basis of lipid metabolic networks in mammalian cells by integrating existing mechanistic knowledge and novel high-throughput data (24). Here, we have developed a quantitative computational model of the AA metabolic network in bone marrow-derived macrophages (BMDM). The model was developed by using large-scale lipidomics and transcriptomics datasets that were experimentally obtained from ATP-stimulated BMDM. This computational model was tested by predicting the eicosanoid profile in KLA-primed ATP-stimulated BMDM. Furthermore, to understand the roles of COX-1 and COX-2 on eicosanoid production, the PGH2 was divided into two different pools which were produced from COX-1 and COX-2, respectively. A PGH2-divided computational model was developed. A hypothesis of functional coupling between COX isozymes and terminal enzymes was generated and validated experimentally.
Materials and Methods
BMDM cell culture
C57BL/6 mice from Charles Rivers Laboratories (Willimantic, CT) were used for preparing BMDM cells (protocol available at: www.lipidmaps.org/protocols/PP0000004702.pdf). Three biological replicates (five mice in each) were performed on different days. Briefly, bone marrow was flushed from the femurs and tibiae of 2–3-months-old mice and cultured for six days. BMDM cells were detached and plated at the density of 1 × 10⁶/mL onto 100-mm culture dishes. ATP (2 mM) stimulation was performed with or without KLA (100 ng/mL) 4 h pretreatment. The data obtained from treatment without KLA (nonprimed) and with KLA (KLA-primed) are henceforth referred to as “dataset A” and “dataset B”, respectively. The media were collected at the time series comprising of eight points: 0, 0.25, 0.5, 1, 2, 4, 8, and 20 h after ATP stimulation. For normalization purposes, DNA was measured (protocol available at: www.lipidmaps.org/protocols/PP0000002700.pdf).
Lipidomics
The eicosanoids were separated by reverse-phase liquid chromatography on a C18 column and analyzed using a tandem quadrupole mass spectrometer (MDS SCIEX 4000 Q Trap; Applied Biosystems, Foster City, CA) via multiple-reaction monitoring in negative-ionization mode (22,25). We have previously determined that the variations in technical replicates were much smaller than the biological variation, and hence did not perform technical replicates in these experiments. Eicosanoid levels are reported herein, and additional data is freely available online (http://www.lipidmaps.org/). All metabolites were measured in pmol/μg DNA units. Outlier points were detected by a simple z-test and were excluded at each time-point (see the Supporting Material). The error bars were relatively large in eicosanoids with low absolute amounts (e.g., LTB4) due to biological variability.
Transcriptomics
Microarrays were used to measure changes in gene expression in response to treatment in BMDM cells over time. At each time point, a custom array of 38,489 unique probes representing 21,291 unique genes (Agilent Technologies, Danbury, CT) was hybridized. A dye swap microarray experiment was performed as another biological replicate. Data was normalized using the LOWESS method. The significantly up- and downregulated genes were identified using cyber-T (26).
Computational modeling and parameter estimation
A detailed metabolic network was constructed based on literature and KEGG pathways; the network was simplified and a degradation flux was added to all the lipid metabolites (27,28). In the modeling of metabolism of AA through the COX and the LOX pathways, the lipid metabolic pathways upstream of AA and the signaling pathways that regulate AA metabolism were not modeled due to the unknown factors and complexity. Hence, we did not fit the AA data in the above optimization problem. By avoiding doing so, we were able to decouple the COX and LOX branches for kinetic modeling and parameter-estimation purposes.
Ordinary differential equations (ODEs) were used to develop the models. Linear kinetics was used for reaction rates based on the following reasons:
-
1.
Out of 36 reactions, 18 were related to degradation, and six to nonenzymatic reactions;
-
2.
Because PGH2 and LTA4 are unstable and not measurable in cellular systems, they are likely to stay well below the saturating concentration in vivo; and
-
3.
According to the BRENDA database (http://www.brenda-enzymes.info/), we could assume that the substrate concentrations are much smaller as compared to the corresponding Michaelis constant, Km, in most of the remaining reactions.
We have captured the effect of temporal changes in protein levels by utilizing the microarray data with a 4 h time delay as an input to the model. This assumes that the corresponding protein profile is similar to the mRNA time course with the 4 h delay. The use of mRNA data was motivated by good correlations between eicosanoid pathway genes and protein levels in RAW264.7 cells (29). We recently reported that the COX-2 protein profile was upregulated and sustained for 24 h (29,30). Thus, we considered the temporal change of COX-2 levels as a sustained profile at its peak-level. The upregulated and sustained profile of COX-2 also suggested that COX-2 protein degradation rates seem to be slower than the protein synthesis rates in the 24 h timeframe. Because of the use of gene expression data in our model, calculated (estimated) rate constants are slightly different from traditional rate constants. For example, we have defined the rate of COX-2-dependent AA production as:
-
•
vC2 = Kcox-2[Ptgs2t=0][Ptgs2FC][AA], where Kcox-2 is the intrinsic rate constant (as traditionally defined),
-
•
[Ptgs2t=0] is the concentration of the protein COX-2 at t = 0, and
-
•
[Ptgs2FC] is the fold change of Ptgs2 gene with a time-delay of 4 h.
Because [Ptgs2t=0] is unknown, we lumped [Ptgs2t=0] with KCOX-2 and defined an effective rate constant kC2 as
-
•
vC2 = kC2[Ptgs2FC][AA], where kC2 = Kcox-2 × [Ptgs2t=0].
Model formulation is explained with the following two reactions: conversion of AA into LTA4 and LTA4 into LTB4. All the reactions are listed in Table S1 and Table S2 in the Supporting Material for COX and LOX pathways, respectively. One can write the following ODEs for LTA4 and LTB4:
| (1) |
where the rate constants kCi (i = 1–22) for COX and kLj (j = 1–14) for LOX were as defined in Table S1 and Table S2, respectively. These ODEs can be rearranged in a matrix format as follows:
| (2) |
where b is a matrix for rate constants, and X and Y are known matrices from data for metabolite concentrations and reaction rates, respectively (27,31). A constrained least-squares approach (MATLAB software function “lsqlin”; The MathWorks, Natick, MA) was used to solve b (constraint: b ≥ 0). The estimated values of the parameters were further refined by using a generalized constrained nonlinear optimization (MATLAB software function “fmincon”), as
| (3) |
where the objective (Eq. 3) was to minimize the weighted fit-error between the experimental and the predicted metabolite concentrations and their slopes (time derivative). The value nt is the number of time-points and nsp is the number of species. Numerical integration was used (e.g., MATLAB function “ode23”) to simulate the system to circumvent the discretization error. Additional description is provided in the Supporting Material.
Results
Lipidomic and transcriptomic analysis of the eicosanoid pathway in ATP-stimulated BMDM in the presence or absence of KLA-priming
Lipidomics analysis of ATP-stimulated BMDM (Fig. 1 A, nonprimed, dataset A) showed different patterns in the AA cascade between COX and LOX pathways (Fig. 1 B). COX metabolites were gradually accumulated in the late phase of stimulation, whereas 5-LOX metabolites such as LTB4 peaked within 2 h. Previous work from our laboratory showed that RAW264.7 cells produce eicosanoids upon ATP stimulation in a timescale of 1–2 h (32), whereas this study reveals the prolonged production of eicosanoids in ATP-stimulated BMDM lasting as much as 20 h. To determine the gene expression of the eicosanoid-synthesizing enzymes, BMDM were collected and total mRNA was extracted for transcriptomic analysis (Fig. 1 C). The expression of Ptgs2, Prostaglandin E synthase (Ptges), and LTB4 12-Hydroxydehydrogenase (Ltb4dh) were highly upregulated in ATP-stimulated BMDM (Fig. 1 C). The expressions of Prostaglandin D synthase 2 (Ptgds2), arachidonate 5-lipoxygenase (Alox5), Alox5ap, and LTC4 synthase (Ltc4s) mRNAs were downregulated in the late phase of ATP stimulation. These results suggest that eicosanoid levels are regulated differently by ATP signaling in BMDM cells than in RAW264.7 cells.
Figure 1.
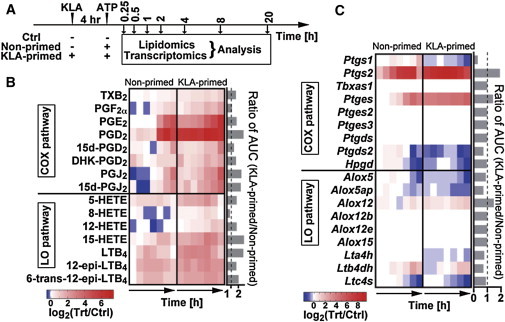
Lipidomics and transcriptomics analysis. (A) BMDM were pretreated with or without KLA for 4 h, and then stimulated with or without ATP. Media and cells were collected for lipidomic and transcriptomic analysis. The representative lipidomic (B) and transcriptomic (C) data for the AA metabolic network are shown as heat maps based on primary data available online (http://www.lipidmaps.org; H.A. Brown, unpublished). The ratios of ATP-treated (nonprimed)/control (Ctrl) and KLA-primed-ATP-treated (KLA-primed)/Ctrl at the corresponding time points were normalized using log transformations. The ratios of AUC of eicosanoid profiles in KLA-primed/nonprimed are shown on the right side of the heat maps.
To analyze the priming effects of KLA on eicosanoid production, BMDM cells were pretreated with KLA for 4 h and then stimulated with ATP (Fig. 1 A, KLA-primed, dataset B). Lipidomic analysis showed similar patterns for the AA cascade when comparing the combined treatment with ATP-only stimulation, but the amounts of most eicosanoids were increased by pretreatment with KLA. The priming effects were calculated by the ratio of area under the curve (AUC) of lipid profiles during the time course between KLA-primed versus nonprimed BMDM (Fig. 1 B). Most of the eicosanoid levels were upregulated in KLA-primed BMDM as compared with nonprimed cells (Fig. 1 B). The Ptgs2 and Ptges expression were amplified by KLA priming, whereas the levels of Ptgs1, Alox5, Alox5ap, etc., were decreased (Fig. 1 C). These results suggest that KLA-priming upregulates gene expression of Ptgs2 and Ptges and thus facilitate the increased eicosanoid production.
Development of a kinetic model of the AA metabolic network
To obtain the kinetic parameters, the AA metabolic network was simplified and divided into COX and LOX subnetworks (Fig. 2 A, detailed illustration of the intracellular signaling with eicosanoid metabolic network is shown in Fig. S1). As an example of simplification, thromboxane A2 (TXA2) synthase (Tromboxane A synthase (TXAS)/thromboxane A synthase 1 (Tbxas1)) produces a bioactive lipid mediator, TXA2, but TXA2 is rapidly and nonenzymatically degraded to TXB2, which is measurable under our experimental condition. Therefore, the simplified network included TXB2 but not TXA2. Next, the models for both pathways were described by 16 ODEs in total (see the Supporting Material). The rate constants were estimated using a constrained least-squares method followed by a constrained nonlinear optimization (Materials and Methods). Then, the eicosanoid profiles for dataset A (control and nonprimed) were simulated (Fig. 2, B and C). For most time points, the difference between the simulated and experimental data in both treatment and control conditions was within the standard error of the mean (mean ± SE). The goodness of fit was further examined by F-test, indicating that the fit-error was lesser or comparable to experimental measurement error (see Table S3). Therefore, we defined these parameters as calculated parameters kCn and kLn for COX and LOX pathways, respectively (see Table S1 and Table S2). We could not measure the level of PGH2 because it is an unstable intermediate. Therefore, in the parameter estimation process, we optimized the profile for PGH2 formation with the constraint that its maximum concentration remains <∼10 pmol/μg DNA based on the total amount of PGs produced. The uncertainty analysis was performed to compute the mean ± SE of calculated parameters (see Table S1 and Table S2). The computed means ± SEs for the parameters were of the same order as the mean ± SE for the lipid and gene data (∼30%). As a mathematical artifact, in the case of some of the degradation reactions or small optimized-value of the parameters, high relative-fluctuations were observed in the mean ± SE of parameters. We have validated our model by excluding the data on one of the intermediate metabolites from the objective function. Because all measured metabolites in the LOX pathway are leaf-nodes, the rate parameters were estimated only in the COX pathway when excluding PGJ2 (see Fig. S2). The values of these parameters were similar to those of corresponding calculated parameters kCn (see Fig. S2 A). In addition, the simulated time-courses were in good agreement with the experimental time-courses qualitatively and quantitatively (see Fig. S2 B). These results suggest that this mathematical model is reliable for simulating eicosanoid metabolism.
Figure 2.
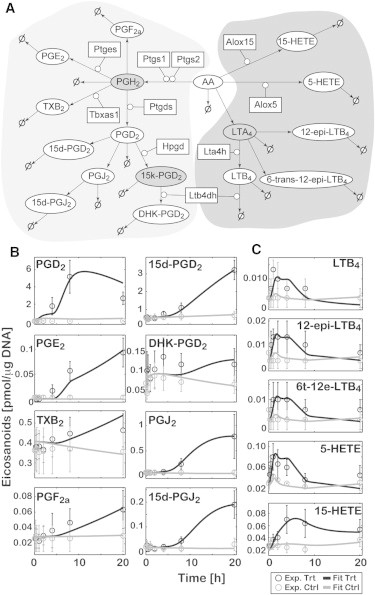
Computational simulation of eicosanoid profile in ATP-stimulated BMDM (for dataset A). (A) Simplified COX (left side) and LOX (right side) pathway maps are shown. (Rectangles) Enzymes; (ellipses) lipid metabolites. (Shaded) Unmeasured metabolites. (Arrows) Enzymatic and nonenzymatic reactions. (∅) Additional metabolic pathways including degradation. The simulation results for COX (B) and LOX (C) metabolites are shown. The experimental data (Exp) for ATP-treated (Trt) and control (Ctrl) represent mean ± SE (n = 3). The simulation results (Fit) are shown (solid and shaded curves, respectively) for Trt and Ctrl.
To investigate the robustness of the developed eicosanoid model, parametric sensitivity analysis was performed by varying each parameter (one at a time) by twofold up and down from their optimized value (see Fig. S3). The slope of the sensitivity curve was calculated to evaluate the sensitivity for each parameter and each metabolite (see Fig. S3). With most of the parameters, small to moderate sensitivities were observed, and the sensitivities were consistent with the structure of the biochemical reaction network. These results suggest that our model of eicosanoid metabolism is robust with respect to parametric perturbations.
To understand the biochemical reaction network, a timescale analysis was performed by computing eigenvalues and eigenvectors of the Jacobian matrix of the ODEs at steady-state conditions. The timescale was divided into three ranges (i.e., fast, medium, and slow) depending upon the eigenvalues and metabolites significantly contributing to the corresponding eigenvectors. All the 5-LOX metabolites (LTA4, LTB4, 12-epi-LTB4, 6-trans-12-epi-LTB4) were grouped in the fast timescale. On the other hand, most of the COX metabolites were distributed mainly in the medium (PGD2, 15-keto-PGD2, PGJ2, 15-deoxy-PGJ2) and slow (TBX2, PGF2α, 13,14-dihydro-15-keto-PGD2 (DHK-PGD2) 15-deoxy-PGD2) groups. Thus, these two metabolic pathways were successfully separated by timescale analysis.
Prediction of the eicosanoid profile in KLA-primed ATP-stimulated BMDM
We hypothesized that our computational model can predict the eicosanoid profile in KLA-primed BMDM (dataset B). When the profiles were predicted with the optimized parameter values, the predicted (or simulated) time-courses did not fit the experimental data well. Therefore, up to 30% variability was allowed in the optimized parameter values. The range of 30% variability was chosen based on the uncertainty analysis of the calculated parameters in the ATP-stimulated model. The simulation results with the recalculated parameters were comparable with the experimental data (Fig. 3, and see the results of F-test in Table S3). This prediction of an independent experimental dataset (dataset B), which was not used to fit the ATP-stimulation data (dataset A), further validated the model. Collectively, calculated parameters with an uncertainty range (∼30%) are reliable in predicting eicosanoid profiles, and the mathematical model reflects realistic AA metabolic networks in BMDM.
Figure 3.
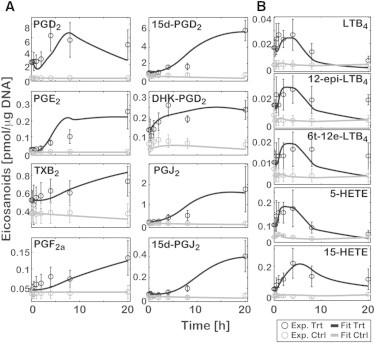
Computational prediction of the eicosanoid profile in KLA-primed ATP-stimulated BMDM (for dataset B). The predicted results for COX (A) and LOX (B) metabolites are shown. The experimental data (Exp) for KLA-primed ATP-treated (Trt) and control (Ctrl) represent mean ± SE (n = 3). The simulation results (Fit) are shown (solid and shaded curves, respectively) for Trt and Ctrl.
PGH2-divided model
PGH2 is produced by both COX-1 and COX-2. However, it is difficult to experimentally distinguish between the COX-1 and COX-2-derived PGH2 in intact cells. Hence, we developed the computational model without distinguishing the different sources of PGH2 (single PGH2 model). Next, we developed a PGH2-divided model using the same modeling strategy to delineate the role of COX-1 and COX-2.
PGH2 in the original simulation was separated into COX-1 and COX-2-derived PGH2 (C1PGH2 and C2PGH2, respectively) (Fig. 4 A). The effective rate constants kCPn were estimated by using dataset A (see Table S4). The simulation results fit the experimental data well (see Fig. S4, and see the results of F-test in Table S3). The uncertainty analysis revealed a small fluctuation in calculated parameters similar to the results from the single-PGH2 model (see Table S4). Because the metabolic network downstream of PGD2 is conserved in both models, the calculated parameters kCP17–27 were compared with corresponding optimized parameters in the single-PGH2 model, kC12–22, to assess the validity of the PGH2-divided model (Fig. 4 B). Most of the calculated parameters, kCP17–27, in the PGH2-divided model were comparable with the corresponding parameters kC12–22 of the single-PGH2 model, although we observed differences in some of the parameters for degradation reactions or the parameters with small initial values. These results indicate that the PGH2-divided model retained the properties of the single-PGH2 model for the network downstream of PGD2. The KLA-priming effects on the eicosanoid profile (dataset B) were predicted by using calculated parameters with a 30% variation. The good fit to the experimental data with a high predictive accuracy was obtained similarly to that for the single-PGH2 model (see Fig. S5 and the results of F-test in Table S3), indicating that the PGH2-divided model has all the important features of the single PGH2-model.
Figure 4.
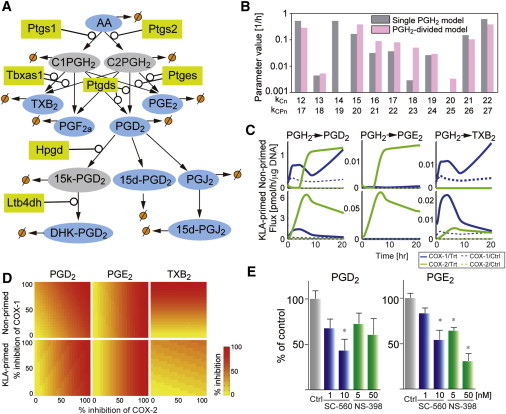
PGH2-divided model. (A) A modified COX pathway is shown. (Rectangles) Enzymes; (ellipses) lipid metabolites. C1PGH2, C2PGH2, and 15-keto-PGD2 are unmeasured metabolites. (Arrows) Enzymatic and nonenzymatic reactions. (∅) Other metabolic pathways including degradation. (B) Kinetic parameter values in the PGH2-divided model (pink or light-gray, kCPn) and the corresponding values in the single-PGH2 model (dark-gray, kCn) are compared to validate the PGH2-divided model. (C) Fluxes are computed by using calculated parameters. COX-1 and COX-2-mediated fluxes in ATP-stimulated (nonprimed) and KLA-primed ATP-stimulated (KLA-primed) BMDM are shown (as blue/dark-gray and green/light-gray lines, respectively). (Dotted lines) Simulated fluxes in control cells. (D) The inhibitory effects of NSAIDs are simulated by changing the calculated parameters kCP1, kCP2, kCP'1, and kCP'2. The efficiencies of NSAIDs are calculated as a ratio of AUC between nontreated and NSAID-treated cells. (E) PGD2 and PGE2 were quantified in the presence or absence of COX inhibitors at 20 h after ATP stimulation. The eicosanoid levels were normalized using control levels. (Bars) Mean ± SE (n = 6 from two independent experiments). ∗p < 0.05 versus Ctrl, by Kruskal-Wallis test followed by Dunn's multiple comparison test. To see this figure in color, go online.
Functional coupling of COXs and terminal enzymes
To understand how COX-1 and COX-2 differently divert PGH2 to downstream products, we calculated the PGH2 fluxes and inhibitory effects of COXs on eicosanoid profiles. The fluxes were computed from the calculated parameters (Fig. 4 C). In the nonprimed BMDM, the COX-1-mediated PGD2 flux was primarily observed at the early phase, and then the total in-flux of PGD2 was divided into COX-1 and COX-2-mediated fluxes. The COX-2-mediated PGE2 flux was predominantly observed at the late phase, while a small, but an essential, C2PGH2→PGE2 flux was also detected at the early phase. TXB2 production was dependent on COX-1, because the optimized value of the rate constant of C2PGH2→TXB2, kCP7, was 0. With the aim of understanding the effect of KLA-priming, the kinetic parameters of KLA-primed BMDM, kCP', were independently estimated by using the calculated parameters kCP within the computed mean ± SE (see Table S4). In the KLA-primed BMDM, COX-2-mediated fluxes were increased in PGD2, PGE2, and TXB2 as compared to nonprimed BMDM. The PGE2 production was dependent on a COX-2-mediated flux. Although the C2PGH2→TXB2 flux was detected, the COX-1-mediated TXB2 flux was retained as the major flux.
Next, we simulated the inhibitory effects of NSAIDs on the eicosanoid profile in nonprimed macrophages by changing the calculated parameters (Fig. 4 D). In the nonprimed BMDM, PGE2, and TXB2 production were assumed to be efficiently and dose-dependently blocked by a COX-2-selective and COX-1-selective inhibitor, respectively. On the other hand, the effects of nonselective NSAIDs are well known to show no COX selectivity in inhibiting PGD2 production. In the KLA-primed BMDM, the model shows that COX-2-selective inhibitors were more efficient in preventing PGE2 and PGD2 production than COX-1-selective inhibitors. To confirm these simulation results, PGD2 and PGE2 levels were measured in culture media of ATP-stimulated BMDMs in the presence and absence of COX-1 and COX-2 selective inhibitors, SC-560 and NS-398, respectively (Fig. 4 E) (33). PGD2 production was inhibited at ∼40–60% by both SC-560 and NS-398, whereas NS-398 effectively inhibited PGE2 production as compared to SC-560 (Fig. 4 E). Although these selective inhibitors for COX isozymes selectively inhibit target COX isozyme in vitro, they lose their selectivity at higher dose in vivo (33). Indeed, at the higher concentration, we found that PGD2 and PGE2 production was inhibited >50% by both inhibitors. These results suggest that PGH2-divided model appears to reflect eicosanoid metabolism in macrophages.
More significantly, we found important functional couplings between COX and terminal synthases. The mPGES-1 selectively coupled with COX-2 but not with COX-1. The TXAS prefer to couple with COX-1 in nonprimed macrophages and it partially couples with COX-2 in LPS-primed macrophages. The coupling between PGD synthase (hematopoietic PGD synthase (H-PGDS)/Ptgds2) and COXs is possibly switched from COX-1 to COX-2 in nonprimed macrophages in a time-dependent manner, and is mostly dependent on COX-2 in LPS-primed macrophages (see the later part of Discussion).
Discussion
Systems biology is an emerging field that aims to facilitate the understanding of complex biological processes. The statistical analysis of high throughput data and the development of mathematical models help us in understanding complex biological systems. Due to the challenges in the measurements of lipids and the complexity of lipid metabolic networks, lipid systems biology is not yet well established. Previously, computational models of AA metabolism in human polymorphonuclear leukocytes (34) and in a multicellular ensemble of human inflammatory cells (35) have been reported. However, in these studies, most of the parameters are generated from a limited experimental dataset and the best-fit parameter sets are chosen in an arbitrary manner. In contrast, in this study we have used a two-step, matrix-based approach to estimate rate constants of the AA metabolic network in BMDM using a large amount of experimental data on the lipid metabolites. Because we found good correlations between specific gene transcript levels and their metabolites (23), the expression levels of enzymes were integrated into the model. All the kinetic parameters in our models were estimated through nonlinear optimization based on experimental data. Therefore, this study using a multi-omics data-driven systems biology approach is useful for understanding in vivo eicosanoid metabolism.
Our model is simple and is described by linear kinetics based on the law of mass action. Nevertheless, the model showed a good fit to the experimental data, suggesting that it captured the key characteristics of the lipid metabolic network in BMDM as discussed below.
The calculated rate constants, which are the effective rate constants in our model, of COX-1 were ∼20 times higher than those of COX-2 in BMDM in both the single-PGH2 and PGH2-divided models (see Table S1 and Table S4). Because the purified COX-1 and COX-2 have nearly identical rate constants in vitro (13), the differences of these two calculated rate constants are due to the differences in the basal protein-expression levels of COX-1 and COX-2 (see Materials and Methods). It is difficult to compare the expression levels among the different proteins experimentally based solely on transcript levels, but the computational model indicated that the basal protein-expression level of COX-2 seems to be <5% as compared to COX-1 expression. Indeed, PGE2 production with exogenous AA as the substrate was reduced >99% in nonstimulated COX-1−/− macrophages (36). Furthermore, it is difficult to detect the COX-2 expression in nonstimulated macrophages by Western blotting (37). Hence, the calculated parameters for COX-1 and COX-2 are plausible values in vivo, and our model supports the previous results that the constitutive PG production is dependent on COX-1 to a great extent.
To confirm the reliability of calculated rate constants, the fluxes for PGD2 and PGE2 were compared with the literature values. Because the unit used in the LIPID MAPS experiments for lipid concentration was pmol/μg of DNA, we converted the rate constants into mol/min/mg units using the experimentally obtained values of 0.25 mg of total protein, 3 μg of DNA, and 1 ng of mPGES-1 protein that are present in 106 cells (27,38). Urade et al. (39) reported that the PGD2 flux in macrophages is <1 nmol/min/mg of total protein. The activity of purified mouse mPGES-1 has been reported to be ∼100 nmol/min/mg of purified enzyme (40), which is equivalent to 0.0004 nmol/min/mg of total protein. In contrast, in our model, the calculated PGD2 and PGE2 fluxes at steady state were 0.1 and 0.0002 pmol/min/mg of total protein, respectively. Despite the differences in magnitude of fluxes, the finding that the flux distribution between PGD2 and PGE2 pathways is approximately the same and comparable to previous reports has an important implication for the validity of the computational model.
Eicosanoid production is spatially and temporally regulated by the sequential actions of eicosanoid-synthesizing enzymes (4). The PGH2-divided model provides evidence of functional coupling. A previous study showed that PGE2 production in mPGES-1/COX-2 cotransfected cells was much higher than that in mPGES-1/COX-1 cotransfected cells, and that even COX-1 did not produce PGE2 at low levels of AA, but only at high levels of AA, small but measurable PGE2 production was observed (41). Our model completely reproduced these results, because the calculated rate constants for PGE2 production through COX-2 were 10 times higher than that of COX-1 in nonprimed BMDM (see Table S1). In addition, a small but essential COX-1-mediated PGE2 flux was observed at the early phase during which AA is present at high concentrations (data available online, http://www.lipidmaps.org/). The model also predicted that a COX-2-selective inhibitor would be more effective in inhibiting PGE2 production than a COX-1-selective inhibitor (Fig. 4 D). This prediction was experimentally validated by using both COX-1 and COX-2-selective inhibitors (Fig. 4 E). Similar results have been reported by Kita et al. (33), in which PGE2 production is effectively blocked by the COX-2 selective inhibitor, NS-398, in LPS-primed thioglycolate-elicited macrophages.
With regard to TXAS and H-PGDS, relevant studies are consistent in demonstrating the preference of these enzymes for COX isozymes. COX-2/TXAS cotransfected cells produced less TXA2 compared to COX-1/TXAS cotransfected cells (14). The AA-induced aggregation of platelets, which is a major downstream effect of TXA2, is mostly prevented in COX-1−/− mice but not in wild-type mice (36). In accordance with these results, our flux analysis and inhibitor simulations revealed that TXB2 was produced only through COX-1 in nonprimed cells, whereas in KLA-primed BMDM, a fraction of the COX-2-mediated flux was also observed (Fig. 4, C and D). These results suggest that TXAS prefers to couple with COX-1. The immediate and delayed production of PGD2 in mast cells has been shown to exhibit coupling of H-PGDS with COX-1 and COX-2, respectively (42). Consistently, the PGH2→PGD2 flux was sequentially switched from COX-1 to COX-2 in our model (Fig. 4 C, top-left panel). Our results support the previous experimental results that pretreatment of rat macrophages with aspirin to inactivate constitutive COX abolished the generation of PGD2 and TXB2 formation (43). The PGH2-divided computational model provides convincing evidence of differential functional coupling between different COX isozymes and various terminal enzymes.
There are several antiinflammatory and proresolving lipid mediators, such as lipoxins and resolvins (44). Lipoxins are derived from AA, which are produced from macrophages through 12/15-LOX pathway (45). However, we could not detect these lipid mediators under our experimental condition, possibly because of using proinflammatory stimulants. It would be worth modeling the eicosanoid fluxes with different stimulants in future.
In conclusion, we have developed a quantitative model of the eicosanoid metabolic pathway by integrating lipidomics and transcriptomics data in primary macrophages. Additionally, we have been successful in predicting the eicosanoid profiles under a set of conditions different from that used for calculating the rate constants. By taking advantage of computational simulation, we have enhanced our understanding of the biological characteristics of eicosanoid metabolic networks. We predicted the functional coupling of COX isozymes and terminal enzymes and validated experimentally using COX-1 and COX-2-selective inhibitors. Therefore, our computational model helps in understanding the complex and highly integrative machinery of eicosanoid metabolism and assists in examining complex phenomena for which we have at this time no experimental approaches to determine these parameters under in vivo or ex vivo conditions.
Acknowledgments
This work was supported by the LIPID MAPS Large Scale Collaborative Grant No. U54 GM069338 from the National Institutes of Health (to E.A.D., C.K.G., and S.S.) and National Science Foundation grants (No. 0939370, No. 0835541, and No. 0641037 to S.S.). Y.K. received fellowships from the Uehara Memorial Foundation, Kanae Foundation for the Promotion of Medical Science, Mochida Memorial Foundation for Medical and Pharmaceutical Research, and the Human Frontier Science Program.
Footnotes
Yasuyuki Kihara’s current affiliation is Department of Molecular and Cellular Neuroscience, Dorris Neuroscience Center, The Scripps Research Institute, La Jolla, CA 92037.
Yasuyuki Kihara and Shakti Gupta contributed equally to this work.
Contributor Information
Edward A. Dennis, Email: edennis@ucsd.edu.
Shankar Subramaniam, Email: shankar@ucsd.edu.
Supporting Material
References
- 1.Dennis E.A. Lipidomics joins the omics evolution. Proc. Natl. Acad. Sci. USA. 2009;106:2089–2090. doi: 10.1073/pnas.0812636106. [DOI] [PMC free article] [PubMed] [Google Scholar]
- 2.Harkewicz R., Dennis E.A. Applications of mass spectrometry to lipids and membranes. Annu. Rev. Biochem. 2011;80:301–325. doi: 10.1146/annurev-biochem-060409-092612. [DOI] [PMC free article] [PubMed] [Google Scholar]
- 3.Fahy E., Subramaniam S., Dennis E.A. Update of the LIPID MAPS comprehensive classification system for lipids. J. Lipid Res. 2009;50(Suppl):S9–S14. doi: 10.1194/jlr.R800095-JLR200. [DOI] [PMC free article] [PubMed] [Google Scholar]
- 4.Funk C.D. Prostaglandins and leukotrienes: advances in eicosanoid biology. Science. 2001;294:1871–1875. doi: 10.1126/science.294.5548.1871. [DOI] [PubMed] [Google Scholar]
- 5.Kihara Y., Ishii S., Shimizu T. Dual phase regulation of experimental allergic encephalomyelitis by platelet-activating factor. J. Exp. Med. 2005;202:853–863. doi: 10.1084/jem.20050660. [DOI] [PMC free article] [PubMed] [Google Scholar]
- 6.Kihara Y., Yanagida K., Shimizu T. Platelet-activating factor production in the spinal cord of experimental allergic encephalomyelitis mice via the group IVA cytosolic phospholipase A2-lyso-PAFAT axis. J. Immunol. 2008;181:5008–5014. doi: 10.4049/jimmunol.181.7.5008. [DOI] [PubMed] [Google Scholar]
- 7.Shimizu T. Lipid mediators in health and disease: enzymes and receptors as therapeutic targets for the regulation of immunity and inflammation. Annu. Rev. Pharmacol. Toxicol. 2009;49:123–150. doi: 10.1146/annurev.pharmtox.011008.145616. [DOI] [PubMed] [Google Scholar]
- 8.Narumiya S., FitzGerald G.A. Genetic and pharmacological analysis of prostanoid receptor function. J. Clin. Invest. 2001;108:25–30. doi: 10.1172/JCI13455. [DOI] [PMC free article] [PubMed] [Google Scholar]
- 9.Kihara Y., Matsushita T., Shimizu T. Targeted lipidomics reveals mPGES-1-PGE2 as a therapeutic target for multiple sclerosis. Proc. Natl. Acad. Sci. USA. 2009;106:21807–21812. doi: 10.1073/pnas.0906891106. [DOI] [PMC free article] [PubMed] [Google Scholar]
- 10.Kihara Y., Yokomizo T., Shimizu T. The leukotriene B4 receptor, BLT1, is required for the induction of experimental autoimmune encephalomyelitis. Biochem. Biophys. Res. Commun. 2010;394:673–678. doi: 10.1016/j.bbrc.2010.03.049. [DOI] [PubMed] [Google Scholar]
- 11.Buczynski M.W., Dumlao D.S., Dennis E.A. Thematic review series: proteomics. An integrated omics analysis of eicosanoid biology. J. Lipid Res. 2009;50:1015–1038. doi: 10.1194/jlr.R900004-JLR200. [DOI] [PMC free article] [PubMed] [Google Scholar]
- 12.Burke J.E., Dennis E.A. Phospholipase A2 structure/function, mechanism, and signaling. J. Lipid Res. 2009;50(Suppl):S237–S242. doi: 10.1194/jlr.R800033-JLR200. [DOI] [PMC free article] [PubMed] [Google Scholar]
- 13.Smith W.L., DeWitt D.L., Garavito R.M. Cyclooxygenases: structural, cellular, and molecular biology. Annu. Rev. Biochem. 2000;69:145–182. doi: 10.1146/annurev.biochem.69.1.145. [DOI] [PubMed] [Google Scholar]
- 14.Ueno N., Murakami M., Kudo I. Coupling between cyclooxygenase, terminal prostanoid synthase, and phospholipase A2. J. Biol. Chem. 2001;276:34918–34927. doi: 10.1074/jbc.M100429200. [DOI] [PubMed] [Google Scholar]
- 15.Atarashi K., Nishimura J., Takeda K. ATP drives lamina propria T(H)17 cell differentiation. Nature. 2008;455:808–812. doi: 10.1038/nature07240. [DOI] [PubMed] [Google Scholar]
- 16.Di Virgilio F., Chiozzi P., Baricordi O.R. Nucleotide receptors: an emerging family of regulatory molecules in blood cells. Blood. 2001;97:587–600. doi: 10.1182/blood.v97.3.587. [DOI] [PubMed] [Google Scholar]
- 17.Dennis E.A., Cao J., Kokotos G. Phospholipase A2 enzymes: physical structure, biological function, disease implication, chemical inhibition, and therapeutic intervention. Chem. Rev. 2011;111:6130–6185. doi: 10.1021/cr200085w. [DOI] [PMC free article] [PubMed] [Google Scholar]
- 18.Takeda K., Kaisho T., Akira S. Toll-like receptors. Annu. Rev. Immunol. 2003;21:335–376. doi: 10.1146/annurev.immunol.21.120601.141126. [DOI] [PubMed] [Google Scholar]
- 19.Hirabayashi T., Murayama T., Shimizu T. Regulatory mechanism and physiological role of cytosolic phospholipase A2. Biol. Pharm. Bull. 2004;27:1168–1173. doi: 10.1248/bpb.27.1168. [DOI] [PubMed] [Google Scholar]
- 20.Samuelsson B., Morgenstern R., Jakobsson P.J. Membrane prostaglandin E synthase-1: a novel therapeutic target. Pharmacol. Rev. 2007;59:207–224. doi: 10.1124/pr.59.3.1. [DOI] [PubMed] [Google Scholar]
- 21.Jüni P., Nartey L., Egger M. Risk of cardiovascular events and rofecoxib: cumulative meta-analysis. Lancet. 2004;364:2021–2029. doi: 10.1016/S0140-6736(04)17514-4. [DOI] [PubMed] [Google Scholar]
- 22.Quehenberger O., Armando A.M., Dennis E.A. Lipidomics reveals a remarkable diversity of lipids in human plasma. J. Lipid Res. 2010;51:3299–3305. doi: 10.1194/jlr.M009449. [DOI] [PMC free article] [PubMed] [Google Scholar]
- 23.Dennis E.A., Deems R.A., Subramaniam S. A mouse macrophage lipidome. J. Biol. Chem. 2010;285:39976–39985. doi: 10.1074/jbc.M110.182915. [DOI] [PMC free article] [PubMed] [Google Scholar]
- 24.Subramaniam S., Fahy E., Maurya M.R. Bioinformatics and systems biology of the lipidome. Chem. Rev. 2011;111:6452–6490. doi: 10.1021/cr200295k. [DOI] [PMC free article] [PubMed] [Google Scholar]
- 25.Dumlao D.S., Buczynski M.W., Dennis E.A. High-throughput lipidomic analysis of fatty acid derived eicosanoids and n-acylethanolamines. Biochim. Biophys. Acta. 2011;1811:724–736. doi: 10.1016/j.bbalip.2011.06.005. [DOI] [PMC free article] [PubMed] [Google Scholar]
- 26.Baldi P., Long A.D. A Bayesian framework for the analysis of microarray expression data: regularized t-test and statistical inferences of gene changes. Bioinformatics. 2001;17:509–519. doi: 10.1093/bioinformatics/17.6.509. [DOI] [PubMed] [Google Scholar]
- 27.Gupta S., Maurya M.R., Subramaniam S. An integrated model of eicosanoid metabolism and signaling based on lipidomics flux analysis. Biophys. J. 2009;96:4542–4551. doi: 10.1016/j.bpj.2009.03.011. [DOI] [PMC free article] [PubMed] [Google Scholar]
- 28.Kitano H., Funahashi A., Oda K. Using process diagrams for the graphical representation of biological networks. Nat. Biotechnol. 2005;23:961–966. doi: 10.1038/nbt1111. [DOI] [PubMed] [Google Scholar]
- 29.Sabidó E., Quehenberger O., Aebersold R. Targeted proteomics of the eicosanoid biosynthetic pathway completes an integrated genomics-proteomics-metabolomics picture of cellular metabolism. Mol. Cell. Proteomics. 2012;11:014746. doi: 10.1074/mcp.M111.014746. [DOI] [PMC free article] [PubMed] [Google Scholar]
- 30.Grkovich A., Johnson C.A., Dennis E.A. Lipopolysaccharide-induced cyclooxygenase-2 expression in human U937 macrophages is phosphatidic acid phosphohydrolase-1-dependent. J. Biol. Chem. 2006;281:32978–32987. doi: 10.1074/jbc.M605935200. [DOI] [PubMed] [Google Scholar]
- 31.Gupta S., Maurya M.R., Subramaniam S. Integration of lipidomics and transcriptomics data towards a systems biology model of sphingolipid metabolism. BMC Syst. Biol. 2011;5:26. doi: 10.1186/1752-0509-5-26. [DOI] [PMC free article] [PubMed] [Google Scholar]
- 32.Buczynski M.W., Stephens D.L., Dennis E.A. TLR-4 and sustained calcium agonists synergistically produce eicosanoids independent of protein synthesis in RAW264.7 cells. J. Biol. Chem. 2007;282:22834–22847. doi: 10.1074/jbc.M701831200. [DOI] [PubMed] [Google Scholar]
- 33.Kita Y., Takahashi T., Shimizu T. Pathway-oriented profiling of lipid mediators in macrophages. Biochem. Biophys. Res. Commun. 2005;330:898–906. doi: 10.1016/j.bbrc.2005.03.055. [DOI] [PMC free article] [PubMed] [Google Scholar]
- 34.Yang K., Ma W., Lai L. Dynamic simulations on the arachidonic acid metabolic network. PLOS Comput. Biol. 2007;3:e55. doi: 10.1371/journal.pcbi.0030055. [DOI] [PMC free article] [PubMed] [Google Scholar]
- 35.Yang K., Bai H., Tang C. Finding multiple target optimal intervention in disease-related molecular network. Mol. Syst. Biol. 2008;4:228. doi: 10.1038/msb.2008.60. [DOI] [PMC free article] [PubMed] [Google Scholar]
- 36.Langenbach R., Morham S.G., Smithies O. Prostaglandin synthase 1 gene disruption in mice reduces arachidonic acid-induced inflammation and indomethacin-induced gastric ulceration. Cell. 1995;83:483–492. doi: 10.1016/0092-8674(95)90126-4. [DOI] [PubMed] [Google Scholar]
- 37.Mitchell R.A., Liao H., Bucala R. Macrophage migration inhibitory factor (MIF) sustains macrophage proinflammatory function by inhibiting p53: regulatory role in the innate immune response. Proc. Natl. Acad. Sci. USA. 2002;99:345–350. doi: 10.1073/pnas.012511599. [DOI] [PMC free article] [PubMed] [Google Scholar]
- 38.Boulet L., Ouellet M., Méthot N. Deletion of microsomal prostaglandin E2 (PGE2) synthase-1 reduces inducible and basal PGE2 production and alters the gastric prostanoid profile. J. Biol. Chem. 2004;279:23229–23237. doi: 10.1074/jbc.M400443200. [DOI] [PubMed] [Google Scholar]
- 39.Urade Y., Ujihara M., Hayaishi O. Mast cells contain spleen-type prostaglandin D synthetase. J. Biol. Chem. 1990;265:371–375. [PubMed] [Google Scholar]
- 40.Lazarus M., Kubata B.K., Hayaishi O. Biochemical characterization of mouse microsomal prostaglandin E synthase-1 and its colocalization with cyclooxygenase-2 in peritoneal macrophages. Arch. Biochem. Biophys. 2002;397:336–341. doi: 10.1006/abbi.2001.2614. [DOI] [PubMed] [Google Scholar]
- 41.Murakami M., Naraba H., Kudo I. Regulation of prostaglandin E2 biosynthesis by inducible membrane-associated prostaglandin E2 synthase that acts in concert with cyclooxygenase-2. J. Biol. Chem. 2000;275:32783–32792. doi: 10.1074/jbc.M003505200. [DOI] [PubMed] [Google Scholar]
- 42.Ueno N., Takegoshi Y., Murakami M. Coupling between cyclooxygenases and terminal prostanoid synthases. Biochem. Biophys. Res. Commun. 2005;338:70–76. doi: 10.1016/j.bbrc.2005.08.152. [DOI] [PubMed] [Google Scholar]
- 43.Matsumoto H., Naraba H., Oh-ishi S. Concordant induction of prostaglandin E2 synthase with cyclooxygenase-2 leads to preferred production of prostaglandin E2 over thromboxane and prostaglandin D2 in lipopolysaccharide-stimulated rat peritoneal macrophages. Biochem. Biophys. Res. Commun. 1997;230:110–114. doi: 10.1006/bbrc.1996.5894. [DOI] [PubMed] [Google Scholar]
- 44.Serhan C.N., Yacoubian S., Yang R. Anti-inflammatory and proresolving lipid mediators. Annu. Rev. Pathol. 2008;3:279–312. doi: 10.1146/annurev.pathmechdis.3.121806.151409. [DOI] [PMC free article] [PubMed] [Google Scholar]
- 45.Serhan C.N. Lipoxins and aspirin-triggered 15-epi-lipoxins are the first lipid mediators of endogenous anti-inflammation and resolution. Prostaglandins Leukot. Essent. Fatty Acids. 2005;73:141–162. doi: 10.1016/j.plefa.2005.05.002. [DOI] [PubMed] [Google Scholar]
Associated Data
This section collects any data citations, data availability statements, or supplementary materials included in this article.