Abstract
Electrospray ionization mass spectrometry (ESI-MS) at flow rates below ~10 nL/min has been only sporadically explored due to difficulty in reproducibly fabricating emitters that can operate at lower flow rates. Here we demonstrate narrow orifice chemically etched emitters for stable electrospray at flow rates as low as 400 pL/min. Depending on the analyte concentration, we observe two types of MS signal response as a function of flow rate. At low concentrations, an optimum flow rate is observed slightly above 1 nL/min, while the signal decreases monotonically with decreasing flow rates at higher concentrations. For example, consumption of 500 zmol of sample yielded signal-to-noise ratios ~10 for some peptides. In spite of lower MS signal, the ion utilization efficiency increases exponentially with decreasing flow rate in all cases. Significant variations in ionization efficiency were observed within this flow rate range for an equimolar mixture of peptides, indicating that ionization efficiency is an analyte-dependent characteristic for the present experimental conditions. Mass-limited samples benefit strongly from the use of low flow rates and avoiding unnecessary sample dilution. These findings have important implications for the analysis of trace biological samples.
Introduction
Early mass spectrometric measurements using electrospray ionization (ESI) established that, for a wide range of liquid flow rates, the signal depends primarily on analyte concentration and is largely independent of flow rate. In this concentration-sensitive response regime [1], the electrospray efficiency is greatest at the lowest achievable flow rate, where the smallest amount of analyte is consumed [2]. Poor ionization/desolvation efficiency at higher flow rates together with the limited ion sampling capacity of the MS inlet capillary/orifice are mainly responsible for a plateau in signal intensity despite increasing amounts of analyte delivered. A steep signal decline has been also noted at liquid flow rates close to the mL/min range [3,4], which could be alleviated to some extent by pneumatic nebulization [5].
Low-flow electrosprays were recognized [6–9] for their ability to generate gas-phase ions with high efficiency due to smaller primary droplets generated at the electrospray source. At sufficiently low liquid flow rates, depending on sample composition, the ESI-MS response becomes mass/flow-sensitive, in that the signal decreases with decreasing flow rate. Several studies show that MS signal decreases monotonically with decreasing flow rate [10–17], while others show an optimum flow rate at which MS signal reaches maximum before a steep decline at lower flow rates [18–24]. However, even with lower corresponding signal, smaller flow rates always display higher ion utilization efficiencies (the proportion of analyte molecules in solution converted to gas-phase ions) [14–18]. Minimal charge competition [24] and ionization suppression [14] effects have also been demonstrated at low flow rates.
Low-flow electrosprays can be operated in two basic scenarios, self-fed or pump-driven. The term nanoelectrospray was originally applied to self-fed electrosprays [25], but it is now commonly applied to all electrosprays in the flow range lower than a few to a few hundred nanoliters per minute. In self-fed mode, the sample-containing liquid is loaded inside the emitter capillary, and the high voltage is applied via a wire in direct contact with the liquid or a conductive emitter coating. In these conditions, the liquid flow rate is determined by the balance between the capillary forces, surface tension and electrical shear stress. This self-fed electrospray configuration allows extended analysis time even for minute amounts of liquid samples [25–28] and became part of standard modus operandi following gel electrophoresis separation of proteins [29]. Despite evident benefits, self-fed electrosprays have major drawbacks that include poor reproducibility and signal stability, as well as incompatibility with online separation techniques. MS signal variation due to electrophoretic effects is also observed as the sample is consumed [9]. In addition, the flow rate depends on both the emitter geometry and the applied voltage, making it difficult to ascertain. The flow rate dependence on geometry can be avoided by using a pump to deliver liquid to the emitter while establishing high voltage contact at a metal union or elsewhere in the flow path. Online coupling with liquid chromatographic (LC) [30–32] and electrophoretic [17,26] separations at flow rates below 20 nL/min have been demonstrated.
With both self-fed and pump-driven nanoESI, the standard mode of emitter fabrication has been to heat and pull glass or fused silica capillaries to a fine point with an opening as small as 1 μm. The process offers limited reproducibility, and the internal taper of the capillaries and narrow orifices can lead to rapid fouling or clogging of the emitters. Faultless and reproducible emitter geometry becomes increasingly stringent to operate at lower flows, which has left the exploration of flow rates below ~10–20 nL/min extremely limited [18,28]. We have developed a chemical etching process for fused silica capillary emitters that improves reproducibility and avoids the clog-prone internal taper [33]. Because the capillary walls are very thin at the orifice, a larger opening can support lower flow rates. For example, 20 μm i.d. etched emitters can support flow rates as low as 20 nL/min [34], which is not feasible using heated and pulled emitters. Narrower bore etched emitters should support even lower flow rates, but have not previously been used to explore the subnanoflow regime.
A systematic investigation of ESI below the flow rates commonly employed for nanoelectrospray is of both fundamental and practical interest. It has been hypothesized that at sufficiently low flow rate, ionization efficiency will approach 100% for all analytes in solution, thus providing maximum possible sensitivity as well as uniform response, in which all analytes of a given concentration exhibit the same signal intensity [14,24,35,36]. In addition, there is interest in ultralow flow electrosprays for their potential to improve proteomic and metabolomic analysis of trace biological samples including single cells. MS has been used to profile proteins, peptides and metabolites from single cells [37–43], but challenges in efficient sample preparation and detection sensitivity have limited most studies to large or specialized cell types. The small volume of a typical mammalian cell (a few picoliters at most) implies that even at low nanoESI flow rates, the analysis time will either be extremely brief or the extent of dilution will be very large. Sample dilution enables extended acquisition times and the signal can be averaged to improve its signal-to-noise ratio (S/N); however, the extent of dilution enabling the best overall data generation is not obvious. Exploration of the sub-nanoESI flow regime will thus inform the experimental design to address both the potentially enhanced sensitivity and improved volume compatibility with trace samples.
Here we utilize 2-μm-i.d. chemically etched emitters for reproducible electrospray operation in the largely unexplored ultra-low flow rate range extending to 400 pL/min. We demonstrate that sample dilution should be minimized in many cases for improved analytical performance. Surprisingly, uniform response was not achieved with the set of analytes (a mixture of peptides) considered in this study even at the lowest nanoESI flow rates. This set of experiments should inform not only on the optimum flow rate, but also on trace sample preparation, delivery, and analysis.
EXPERIMENTAL
Reagents
All chemicals were purchased from Sigma-Aldrich (St. Louis, MO) unless otherwise specified. Water was purified using a Barnstead Nanopure Infinity system (Dubuque, IA). A stock solution containing a 10 μM mixture of nine peptides (angiotensin I, angiotensin II, bradykinin, fibrinopeptide A, kemptide, mellitin, neurotensin, angiotensinogen, and substance P) was prepared from the corresponding 1 mg/ml stock solutions. Solutions of 1000, 300, 100, 30, 10, 3, and 1 nM were freshly prepared by successive dilution before each experiment in a 1:9 acetonitrile:water mixture with 0.1% formic acid.
Infusion
Depending on the desired flow rate range (see experimental conditions in Table 1), the solutions were loaded into 10, 25, or 100 μL syringes (Hamilton, Reno, NV) and infused by a computer-controlled syringe pump (PHD 2000; Harvard Apparatus, Holliston, MA) through a fused silica capillary (30 μm i.d., 360 μm o.d.; Polymicro Technologies, Phoenix, AZ) transfer line. In all cases, the syringe/pump combination was operated at a flow rate at least 10 times higher than the minimum recommended by the manufacturer. To establish the desired ultralow flow rates, we used metal unions and ferrules for all connections, minimized the length of the transfer line to 15 cm, and carefully eliminated air bubbles from the syringe. Before each set of measurements, the electrospray was run overnight with the flow rate set at 1 nL/min. To establish the optimum experimental conditions, the flow rate was changed in 30 minute steps of 100 pL/min down to 300 pL/min, then back to 1 nL/min. The response of the MS signal and the lack of hysteresis in these exploratory experiments suggested that the flow rates set on the syringe pump were fully established in less than 5 minutes. The bulk of measurements were conducted in the range of 1 nL/min down to 100 pL/min in 20-minute steps of 100 pL/min after overnight stabilization of the 1 nL/min flow rate. The timing was relaxed to 15 minutes at each flow rate with steps of 0.5, 1, and 10 nL/min at low, intermediate, and large flow rates, respectively (see Table 1).
Table 1.
Experimental conditions
| Flow rate | Emitter size | Syringe | Voltage | Step | ||
|---|---|---|---|---|---|---|
| description | (nL/min) | (μm) | (μL) | (V) | (nL/min) | (min) |
| ultralow | 0.3 – 1 | 2 | 10 | 1300 | 0.1 | 20 |
| low | 1 – 5 | 2 | 10 | 1400 | 0.5 | 15 |
| intermediate | 2 – 40 | 5 | 25 | 1700 | 1 | 15 |
| large | 20 – 400 | 10 | 100 | 1900 | 10 | 15 |
Mass Spectrometry
Mass spectra were acquired on an orthogonal time-of-flight MS instrument (G1969A LC/MSD TOF; Agilent Technologies, Santa Clara, CA) modified with a dual ion funnel interface[44] and multi-inlet capillary interface heated to 120 °C. Electrospray emitters with internal diameters of 2, 5, and 10 μm were fabricated by chemically etching sections of 150-μm-o.d. fused silica capillary tubing (Polymicro Technologies) as described previously [33]. The electrospray voltage was applied at the stainless steel union connecting the emitter to the transfer line.
Data analysis
MS intensity data spanning approximately 2.5 m/z units (100 data points) preceding the analyte peaks of interest was used to calculate average background levels, N̄, and standard deviations, σN. Signal-to-noise ratios were then calculated as S/N = (I − N̄)/3σN, where I stands for the intensity of the analyte peak.
RESULTS AND DISCUSSION
Operating an electrospray ion source at flow rates below those normally achieved by nanoESI was expected to lead to further gains in sensitivity; such gains in combination with new sample handling techniques will be crucial for extending ESI-MS to smaller biological samples than can be analyzed at present. Heated and pulled capillary emitters lack the process control to reproducibly operate below 10 nL/min, and self-fed electrosprays exhibit an interdependence between flow rate and applied voltage, making flow rate determination difficult. In contrast, the highly reproducible chemical etching process combined with pump-driven flow employed in this work enable the sub-nanoflow regime to be systematically characterized for the first time. Figure 1 shows a photograph of a chemically etched emitter with a 2 μm i.d. used to achieve the lowest flow rates in this study.
Figure 1.

Photo of a 2 μm i.d. chemically etched fused silica electrospray emitter similar to those used for MS measurements at low and ultralow (300 pL/min – 5 nL/min) liquid flow rates.
Several precautions were taken to ensure that the flow rate delivered to the electrospray emitter was accurate. These included always operating the syringe/pump combination at flow rates at least a factor of 10 higher than the manufacturer’s minimum recommendations, stabilizing the flow overnight at 1 nL/min, and testing for hysteresis in the MS signal while increasing and decreasing flow rates in the range of 0.3–1 nL/min. The responsiveness of the MS signal to changes in pump settings, the high degree of reproducibility, and the lack of hysteresis served to validate the approach.
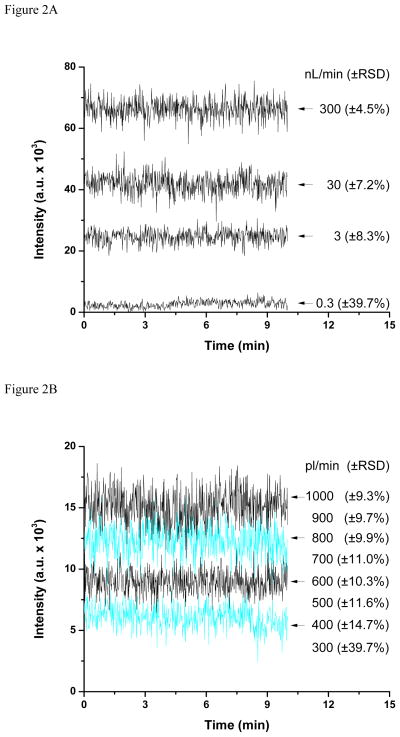
Signal stability was measured at different flow rates to determine the lowest practical flows achievable with the 2-μm-i.d. emitters. Figure 2 shows ion traces for 1 μM doubly charged fibrinopeptide (m/z = 768.85) at various flow rates. When the flow rate decreased from 300 nL/min, the signal stability decreased monotonically but maintained at an acceptable level until 300 pL/min, where the signal relative standard deviation (RSD) increased dramatically to 40%. As such, 400 pL/min was considered the lowest flow rate achievable for these emitters. The corresponding signal intensity decreased only by a factor of ~25 despite a reduction of three orders of magnitude in the amount of analyte delivered to the emitter. The higher ion utilization efficiency associated with low flow electrosprays will be discussed below.
Figure 2.
Reproducibility of fibrinopeptide signal (m/z = 768.85) for electrospray operation at 0.3 – 300 nL/min (A) and 300 – 1000 pL/min (B).
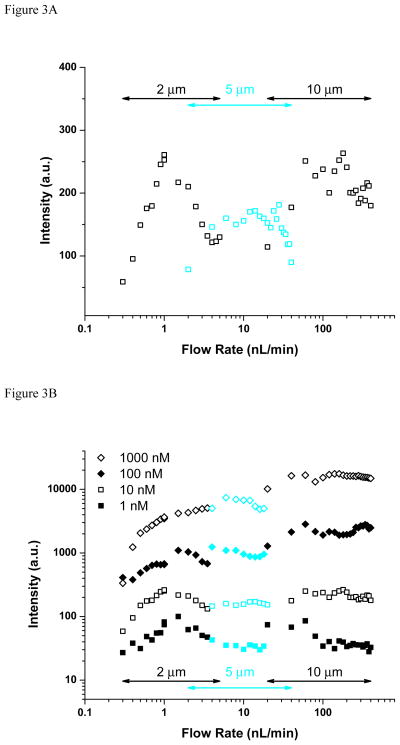
Depending on the application, ESI-MS analyses can be either concentration or mass limited. To investigate concentration-limited performance of the ultralow flow regime and compare it to more conventional analyses, an equimolar mixture of peptides was measured across a broad range of flow rates (0.3–400 nL/min) and concentrations (1–1000 nM). Figure 3A shows the two-minute-averaged signal intensity for m/z = 530.79 (bradykinin 2+ peak) measured for the 10 nM peptide mix. Emitters with 2–10 μm i.d. were selected for the different, overlapping flow ranges (see Table 1). The results show intensity optima for each emitter in the corresponding flow rate range (e.g. ~ 1, ~20, and ~200 nL/min for the 2, 5, and 10 μm emitters, respectively), which may be related to efficient and reproducible charged droplet formation. Gradual loss of electrospray stability and less efficient liquid dispersion can contribute to the drop in signal at flow rates lower and higher than optimum, respectively. The data points corresponding to sub-optimal performance were eliminated from the subsequent plots for clarity.
Figure 3.
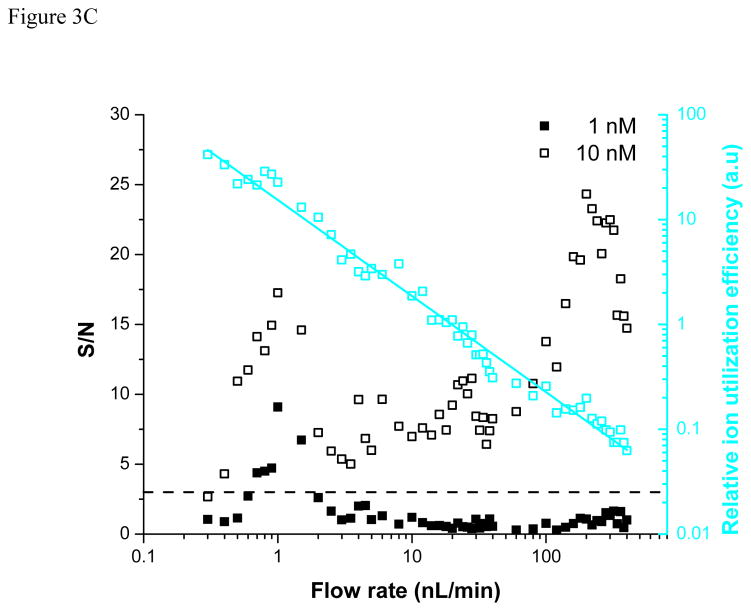
Effect of liquid flow rate and analyte concentration on analyte signal (A, B) and signal-to-noise ratio (C) for bradykinin (m/z = 530.78). The ion utilization efficiency (cyan plot in panel C) grows exponentially with decreasing flow rate.
Figure 3B includes similar results for the 1, 10, 100, and 1000 nM peptide mix solutions. The signal was found to decrease monotonically with the flow rate for the highest concentration mixtures while a maximum in signal intensity is observed at ~ 1 nL/min for lower concentrations. Both trends have been observed previously [10–24], but the dependence on concentration had not been identified. The optimum seems to be related to striking the right balance between the flow rate ensuring the most favorable ionization/desolvation conditions (lower flow rates) and that providing sufficient analyte for analysis (larger flow rates). This optimum may change slightly when using liquids exhibiting different physical properties (volatility, surface tension, viscosity, etc.). Importantly, for the lowest concentration studied (1 nM), the only detectable signal was observed around 1 nL/min, while higher S/N are obtained at increased flow rates at larger concentrations (Figure 3C). The relative ion utilization efficiency (also included in Figure 3C for 10 nM bradykinin), was calculated by normalizing the S/N with the flow rate and shows an exponential growth with decreasing flow rate. The results in Figure 3 imply that for analyses that are concentration limited but not limited in terms of available mass, typical “nanospray” flow rates are often sufficient and the greater efforts to operate at ultralow flow rates may not be justified.
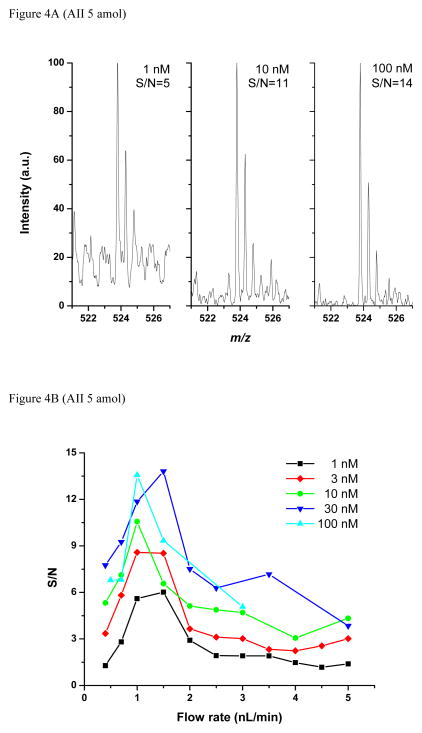
In the case of mass-limited studies, the use of ultralow flow rates are expected to become increasingly important. Mass-limited analyses are common for biological systems and can arise from the scarcity of material (e.g., circulating tumor cells or cancer stem cells) or the heterogeneity of the system that would be unresolved if a larger sample were required (providing motivation for, e.g., laser-capture microdissection and single cell analyses). Besides optimizing the flow rate, a mass-limited sample could potentially be delivered to the emitter as a low volume, concentrated plug (e.g. from an on-line CZE separation), or as a more dilute, larger volume allowing for proportionately more signal averaging. To determine the conditions providing the highest signal-to-noise with a given mass, we adjusted the number of averaged spectra at different flow rates and concentrations to maintain constant the amount of sample consumed. Figure 4A compares the m/z = 521–527 region of the MS spectra corresponding to consumption of 5 amol angiotensin II as a function of analyte concentration. For example, 3 spectra were averaged for the 100 nM sample delivered at 1 nL/min, resulting in a S/N of 14. Similarly, 30 and 300 spectra were averaged for the 10 and 1 nM “diluted” samples, resulting in S/N ratios of 11 and 5, respectively. The trend of decreasing S/N ratio with decreasing concentration arises in part because much of the background is chemical in nature, arising e.g. from the solvent, which does not decrease substantially with additional averaging, and suggesting that sample dilution should be avoided for such modestly dilute samples.
Figure 4.
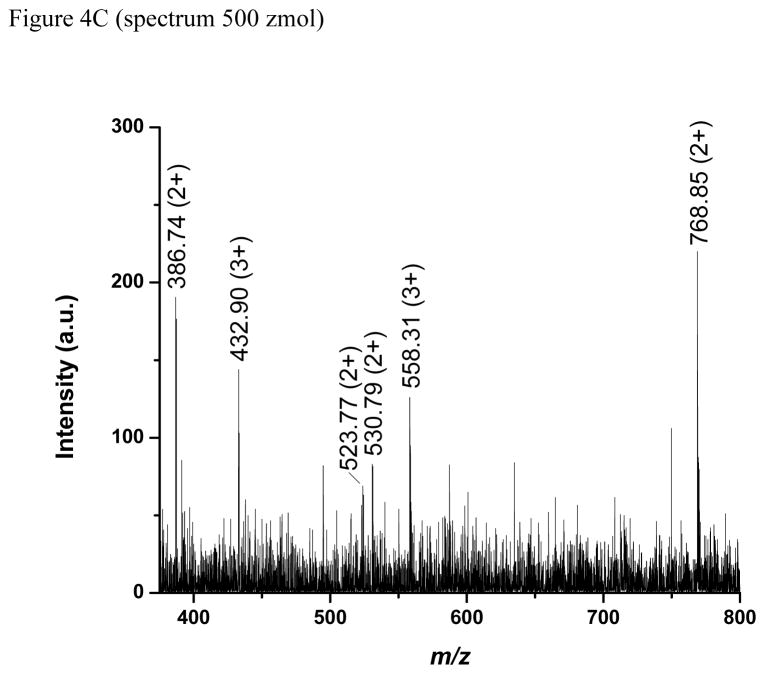
Mass spectra (A, C) and signal-to-noise ratios (B) for experiments consuming the same amount of analyte: 5 amol (A, B) and 500 zmol (C). See text for details.
Figure 4B compiles the S/N ratios for the analysis of 5 amol total amount of angiotensin II at several flow rates and concentrations. Each data point is the average of three S/N ratios calculated as described above. The S/N generally improves with increasing concentration and shows an optimum at flow rates between 1 and 1.5 nL/min. These results suggest that operating at ~1 nL/min while avoiding unnecessary sample dilution is optimum for this case. Pushing to even smaller amounts of consumed analyte, a mass spectrum corresponding to just ~500 zmol of each peptide (an average of 7 spectra measured for the 3 nM peptide mix solution delivered at 1.5 nL/min) is presented in Figure 4C. Most peptides in the mix were detected with signal between the detection level (S/N = 3) and the quantitation level (S/N = 10), while substance P, mellitin and angiotensinogen were not detected. It is important to note that this comparative study to determine optimum conditions used an older instrument and was not designed to provide the greatest absolute sensitivity. Still, the subattomole detection limits shown here are among the lowest reported to date.
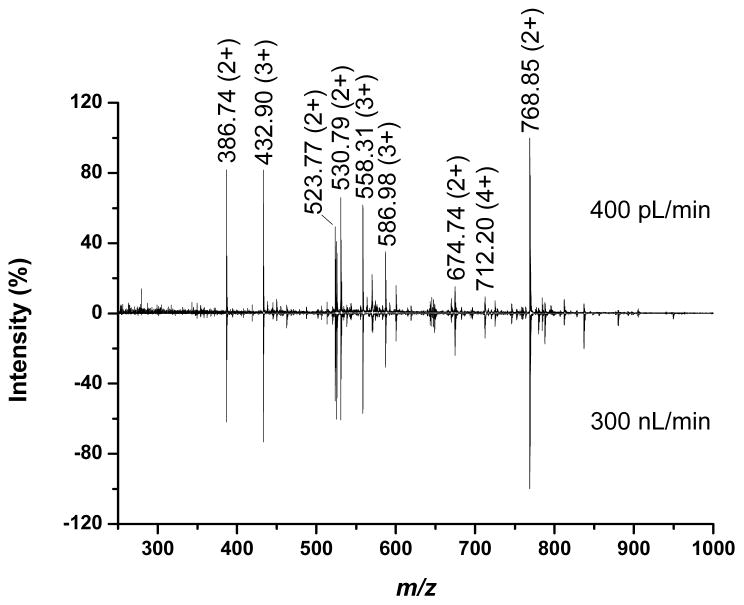
Besides improved ion utilization efficiency, nanoelectrospray has been shown to improve quantitation by reducing ion suppression and matrix effects. Indeed, several studies [14,24,35,36] identified a trend toward uniform response with decreasing liquid flow rates in which all analytes are ionized with nearly 100% efficiency and equal concentration analytes might be expected to display similar signal intensities. It was hypothesized that insufficiently low flow rates in the studies were responsible for deviation from uniform response. Thus, we might expect to observe a change in relative intensities trending toward uniform response with decreasing flow rate, but found instead that they were strikingly similar across nearly 3 orders of magnitude change in flow rate. Figure 5 compares spectra measured at 400 pL/min (top) and 300 nL/min (bottom) with the major peaks for each of the nine peptides indicated by mass labels. In both cases, the most intense peak was that corresponding to fibrinopeptide (m/z = 768.85), while the least intense peak was that corresponding to mellitin (m/z = 712.20). It should be noted that all the analytes considered in the current study were peptides whereas the previous studies [14,24,35,36] demonstrating uniform response at decreased flow rates included analytes from different classes of compounds. For example, mixtures of peptides and saccharides have been employed to emphasize the advantage of working at low flow rates.[14,36] At large flow rates, the saccharide molecules ionize poorly due to their hydrophilicity that favors distribution inside the charged droplets rather than at the surface [45], displaying less intense analyte peaks than the peptide. For electrosprays operated at decreasing flow rates, the saccharide ionization efficiency can improve more significantly than that of peptides, to the point where uniform response was evident. However, the present results suggest that the ionization efficiency is analyte dependent and a trend toward uniform response with decreasing flow rate is not universal.
Figure 5.
Mass spectra measured at 400 pL/min (top) and 300 nL/min (bottom) suggesting no trend toward uniform response with decreasing flow rate.
CONCLUSIONS
We explored electrospray ionization in the sub-nanoflow regime extending to 400 pL/min. In comparison with flow rates as high as 400 nL/min, there was no indication of analyte suppression effects or charge competition evident between the selected peptide analytes included in this study. The ionization efficiency of peptides appeared analyte-dependent; uniform response (i.e. same signal at identical concentration) was not achieved even at the lowest flow rates. The etched fused-silica emitters could generally handle flow rates much smaller than those suggested in the literature for similar dimension emitters. By working under optimized conditions, S/N ~10 could be obtained for some analytes with ~500 zmol consumed. While the flow rates explored here are below those currently employed for chemical separations (e.g. capillary LC), the benefits of lower flow rates can be extended to higher rates separations by using electrospray emitter arrays [46] or for CZE separations in very narrow bore columns with sheathless interface designs.
Acknowledgments
We thank William F. Danielson for writing the syringe pump control software and Sarah Rausch, Allison Sheen, and Levi Broeske for assistance with data processing. This research was supported by the William R. Wiley Environmental Molecular Sciences Laboratory (EMSL) intramural program and grants from National Institutes of Health: the National Institute of General Medical Sciences (Grant 8 P41 GM103493-10) and the National Cancer Institute (1R33CA155252). The EMSL is a national scientific user facility sponsored by US DOE’s Office of Biological and Environmental Research and located at the Pacific Northwest National Laboratory (PNNL) in Richland, WA. PNNL is a multiprogram national laboratory operated by Battelle for the DOE under Contract No. DE-AC05-76RLO 1830.
References
- 1.Hopfgartner G, Bean K, Henion J, Henry R. Ion-spray mass-spectrometric detection for liquid chromatography - A concentration-flow-sensitive or a mass-flow-sensitive device. Journal of Chromatography. 1993;647:51–61. [Google Scholar]
- 2.Davis MT, Stahl DC, Hefta SA, Lee TD. A microscale electrospray interface for online, capillary liquid-chromatography tandem mass-spectrometry of complex peptide mixtures. Anal Chem. 1995;67:4549–4556. doi: 10.1021/ac00120a019. [DOI] [PubMed] [Google Scholar]
- 3.Ikonomou MG, Blades AT, Kebarle P. Electrospray ion spray - a comparison of mechanisms and performance. Anal Chem. 1991;63:1989–1998. [Google Scholar]
- 4.Kostiainen R, Bruins AP. Effect of multiple sprayers on dynamic-range and flow-rate limitations in electrospray and ionspray mass-spectrometry. Rapid Commun Mass Spectrom. 1994;8:549–558. [Google Scholar]
- 5.Hopfgartner G, Wachs T, Bean K, Henion J. High-flow ion spray liquid-chromatography mass-spectrometry. Anal Chem. 1993;65:439–446. [Google Scholar]
- 6.Wahl JH, Goodlett DR, Udseth HR, Smith RD. Attomole level capillary electrophoresis mass-spectrometric protein-analysis using 5-um-ID capillaries. Anal Chem. 1992;64:3194–3196. [Google Scholar]
- 7.Gale DC, Smith RD. Small-volume and low flow-rate electrospray-ionization mass-spectrometry of aqueous samples. Rapid Commun Mass Spectrom. 1993;7:1017–1021. [Google Scholar]
- 8.Emmett MR, Caprioli RM. Micro-electrospray mass-spectrometry - Ultra-high-sensitivity analysis of peptides and proteins. J Am Soc Mass Spectrom. 1994;5:605–613. doi: 10.1016/1044-0305(94)85001-1. [DOI] [PubMed] [Google Scholar]
- 9.Wilm MS, Mann M. Electrospray and Taylor-cone theory, Dole’s beam of macromolecules at last. Int J Mass Spectrom Ion Process. 1994;136:167–180. [Google Scholar]
- 10.Bateman KP, White RL, Thibault P. Disposable emitters for on-line capillary zone electrophoresis nanoelectrospray mass spectrometry. Rapid Commun Mass Spectrom. 1997;11:307–315. [Google Scholar]
- 11.Oosterkamp AJ, Gelpi E, Abian J. Quantitative peptide bioanalysis using column-switching nano liquid chromatography mass spectrometry. J Mass Spectrom. 1998;33:976–983. doi: 10.1002/(SICI)1096-9888(1998100)33:10<976::AID-JMS710>3.0.CO;2-7. [DOI] [PubMed] [Google Scholar]
- 12.Chang YZ, Chen YR, Her GR. Sheathless capillary electrophoresis/electrospray mass spectrometry using a carbon-coated tapered fused-silica capillary with a beveled edge. Anal Chem. 2001;73:5083–5087. doi: 10.1021/ac010429o. [DOI] [PubMed] [Google Scholar]
- 13.Chen YR, Tseng MC, Her GR. Design and performance of a low-flow capillary electrophoresis-electrospray-mass spectrometry interface using an emitter with dual beveled edge. Electrophoresis. 2005;26:1376–1382. doi: 10.1002/elps.200410159. [DOI] [PubMed] [Google Scholar]
- 14.Schmidt A, Karas M, Dulcks T. Effect of different solution flow rates on analyte ion signals in nano-ESI MS, or: When does ESI turn into nano-ESI? J Am Soc Mass Spectrom. 2003;14:492–500. doi: 10.1016/S1044-0305(03)00128-4. [DOI] [PubMed] [Google Scholar]
- 15.Tang XT, Bruce JE, Hill HH. Characterizing Electrospray ionization using atmospheric pressure ion mobility spectrometry. Anal Chem. 2006;78:7751–7760. doi: 10.1021/ac0613380. [DOI] [PMC free article] [PubMed] [Google Scholar]
- 16.Marginean I, Kelly RT, Prior DC, LaMarche BL, Tang KQ, Smith RD. Analytical characterization of the electrospray ion source in the nanoflow regime. Anal Chem. 2008;80:6573–6579. doi: 10.1021/ac800683s. [DOI] [PMC free article] [PubMed] [Google Scholar]
- 17.Heemskerk AAM, Busnel JM, Schoenmaker B, Derks RJE, Klychnikov O, Hensbergen PJ, Deelder AM, Mayboroda OA. Ultra-Low Flow Electrospray Ionization-Mass Spectrometry for Improved Ionization Efficiency in Phosphoproteomics. Anal Chem. 2012;84:4552–4559. doi: 10.1021/ac300641x. [DOI] [PubMed] [Google Scholar]
- 18.Geromanos S, Freckleton G, Tempst P. Tuning of an electrospray ionization source for maximum peptide-ion transmission into a mass spectrometer. Anal Chem. 2000;72:777–790. doi: 10.1021/ac991071n. [DOI] [PubMed] [Google Scholar]
- 19.Gucek M, Vreeken RJ, Verheij ER. Coupling of capillary zone electrophoresis to mass spectrometry (MS and MS/MS) via a nanoelectrospray interface for the characterisation of some beta-agonists. Rapid Commun Mass Spectrom. 1999;13:612–619. [Google Scholar]
- 20.Bendahl L, Hansen SH, Olsen J. A new sheathless electrospray interface for coupling of capillary electrophoresis to ion-trap mass spectrometry. Rapid Commun Mass Spectrom. 2002;16:2333–2340. doi: 10.1002/rcm.865. [DOI] [PubMed] [Google Scholar]
- 21.Ishihama Y, Katayama H, Asakawa N, Oda Y. Highly robust stainless steel tips as micro electro spray emitters. Rapid Commun Mass Spectrom. 2002;16:913–918. doi: 10.1002/rcm.647. [DOI] [PubMed] [Google Scholar]
- 22.Chen YR, Her GR. A simple method for fabrication of silver-coated sheathless electrospray emitters. Rapid Commun Mass Spectrom. 2003;17:437–441. doi: 10.1002/rcm.940. [DOI] [PubMed] [Google Scholar]
- 23.Tseng MC, Chen YR, Her GR. A beveled tip sheath liquid interface for capillary electrophoresis-electrospray ionization-mass spectrometry. Electrophoresis. 2004;25:2084–2089. doi: 10.1002/elps.200305907. [DOI] [PubMed] [Google Scholar]
- 24.Tang KQ, Page JS, Smith RD. Charge competition and the linear dynamic range of detection in electrospray ionization mass spectrometry. J Am Soc Mass Spectrom. 2004;15:1416–1423. doi: 10.1016/j.jasms.2004.04.034. [DOI] [PMC free article] [PubMed] [Google Scholar]
- 25.Wilm M, Mann M. Analytical properties of the nanoelectrospray ion source. Anal Chem. 1996;68:1–8. doi: 10.1021/ac9509519. [DOI] [PubMed] [Google Scholar]
- 26.Valaskovic GA, Kelleher NL, McLafferty FW. Attomole protein characterization by capillary electrophoresis mass spectrometry. Science. 1996;273:1199–1202. doi: 10.1126/science.273.5279.1199. [DOI] [PubMed] [Google Scholar]
- 27.Bahr U, Pfenninger A, Karas M, Stahl B. High sensitivity analysis of neutral underivatized oligosaccharides by nanoelectrospray mass spectrometry. Anal Chem. 1997;69:4530–4535. doi: 10.1021/ac970624w. [DOI] [PubMed] [Google Scholar]
- 28.El-Faramawy A, Siu KWM, Thomson BA. Efficiency of nano-electrospray ionization. J Am Soc Mass Spectrom. 2005;16:1702–1707. doi: 10.1016/j.jasms.2005.06.011. [DOI] [PubMed] [Google Scholar]
- 29.Wilm M, Shevchenko A, Houthaeve T, Breit S, Schweigerer L, Fotsis T, Mann M. Femtomole sequencing of proteins from polyacrylamide gels by nano-electrospray mass spectrometry. Nature. 1996;379:466–469. doi: 10.1038/379466a0. [DOI] [PubMed] [Google Scholar]
- 30.Shen YF, Zhao R, Berger SJ, Anderson GA, Rodriguez N, Smith RD. High-efficiency nanoscale liquid chromatography coupled on-line with mass spectrometry using nanoelectrospray ionization for proteomics. Anal Chem. 2002;74:4235–4249. doi: 10.1021/ac0202280. [DOI] [PubMed] [Google Scholar]
- 31.Chang YW, Zhao CX, Wu ZM, Zhou J, Zhao SM, Lu X, Xu GW. Chip-based nanoflow high performance liquid chromatography coupled to mass spectrometry for profiling of soybean flavonoids. Electrophoresis. 2012;33:2399–2406. doi: 10.1002/elps.201100581. [DOI] [PubMed] [Google Scholar]
- 32.Zhou F, Lu Y, Ficarro SB, Webber JT, Marto JA. Nanoflow Low Pressure High Peak Capacity Single Dimension LC-MS/MS Platform for High-Throughput, In-Depth Analysis of Mammalian Proteomes. Anal Chem. 2012;84:5133–5139. doi: 10.1021/ac2031404. [DOI] [PMC free article] [PubMed] [Google Scholar]
- 33.Kelly RT, Page JS, Luo QZ, Moore RJ, Orton DJ, Tang KQ, Smith RD. Chemically etched open tubular and monolithic emitters for nanoelectrospray ionization mass spectrometry. Anal Chem. 2006;78:7796–7801. doi: 10.1021/ac061133r. [DOI] [PMC free article] [PubMed] [Google Scholar]
- 34.Marginean I, Kelly RT, Page JS, Tang KQ, Smith RD. Electrospray characteristic curves: In pursuit of improved performance in the nanoflow regime. Anal Chem. 2007;79:8030–8036. doi: 10.1021/ac0707986. [DOI] [PMC free article] [PubMed] [Google Scholar]
- 35.Valaskovic GA, Utley L, Lee MS, Wu JT. Ultra-low flow nanospray for the normalization of conventional liquid chromatography/mass spectrometry through equimolar response: standard-free quantitative estimation of metabolite levels in drug discovery. Rapid Commun Mass Spectrom. 2006;20:1087–1096. doi: 10.1002/rcm.2414. [DOI] [PubMed] [Google Scholar]
- 36.Kelly RT, Page JS, Tang KQ, Smith RD. Array of chemically etched fused-silica emitters for improving the sensitivity and quantitation of electrospray ionization mass spectrometry. Anal Chem. 2007;79:4192–4198. doi: 10.1021/ac062417e. [DOI] [PubMed] [Google Scholar]
- 37.Mizuno H, Tsuyama N, Harada T, Masujima T. Live single-cell video-mass spectrometry for cellular and subcellular molecular detection and cell classification. J Mass Spectrom. 2008;43:1692–1700. doi: 10.1002/jms.1460. [DOI] [PubMed] [Google Scholar]
- 38.Mellors JS, Jorabchi K, Smith LM, Ramsey JM. Integrated Microfluidic Device for Automated Single Cell Analysis Using Electrophoretic Separation and Electrospray Ionization Mass Spectrometry. Anal Chem. 2010;82:967–973. doi: 10.1021/ac902218y. [DOI] [PMC free article] [PubMed] [Google Scholar]
- 39.Nemes P, Knolhoff AM, Rubakhin SS, Sweedler JV. Metabolic Differentiation of Neuronal Phenotypes by Single-cell Capillary Electrophoresis-Electrospray Ionization-Mass Spectrometry. Anal Chem. 2011;83:6810–6817. doi: 10.1021/ac2015855. [DOI] [PMC free article] [PubMed] [Google Scholar]
- 40.Rubakhin SS, Romanova EV, Nemes P, Sweedler JV. Profiling metabolites and peptides in single cells. Nature Methods. 2011;8:S20–S29. doi: 10.1038/nmeth.1549. [DOI] [PMC free article] [PubMed] [Google Scholar]
- 41.Shrestha B, Patt JM, Vertes A. In Situ Cell-by-Cell Imaging and Analysis of Small Cell Populations by Mass Spectrometry. Anal Chem. 2011;83:2947–2955. doi: 10.1021/ac102958x. [DOI] [PubMed] [Google Scholar]
- 42.Stolee JA, Shrestha B, Mengistu G, Vertes A. Observation of Subcellular Metabolite Gradients in Single Cells by Laser Ablation Electrospray Ionization Mass Spectrometry. Angew Chem-Int Edit. 2012;51:10386–10389. doi: 10.1002/anie.201205436. [DOI] [PubMed] [Google Scholar]
- 43.Walker BN, Stolee JA, Vertes A. Nanophotonic Ionization for Ultratrace and Single-Cell Analysis by Mass Spectrometry. Anal Chem. 2012;84:7756–7762. doi: 10.1021/ac301238k. [DOI] [PubMed] [Google Scholar]
- 44.Kelly RT, Tolmachev AV, Page JS, Tang KQ, Smith RD. The ion funnel: theory, implementations, and applications. Mass Spectrom Rev. 2010;28:294–312. doi: 10.1002/mas.20232. [DOI] [PMC free article] [PubMed] [Google Scholar]
- 45.Enke CG. A predictive model for matrix and analyte effects in electrospray ionization of singly-charged ionic analytes. Anal Chem. 1997;69:4885–4893. doi: 10.1021/ac970095w. [DOI] [PubMed] [Google Scholar]
- 46.Kelly RT, Page JS, Zhao R, Qian WJ, Mottaz HM, Tang KQ, Smith RD. Capillary-based multi nanoelectrospray emitters: Improvements in ion transmission efficiency and implementation with capillary reversed-phase LC-ESI-MS. Anal Chem. 2008;80:143–149. doi: 10.1021/ac701647s. [DOI] [PMC free article] [PubMed] [Google Scholar]


