Abstract
The purpose of this study was the qualitative and quantitative analysis of flavonoids from Robinia pseudoacacia using two different techniques of analysis: Thin Layer Chromatography (TLC) and TLC coupled with photo-densitometry. The results obtained by chromatographic analysis showed a higher concentration of flavonoids in flowers than in leaves. The flowers harvested in the plains have a higher concentration of hyperoside (0.9 mg/mL) compared with the flowers collected from the hills (0.54 mg/mL). The leaves are richer in ruthoside (0.98 mg/mL) compared with the flowers.
Keywords: TLC, TLC-photodensimetry, flavonoids, Robinia pseudoacacia
Introduction
Robinia pseudoacacia (Black locust) is the main honey-bearing tree that grows spontaneously in Romania, especially in the plains and hills. It is native to North America. In Romanian ethno-pharmacology only flowers are used for their alkalizing, antispasmodics, anti-tussives, sedatives effect, other parts of the plant especially bark and seeds are toxic [1-3].
Flavonoids with phenyl-propane compounds and tannins are part of complex category of polyphenols [4]. They are a valuable group of plant origin compounds of great interest in phytotherapy and pharmacology [5, 6]. In the chemical composition of Robinia pseudoacacia L. species have been cited in the literature the presence of the following flavonoids: robinin (kaempferol-3-O-ramnozil-galactozil-7-ramnozid) and acacetin-7-O-rutosid, apigenin, diosmetin, luteolin but also secundiflorol, mucronulatol, isomucronulatol and isovestitol [7]. Our previous studies on the chemical composition revealed the presence of several bioactive compounds such as phytosterols, which are present in the flowers, and other lipidic compounds as those from the seeds of sunflower [8, 9].
The purpose of this study was the qualitative and quantitative analysis of the flavonoids in different plant parts specifically in flowers, leaves, bark and seeds of Robinia pseudoacacia using thin layer chromatography coupled with photo-densitometry. This is a simple and rapid method, applied for separation, identification and quantitative determination of chemical compounds with the main advantage that allows the possibility to investigate one or more components without their previous isolation and purification [10,11].
Matherial and Method
Plant material
Herbal product was harvested in May- June (flowers, leaves) and October (seeds and bark) from two different geographical areas: plain (Craiova, Dolj county) and Hill (Râmnicu Vâlcea, Vâlcea County). Herbal product was drying immediately after harvest at ambient temperature and then it was sprayed.
Extract preparation
Methanolic flowers extracts: 1 g powdered herbal material was wetted with 5 mL methanol. After 2-3 minutes was added 10 mL methanol and stirring at approx. 1000 rpm at 50° for 30 minutes. After cooling, herbal material was filtered and the filter and herbal material was washed with methanol up to 10 mL extract.
Methanolic leave, bark and seed extracts were prepared similarly to flowers extracts. Extracts were noted as follows: R1 - Robinia pseudoacacia seeds extracts from plain area (Craiova), R2 - Robinia pseudoacacia seeds extracts from hill area (Râmnicu Vâlcea), R3 - Robinia pseudoacacia flowers extracts from plain area (Craiova), R4 - Robinia pseudoacacia flowers extracts from hill area (Râmnicu Vâlcea), R5 - Robinia pseudoacacia leaves extract from the plain area (Craiova), R6 - Robinia pseudoacacia bark extract from plain area (Craiova).
Thin layer chromatography (TLC)
was performed under the following conditions: stationary phase: silica gel G60 F254-precoated TLC plates (Merck); mobile phase: ethyl acetate–ethylmethyl ketone–formic acid–water (50:30:10:10, in volumes); solution to analyze: 20% methanolic extractive solutions from the different parts of Robinia pseudoacacia (R1- R6); standard solutions: ruthoside 1,22 mg/mL (Roth) and hyperoside 1,1 mg/mL (Merck; Darmstadt, Germany) methanol solutions; stationary phase: silica gel G60 F254-precoated TLC plates (Merck); mobile phase: ethyl acetate–ethylmethyl ketone–formic acid–water (50:30:10:10, in volumes); about 5–10 µL of the sample and reference compounds have been applied on the plate as 10 mm bands; migration distance: 15 cm; migration time: 40 min; detection: UV light (254 nm) and natural products reagent (NP/PEG), in fluorescence.
For flavonoid compounds when using the two revealing reagents, we obtained yellow, yellow – green and yellow – orange spots.
TLC coupled with photo-densitometry
The thin layer chromatography has been accomplished by using the above mentioned experimental conditions. In TLC coupled with photo- densitometry, the chromatographic plate was scanned with a Desaga CD60 photo- densitometer scanner after spraying with iron chloride (anisaldehyde). The photo - densitometer parameters: in reflection mode, deuterium lamp, λ = 254 nm, minimum area read: 100. "In situ" UV-VIS spectra for the main flavonoids were obtained using the photo-densitometer. Device parameters are: deuterium and tungsten lamp, wavelength 254 nm, wavelength interval for UV–VIS spectra in situ 200–500 nm, slit width 0.2 mm, repetition four times/position.
Results and Discussion
Flavonoids are a class of compounds which possess high antioxidant properties [12]. Flavonoid spots appear at λ 254 nm in UV light as dark spots [13] and after the revelation with NP / PEG reagent acquire yellow-green fluorescence.
By comparing the Rf – sized, color and intensity of spots was possible to identify the following components: hyperoside and acacetin-7-O-ruthoside (Figure 1). The other components separate on chromatographic plate could not be identified if they belong to flavonoids class. The results led to the identification of flavonoids in flowers (R3, R4) and leaves (R5), less in bark (R6). Their absence was observed in the seeds (R1, R2). Separation of ruthoside and hyperoside was made at the following Rf values: 0.13, respectively 0.35. The Rf values obtained are presented in Table 1.
Fig.1.
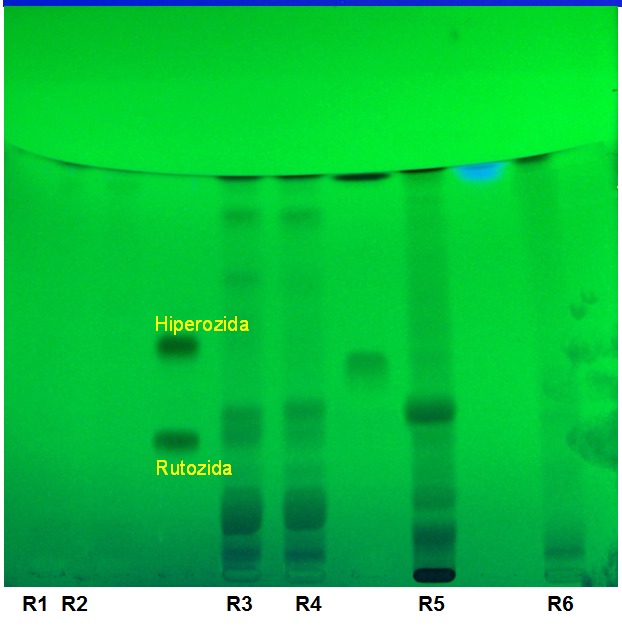
TLC-chromatogram in UV (254 nm) for the samples of Robinia pseudoacacia (R1-R6) and for the standard solutions (hyperoside, ruthoside)
Table 1.
Rf values for the analyzed flavonosides and for the reference compounds
| Standards | Rf values | |
| hyperoside 0,13 |
ruthoside 0,35 |
|
| Samples | Rf values | |
| R1 | - | - |
| R2 | - | - |
| R3 | 0,32 | 0,36 |
| R4 | 0,33 | 0,38 |
| R5 | 0,15 | 0,36 |
| R6 | - | - |
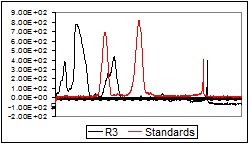
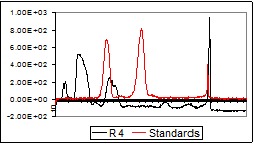
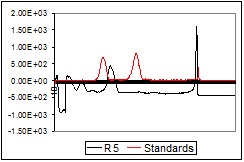
After the photo-densitographic evaluation was made, some densitograms showed the presence of flavonoids in different concentrations. Figure 2 (a-d) contains the overlapped TLC-densitograms for the Robinia pseudoacacia methanolic extracts from flowers (R3, R4), leaves (R5) and bark (R6) with the standards (UV 254 nm). The analysis of methanolic flowers extracts revealed that the flowers collected from the plain area have higher flavonoid content than those harvested from the hill.
Fig.2.
TLC-densitograms in UV (254 nm) for the samples of different parts of Robinia pseudoacacia: a – R3, b – R4, c – R5, d – R6
a.
b.
c.
d.
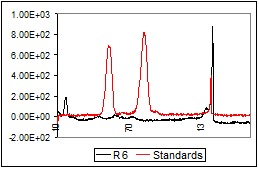
In Figure 3 are presented the overlapped densitograms of methanolic extracts from flowers, leaves, bark and seeds of Robinia pseudoacacia.
Fig.3.
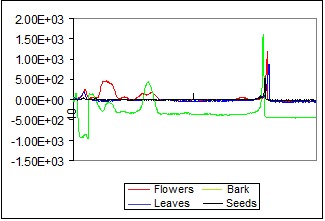
The densitograms of flower, leaves, bark and seeds extracts of Robinia pseudoacacia
From overlapping densitograms of the four vegetative organs of the plant it was found that flavonoids are mainly present in flowers and leaves, but in bark and seeds are in insignificant amounts.
For quantitative determinations, five points calibration curves were built, under the same chromatographic and densitometric conditions. We obtained equations with good correlation coefficients. In Table 2 the data of the calibration curve for ruthoside are shown.
Table 2.
The data for the calibration curve, expressed in ruthoside
| Concentration (mg/mL) |
Found concentration (mg/mL) |
Area | Acuracy (%) |
| 0.091089 | 0.1 | 371.5 | 91.08937 |
| 0.149145 | 0.15 | 585.1 | 99.43031 |
| 0.301896 | 0.3 | 1147.1 | 100.632 |
| 0.61498 | 0.6 | 2299 | 102.4967 |
| 1.192878 | 1.2 | 4425.2 | 99.40648 |
Coefficient X = 3679.2
Intercept = + 36.364
Correlation coefficient R2 = 0.9996
Average = 98.61098 %
Standard deviation (SD) =4.389263
With DESAGA CD60 photo-densitometer was performed UV-VIS spectra on 200-500 nm for ruthoside and hyperoside. Maxima of absorption were at 260 respectively 350 nm for hyperoside, and at 210, 320 respectively 410 nm for ruthoside.
After analyzing the results we could determinate that flavonoids from flowers and leaves of Robinia pseudoacacia have similar structures with hyperoside and ruthoside.
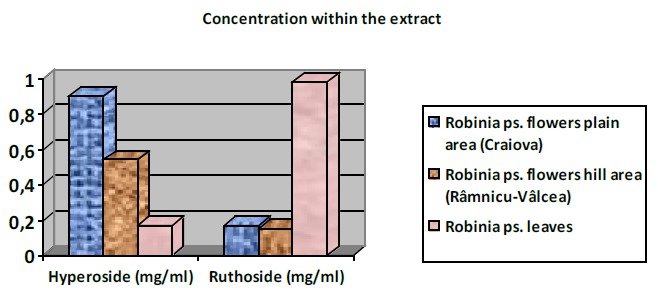
The results showed a higher concentration of flavonoids in flowers than in leaves. It is known that flowers are consumed in various foods so Robinia pseudoacacia may become a valuable source of antioxidants in human nutrition. The flowers have the highest content of flavonoids, ranging from 0.15 to 0.9 mg / ml. The flowers harvested in the plains have a higher concentration of hyperoside (0.9 mg / ml) compared with the flowers taken from the hill (0.54 mg / ml). The leaves are rich in ruthoside (0.98 mg / ml) compared with the flowers (Table 3). In the seeds and bark are insignificant amounts of flavonoids. The results are comparable to other results in the literature for other herbs [14].
Table 3.
Concentration of hyperoside and ruthoside within the analyzed extracts
| Samples | Area | Methanolic extract (mg/ml) | ||
| hyperoside | ruthoside | hyperoside | ruthoside | |
|
Robinia ps.
plain area (Craiova) |
3363,5 | 676,9 | 0,9 | 0,17 |
|
Robinia ps. flowers, hill area (Râmnicu-Vâlcea) |
2033,3 | 598,0 | 0,54 | 0,15 |
| Robinia ps. leaves | 652,9 | 3626,8 | 0,17 | 0,98 |
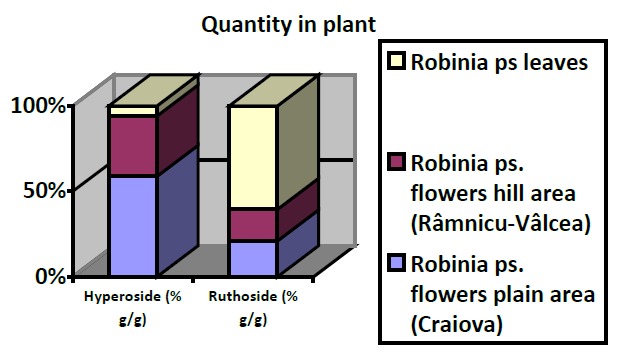
In Figure 4 (a, b) is shown the variation of flavonosids concentrations in the studied samples and quantity in plant.
Fig.4.
The variation of hyperoside and ruthoside concentration: a - in methanolic extracts, b - in plant
a.
b.
Conclusions
The qualitative and quantitative analysis of flavonoids compounds was made using two chromatographic methods: Thin Layer Chromatography (TLC) and TLC coupled with photo-densitometry. It was investigated the presence of hyperoside and ruthoside in methanolic extracts obtained from different parts of the plant: flowers from plains and hill area, leaves, seeds and bark. The identification was made by comparing the spots Rf values with the Rf values for ruthoside and hyperoside. TLC coupled with photo-densitometry allowed the quantitative determination of hyperoside and rutoside. This concentration varies with the analyzed plant part. Thus, we conclude that the methods of analysis used demonstrates that Robinia pseudoacacia flowers and leaves have the highest concentration of flavonoids, compounds with pharmacological benefic potential (heard protective, reducing low-density lipoproteins, anti-ulcerous and liver protective, antimicrobial) and relatively low toxicity.
References
- 1.Bojor O, Popescu O. Traditional and modern phytotherapy. Bucharest: Fiat Lux Publishing house; 2003. pp. 208–213. [Google Scholar]
- 2.Nan M, Vlase L, Eşianu S, Tămaş M. The Analysis of Flavonoids from Inula helenium L. flowers and leaves. Acta Medica Marisiensis. 2011;57(4):319–323. [Google Scholar]
- 3.Pârvu C. Plant universe - Minor encyclopedia. III. Bucharest: Enciclopedic Publishing House; pp. 169–180. [Google Scholar]
- 4.Havsteen B. Flavonoids, a class of natural products of high pharmacological potency. Biochem Pharmacol. 1983;7:1141–1148. doi: 10.1016/0006-2952(83)90262-9. [DOI] [PubMed] [Google Scholar]
- 5.Ghasemzadeh A, Ghasemzadeh N. Flavonoids and phenolic acids: Role and biochemical activity in plants and human. J. Med. Plants Res. 2011;5(31):6697–6703. [Google Scholar]
- 6.Saddiqe Z, Naeem I, Maimoona A, Patel A, Hellio C. Assay of flavonoid aglycones with HPLC in four species of genus Hypericum. J. Med. Plants Res. 2011;5(9):1526–1530. [Google Scholar]
- 7.Veitch NC, Elliott PC, Kite GC, Lewis GP. Flavonoid glycosides of the black locust tree, Robinia pseudoacacia (Leguminosae) Phytochem. 2010;71(4):479–486. doi: 10.1016/j.phytochem.2009.10.024. [DOI] [PubMed] [Google Scholar]
- 8.Călina D, Aciu M, Popescu H. The research of phytosterols to Robinia pseudoacacia L. species (Fabaceae) Rev. Med. Chir. Soc. Med. Nat. Iasi. 2007;111(2):96–100. [Google Scholar]
- 9.Călina D, Aciu M, Popescu H. The reseasrch of fatty oil obtained from Robinia pseudoacacia L. seeds (Fabaceae) Rev. Med. Chir. Soc. Med. Nat. Iasi. 111(2):101–105. [Google Scholar]
- 10.Gocan S, Câmpan G. Review of the analysis of medicinal plants by TLC: modern approaches. J. Liq. Chromatogr. Related Technol. 2004;7(9):1377–1411. [Google Scholar]
- 11.Jork H, Funk W, Fischer W, Wimer H. Thin Layer Chromatography. Reagents and Detection Methods. Weinheim: VCH Verlagsgesellschaft mbH; 1994. pp. 124–undefined. [Google Scholar]
- 12.Koksal E, Bursal E, Dikici E, Tozoglu F, Gulcin I. Antioxidant activity of Melissa officinalis leaves. J. Med. Plants Res. 2010;5(2):217–222. [Google Scholar]
- 13.De Rijke E, Out P, Niessen WMA, Ariese F, Gooijer C, Brinkman UAT. Analytical separation and detection methods for flavonoids. J Chromatogr A. 2006;111(2):31–36. doi: 10.1016/j.chroma.2006.01.019. [DOI] [PubMed] [Google Scholar]
- 14.Olennikov ND, Tankhaeva LM, Partilkhaev VV. Chemical investigation of Caragana spinosa runners. Chem. Nat. Cmpd. 2012;47(6):988–990. [Google Scholar]


