

Background: PC1 and PC2 function as a complex, but their interrelations are not completely understood.
Results: Expression of PC1 accelerates degradation of PC2.
Conclusion: PC1 negatively regulates PC2 expression, presumptively by enhancing degradation via the aggresome/autophagosome pathway.
Significance: Understanding how PC1 regulates PC2 within a critical range may help elucidate the pathogenesis of cyst formation.
Keywords: Calcium Channels, Physiology, Protein Degradation, Protein Processing, Trafficking
Abstract
Mutations of the PKD1 and PKD2 genes, encoding polycystin-1 (PC1) and polycystin-2 (PC2), respectively, lead to autosomal dominant polycystic kidney disease. Interestingly, up-regulation or down-regulation of PKD1 or PKD2 leads to polycystic kidney disease in animal models, but their interrelations are not completely understood. We show here that full-length PC1 that interacts with PC2 via a C-terminal coiled-coil domain regulates PC2 expression in vivo and in vitro by down-regulating PC2 expression in a dose-dependent manner. Expression of the pathogenic mutant R4227X, which lacks the C-terminal coiled-coil domain, failed to down-regulate PC2 expression, suggesting that PC1-PC2 interaction is necessary for PC2 regulation. The proteasome and autophagy are two pathways that control protein degradation. Proteins that are not degraded by proteasomes precipitate in the cytoplasm and are transported via histone deacetylase 6 (HDAC6) toward the aggresomes. We found that HDAC6 binds to PC2 and that expression of full-length PC1 accelerates the transport of the HDAC6-PC2 complex toward aggresomes, whereas expression of the R4227X mutant fails to do so. Aggresomes are engulfed by autophagosomes, which then fuse with the lysosome for degradation; this process is also known as autophagy. We have now shown that PC1 overexpression leads to increased degradation of PC2 via autophagy. Interestingly, PC1 does not activate autophagy generally. Thus, we have now uncovered a new pathway suggesting that when PC1 is expressed, PC2 that is not bound to PC1 is directed to aggresomes and subsequently degraded via autophagy, a control mechanism that may play a role in autosomal dominant polycystic kidney disease pathogenesis.
Introduction
Autosomal dominant polycystic kidney disease (ADPKD)3 is an inherited disorder that affects 1:400 to 1:1000 people who present with renal cysts. ADPKD leads to renal failure in 50% of all cases by the sixth decade of life. ADPKD results from mutations in the PKD1 gene or the PKD2 gene, which encode to the gene products polycystin 1 (PC1) and polycystin 2 (PC2), respectively.
PC1 is a 4302-amino acid protein with a large N-terminal extracellular domain, 11 transmembrane domains, and a short C-terminal domain (1, 2). PC2 is a transmembrane protein of 968 amino acids with six transmembrane domains (3). Interaction between PC1 and PC2 occurs via C-terminal coiled-coil domains (4). PC2 is present in the endoplasmic reticulum, plasma membrane, and primary cilia and functions as a nonselective cation channel (5). It is thought that mutations in the PKD1 or PKD2 gene cause a dysregulation of Ca2+ homeostasis that can lead to the development of ADPKD as a result of increased cAMP levels. Although PC1 and PC2 have been studied intensively, information on how they function to promote tubulogenesis or how a malfunction of either protein leads to cyst formation is still emerging.
The question of how much of the polycystins are necessary for normal function is still being addressed. It is well known that PKD1 or PKD2 gene knock-out in animal models leads to cyst formation (6, 7) early in development, ultimately leading to embryonic lethality. Likewise, in mice, lowering the Pkd1 gene expression to 13–20% of wild type leads to progressive development of polycystic kidney disease (PKD) (8). Curiously, it is also known that overexpression of PC1 in PKD1 transgenic mice leads to renal cyst formation that resembles ADPKD (9), whereas overexpression of PC2 in PKD2 transgenic mice leads to increased proliferation and apoptosis, activation of B-Raf and ERK, and renal cyst development at 6 months that increases with aging (10). Thus, data from these animal models suggest that up- or down-regulation of PC1 or PC2 leads to PKD. Similarly, MDCK cells have low endogenous PKD1 expression and spontaneously develop cysts in three-dimensional culture, whereas increasing the expression of PKD1 reverses the phenotype from cyst formation to tubulogenesis (11). On the other hand, in murine inner medullary collecting duct (mIMDC3) cells, overexpression of PKD1 disrupts tubulogenesis, leading to the formation of cyst-like structures (12). In most patients with ADPKD, the expression of PC1 is increased in cyst-lining epithelia (13, 14), but in some patients with ADPKD, the expression of PC1 is undetectable (13, 14). Clearly, knocking out all PC1 or PC2 function or reducing PC1 expression significantly is deleterious. On the other hand, overexpression is also deleterious. Taken together, these data suggest that the levels of PKD1 and/or PKD2 must be regulated within a functional window to prevent cyst formation.
Clearly, dysfunction of either PC1 or PC2 leads to ADPKD, suggesting that both proteins function in a common pathway. However, the interrelationships between the functional levels of PC1 and PC2 are not yet understood. Here we hypothesized that the regulation of PC1 and PC2 protein expression may be required to support normal kidney function. To our surprise, we found that PC1 affects PC2 expression.
EXPERIMENTAL PROCEDURES
Plasmids and Constructs
Full-length mouse Pkd1 (mPkd1) with an N-terminal HaloTag and C-terminal FLAG tag, cloned into the pcDNA5/FRT/TO vector (Invitrogen), were provided by Baltimore PKD Core Center (University of Maryland, Baltimore, MD). C-terminal truncation at position R4218X in mPkd1, which corresponds to the human PKD1 disease-causing mutation at position R4227X (5), was generated with a QuikChange Lightning site-directed mutagenesis kit from Agilent Technologies (La Jolla, CA). The entire plasmid was sequenced after mutagenesis to confirm that there were no new mutations.
Cell Culture and Treatments
MDCK (MDCK-mPkd1) cells, which had been stably transfected using a Flp-In T-REx core kit (Invitrogen) with full-length mPkd1 bearing an N-terminal Halo Tag and C-terminal FLAG tag and cloned into the pcDNA5/FRT/TO vector (Invitrogen), were provided by Baltimore PKD Center (University of Maryland). The mPkd1-R4227X mutant, cloned into the pcDNA5/FRT/TO vector (Invitrogen), was stably transfected into MDCK cells using a Flp-In T-REx core kit (Invitrogen). MDCK cells were cultured in DMEM supplemented with 10% fetal bovine serum, 5% penicillin/streptomycin, 150 μg/ml hygromycin, and 5 μg/ml blasticidin. mIMCD3 cells were cultured in DMEM/Ham's F-12 medium supplemented with 10% fetal bovine serum and 5% penicillin/streptomycin. PC1 expression was induced with tetracycline (2 μg/ml) 7–24 h before harvesting. Cells were treated with the proteasome inhibitor MG-132 (Calbiochem) for 16 h, the HDAC6 inhibitor tubacin (Sigma) for 7 h, and the lysosomal inhibitor bafilomycin A (Sigma) or E64 (Calbiochem) with Pepstatin A (Sigma) for 16 h.
Quantitative PCR
Total RNA was extracted with RNeasy mini kit (Qiagen). SuperScript first strand system for RT-PCR (Invitrogen) was used to generate complementary DNA (cDNA). For quantitative PCR, we used iQ SYBR Green Supermix (Bio-Rad). Following primers were used for PC1 (GCC AGT GGT CTG TTT TTG GC and GT AGA GAG TGT CAG CAC CAG), PC2 (CCA GAA GGA GGG GAA GTA TC and G CTC CAT GAT TTC CAG CTT CAC), and β-actin (GGA TGC AGA AGG AGA TCA CTG and CAT TTG CTG GAA GGT GGA CAG). PC2 and β-actin primers were designed based on canine PC2 and β-actin mRNA sequence, respectively. PC1 primers were designed based on Mus musculus mRNA sequence.
Antibodies
Monoclonal antibodies recognizing PC1 and glucosidase IIβ, also known as PRKCSH, were obtained from Santa Cruz Biotechnology, Inc. (Santa Cruz, CA). A polyclonal antibody against PC2 was provided by Baltimore PKD Core Center (University of Maryland). A polyclonal antibody against HDAC6 was obtained from Santa Cruz Biotechnology, and a monoclonal anti-GAPDH antibody from US Biological (Swampscott, MA). A polyclonal anti-LC3 antibody was obtained from Novus Biological (Littleton, CO).
Western Blotting
In brief, timed pregnant Pkd1± mice (provided by the Baltimore PKD core center) were euthanized, and embryos at 14.5 days postconception were dissected and homogenized in lysis buffer (20 mm sodium phosphate, pH 7.2, with 150 mm NaCl, 1 mm EDTA, 10% glycerol, and 1% Triton X-100) supplemented with protease inhibitor mixture (Sigma). The homogenate was incubated for 1 h on ice and cleared of debris by centrifugation at 17,000 × g for 20 min at 4 °C. Cells were harvested and processed as described previously (16). In brief, cells were solubilized in lysis buffer (150 mm Tris-HCl, pH 7.4, with 50 mm NaCl, 1% Nonidet P-40, and complete protease inhibitors; Roche Applied Science). The cell lysates were spun at 10,000 × g for 10 min at 4 °C to pellet insoluble material, and the supernatants were collected. The protein concentrations were measured with BCA reagent, and the supernatants were then denatured in 2× Laemmli buffer at 37 °C for 20 min and run on 3–8% SDS-PAGE gels before transferring to a polyvinylidene fluoride membrane for Western blotting, followed by enhanced chemiluminescence (SuperSignal West Dura; Thermo Scientific). The chemiluminescent signal on the PVDF membrane was directly captured by a FujiFilm LAS-1000 Plus System with a cooled CCD camera. PC1, PC2, HDAC6, PRKCSH, LC3, and GAPDH were detected with the antibodies described above.
Quantification of Western Blot Data
The density of the PC1, PC2, or GAPDH bands was measured with MultiGauge software (FujiFilm). The PC1 and PC2 level was standardized to that of the GAPDH. In each experiment, the most intense band was considered 100%, and the rest were compared with this band. PC2 expression for each group is shown as fold change (mean ± S.D.) for three experiments. Comparison between groups was assessed by using the Student's t test. We used Microsoft Excel to generate column bars or linear graphs.
Immunoprecipitation
Cells were harvested and processed as described above. The anti-PC2 antibody (2 μl) was added to each lysate and allowed to incubate overnight; 50 μl of A/G-agarose beads (Santa Cruz) were then added, and the mixture was incubated with gentle rocking for 4 h at 4 °C. Beads were washed four times with lysis buffer and then centrifuged to remove the buffer. The beads were suspended in 50 μl of Laemmli sample buffer containing β-mercaptoethanol, vortexed for 1 min, and resolved by 3–8% SDS-PAGE. For PC1 immunoprecipitation, 50 μl of anti-FLAG M2 affinity gel (Sigma-Aldrich) was added to each lysate and allowed to incubate overnight. Then affinity gel was washed with lysis buffer as described above, suspended in Laemmli sample buffer containing β-mercaptoethanol, and resolved by 3–8% SDS-PAGE. PC1, PC2, and HDAC6 were detected as described above.
RESULTS
PC1 Down-regulates the Expression of PC2
To study the interrelation between PC1 and PC2, we utilized a stably transfected MDCK cell line in which the expression of PC1 can be induced by tetracycline. We found that overexpression of inducible full-length PC1 in MDCK cells led to a significant down-regulation of endogenous PC2 (Fig. 1, A and B). There was no difference in mRNA expression of PC2 in PC1 induced versus uninduced MDCK cells (Table 1), suggesting that here was no difference in Pkd2 gene expression and that the difference in PC2 protein levels was post-translational.
FIGURE 1.

PC1 down-regulates PC2 expression. Full-length mPkd1 was stably transfected into MDCK cells using a Flp-In T-REx core kit (Invitrogen). mPkd1 has an N-terminal Halo Tag and a C-terminal FLAG tag. The transfected MDCK cells were grown on Transwell plates for 72 h, and PC1 expression was induced with tetracycline (2 μg/ml) for 24 h. Lanes 1 and 2 are Western blot lysates from MDCK cells stably transfected with an empty plasmid. Lanes 3 and 4 are Western blot lysates from MDCK cells stably transfected with an mPkd1 inducible plasmid. A, PC1 expression induced by tetracycline (top panel, lane 4) led to down-regulation of PC2 (middle panel, lane 4). This experiment was repeated more than 10 times. It is noteworthy that when the blot is exposed for long time, PC1 presents as a double band. Qian et al. (38) showed that PC1 undergoes cleavage at the G protein-coupled receptor proteolytic site into an N-terminal fragment and C-terminal fragment. PC1 antibodies that we used were made against the N-terminal fragment, and hence the top band is full-length PC1, and the bottom band is the N-terminal fragment. B, summary of PC2 expression. We used MultiGauge software to measure density of PC2 bands, shown as averages of three experiments and standard deviation. In each experiment the most intense band was considered 100%, and the rest of the bands were compared with this band. PC1 and PC2 bands were normalized to GAPDH. We used Student's t test to compare PC2 expression in MDCK-mPkd1 cells when PC1 is uninduced versus induced.
TABLE 1.
This table shows PC1 and PC2 mRNA expression in PC1-induced and uninduced MDCK-mPkd1 cells
mRNA levels are averaged from three experiments with standard deviation. All samples were run in triplicate. PC1 and PC2 mRNA levels were normalized to β-actin mRNA level.
| MDCK-mPkd1 | MDCK-mPkd1 | |
|---|---|---|
| Tetracycline (1 μg/ml) | − | + |
| PC1 (mRNA) | 0.07 ± 0.02 | 0.75 ± 0.21 |
| PC2 (mRNA) | 1.15 ± 0.13 | 1.14 ± 0.12 |
To determine whether the regulation of PC2 by PC1 was dose-dependent, we induced different levels of PC1 expression, beginning with a low dose of tetracycline and gradually increasing the dose. Using this approach, we found that the higher the PC1 expression, the lower the PC2 expression (Fig. 2, A and B). Next, we induced PC1 expression at the same time in a set of MDCK cells and harvested cells at different time points. Again, we found that PC1 down-regulated PC2 in a dose-dependent manner (Fig. 3, A and B). To take this a step further, we examined the interrelationship between PC1 and PC2 in 14.5-day postconception mouse embryos. We found that PC2 expression was significantly increased in the Pkd1 knock-out embryos when compared with wild-type embryos (Fig. 4, A and B). We were also intrigued to find out whether increased PC2 expression extends to other Pkd1 mouse models. Indeed we found that PC2 expression was significantly increased in Pkd1ΔCHA/ΔCHA mouse embryos (Fig. 5, A and B) (17). The entire C-terminal tail of PC1 has been deleted in Pkd1ΔCHA/ΔCHA mouse, and a HA-tag has been added to truncated C-terminal end (17). Pkd1ΔCHA/ΔCHA embryos survive only to embryonic day 16.5 (17). These results confirm that PC1 regulates PC2 expression not only in cell lines but also in animal models.
FIGURE 2.
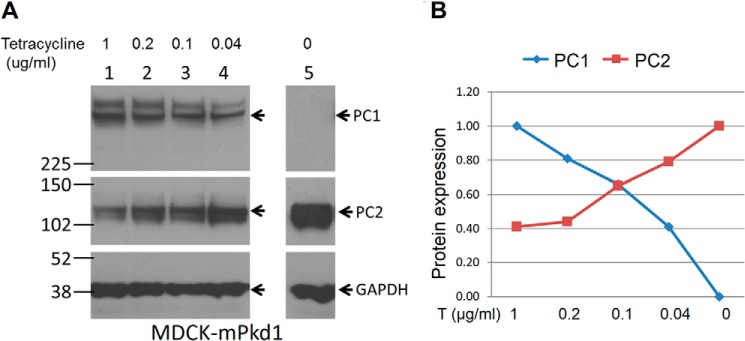
PC1 down-regulates PC2 expression in a dose-dependent manner. A, the tetracycline dose was gradually decreased to decrease PC1 expression. We found that PC1 down-regulates PC2 expression in a dose-dependent manner: the higher the PC1 expression, the lower the PC2 expression. B, summary of PC2 expression after PC1 titration.
FIGURE 3.
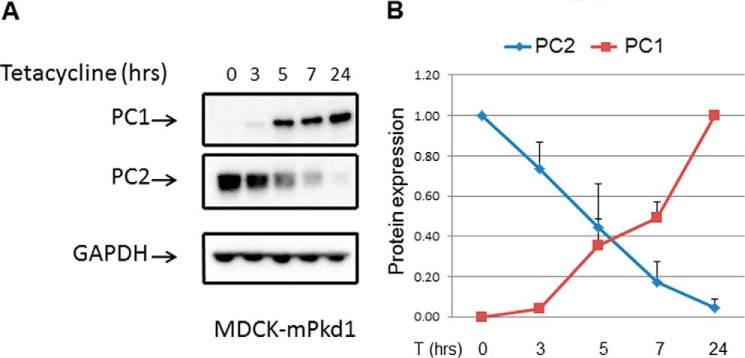
PC1 expression was induced with tetracycline (2 μg/ml) for different time points. A, PC1 was induced at the same time in a set of MDCK cells, and proteins were harvested at different time points (3, 5, 7, and 24 h). This experiment again demonstrated that PC2 down-regulation by PC1 is dose-dependent. B, summary of PC2 expression when PC1 is titrated.
FIGURE 4.
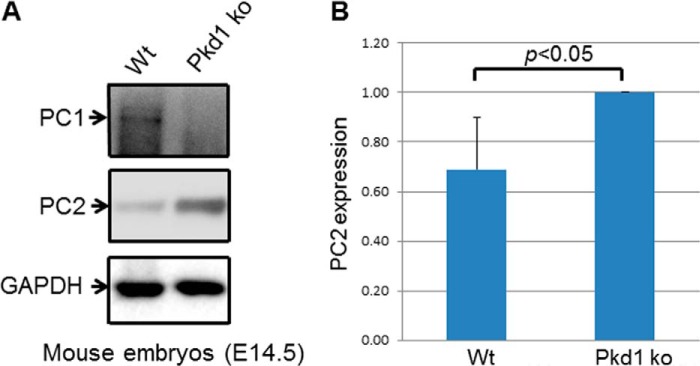
PC1 regulates PC2 expression in vivo. A, PC2 expression was decreased in wild-type mouse embryos (Wt, 14.5 days after conception) when compared with Pkd1 knock-out embryos (ko). This is a Western blot, and the entire experiment was repeated three times. B, summary of PC2 expression in wild-type and Pkd1 knock-out embryos.
FIGURE 5.
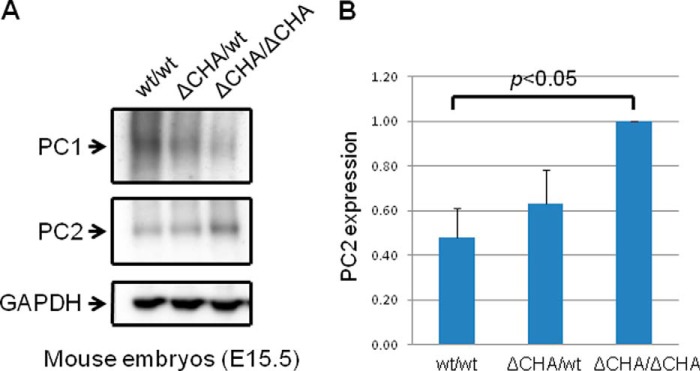
PC1 regulates PC2 expression in vivo. A, PC2 expression was decreased in wild-type mouse embryos (15.5 days after conception) when compared with Pkd1ΔCHA/ΔCHA embryos (17). This is a Western blot, and the entire experiment was repeated three times. Pkd1ΔCHA/ΔCHA lacks the C-terminal tail of PC1 and has a HA tag added to the truncated C-terminal end of PC1. Pkd1ΔCHA/ΔCHA knock-out is embryonically lethal, similar to Pkd1 knock-out. B, summary of PC2 expression in Pkd1wt/wt, Pkd1ΔCHA/wt, and Pkd1ΔCHA/ΔCHA embryos.
The PC1-PC2 Interaction Is Necessary for Down-regulation of PC2 by PC1
PC1 and PC2 both have coiled-coil domains that are critical to their function (5). Indeed, one of the disease-causing mutations in the human PKD1 gene, R4227X, generates a PC1 protein that lacks the last 76 amino acids and fails to interact with PC2 (5). To find out whether the PC1-PC2 interaction has a role in the regulation of PC2 expression, we generated a stably transfected MDCK cell line in which the expression of mPkd1-R4227X could be induced by tetracycline. We tested the mPkd1-R4227X mutant by co-immunoprecipitation assays to confirm that it does not interact with PC2 (see Fig. 7). In this experiment, full-length mPkd1 was used as a positive control for the co-immunoprecipitation of PC2 (see Fig. 7). Importantly, in contrast to full-length PC1, overexpression of mPkd1-R4227X in MDCK cells failed to down-regulate PC2 expression (Figs. 6 and 7), suggesting that the PC1-PC2 interaction is necessary for PC1 to down-regulate PC2. This finding also indicates that the down-regulation of PC2 is dependent on a functional PC1 and is not caused by a nonspecific effect of PC1 induction.
FIGURE 7.
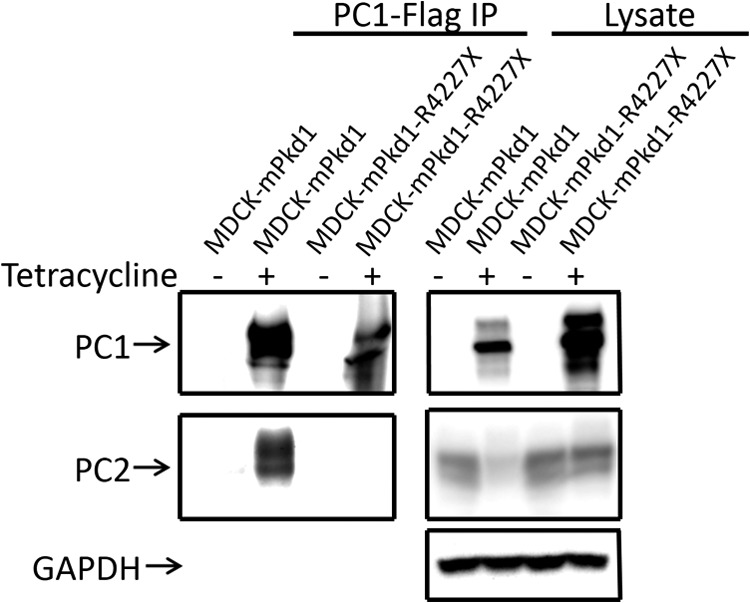
The mPkd1-R4227X mutant does not interact with PC2. We tested the mutant in a co-immunoprecipitation assay to confirm that the mPkd1-R4227X protein does not interact with PC2. Full-length mPkd1 was used as a positive control for the co-immunoprecipitation of PC2. This a Western blot, and the entire experiment was repeated three times.
FIGURE 6.
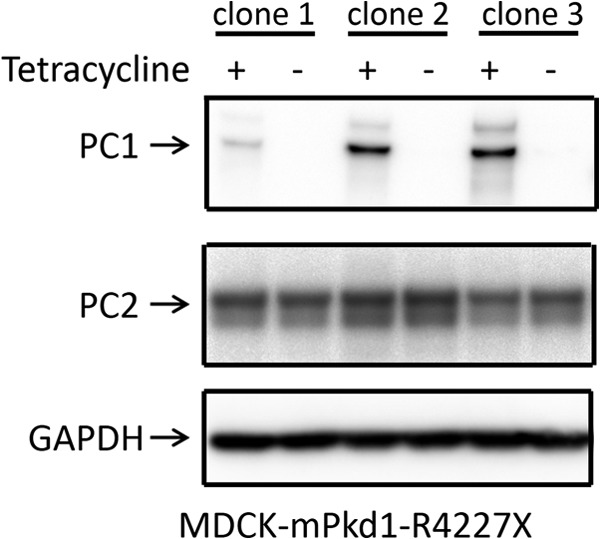
The mPkd1-R4227X mutant does not affect PC2 expression. To determine whether an interaction between PC1 and PC2 is necessary for the regulation of PC2 expression, we generated a plasmid that includes a truncated mouse Pkd1 (mPkd1-R4227X) lacking the last 76 amino acids, which cannot interact with PC2. Like the full-length mPkd1, this mPkd1-R4227X had an N-terminal HaloTag and a C-terminal FLAG tag. The mPkd1-R4227X plasmid was stably transfected into MDCK cells using a Flp-In T-REx core kit. MDCK cells were grown for 72 h, and expression of full-length mPkd1 and mPkd1-R4227X was induced with tetracycline (2 μg/ml) for 24 h. Overexpression of the mPkd1-R4227X mutant in MDCK cells (top panel) had no effect on PC2 expression (middle panel). Note that there are three different clones. This is a Western blot.
PC2 Is Not Degraded by Proteasomes When PC1 Is Expressed
Proteasome-mediated degradation and autophagy, also known as the lysosomal degradation pathway, are two systems that control intracellular protein degradation. Endoplasmic reticulum-associated protein degradation (ERAD) delivers unfolded proteins to the proteasome for degradation. Mutations in the PRKCSH gene lead to autosomal dominant polycystic liver disease (18, 19). It has been shown that PC2 is degraded via ERAD (20), but PRKCSH protects PC2 from ERAD (21). Consistent with this finding is the observation that knockdown of PRKCSH in MDCK cells leads to down-regulation of PC2 as a result of Herp-mediated ERAD degradation (21). Thus, one possible explanation for our result is that PC1 expression affects PRKCSH levels, which would in turn affect PC2. To test this possibility, we evaluated PRKCSH expression. We found that PC1 overexpression had no effect on PRKCSH expression (Fig. 8). These data suggest that the down-regulation of PC2 by PC1 does not proceed via PRKCSH, but rather by a different pathway.
FIGURE 8.
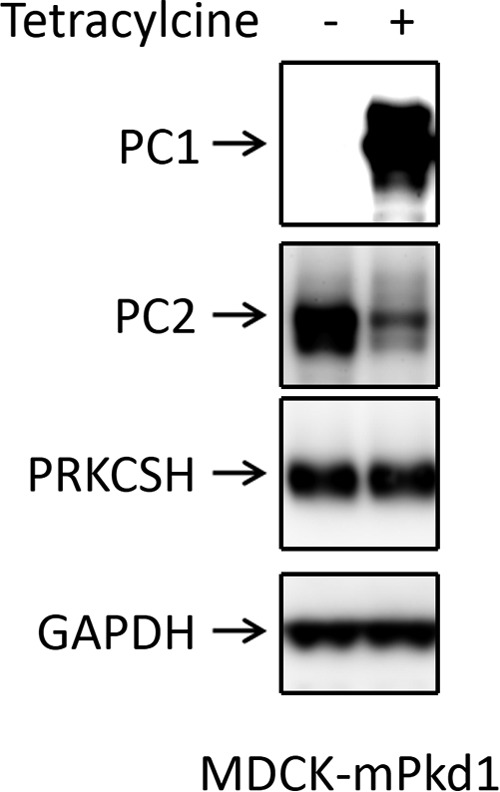
PC1 expression does not affect PRKCSH expression. Tetracycline treatment induced PC1 expression in MDCK cells but had no effect on PRKCSH expression. This is a Western blot, and the entire experiment was repeated three times.
It has been shown that PC1 and PC2 are degraded by proteasomes (20, 22). To explore this degradation pathway, we treated cells with the proteasome inhibitor MG-132 and analyzed PC1 and PC2 expression. As expected, we found that PC1 expression was increased by treatment with MG-132 (Fig. 9, A and B). Surprisingly, however, we noticed that PC2 expression was decreased after treatment with MG-132 (Fig. 9, A and B). Although Liang et al. (20) came to the conclusion that PC2 is degraded by proteasomes, we found that PC2 is not degraded by this pathway when PC1 is expressed. To further study the effect of MG-132 on PC2 expression, we used control MDCK cells that had been stably transfected with an empty pcDNA5 plasmid. We found that in the control MDCK cells, treatment with MG-132 led to a down-regulation of PC2 (Fig. 10, A and B) similar to that in MDCK cells overexpressing PC1. In addition, we noticed that endogenous PC1 was up-regulated in the control MDCK cells in the presence of MG-132 (Fig. 10). Next, we treated mIMCD3 cells with MG-132 and found that PC2 was down-regulated (Fig. 11A and B), as it was in MDCK cells. Although PC2 can be degraded by proteasomes when it is expressed without PC1 (20), our data show that PC1 expression leads to PC2 degradation via a pathway other than the proteasomal pathway.
FIGURE 9.

The proteasome inhibitor MG132 increases the expression of recombinant PC1 and leads to further down-regulation of PC2 expression in MDCK cells. For this experiment, we used MDCK cells that were stably transfected with an inducible mPkd1 plasmid (see details in Fig. 1 legend). Cells were grown on Transwell plates for 72 h, and PC1 expression was induced with tetracycline (2 μg/ml) for 72 h. Cells were treated with MG132 (1 μm/ml) for 16 h before harvesting. Control cells were treated with vehicle (DMSO). A, treatment with MG-132 led to increased PC1 expression and further down-regulation of PC2. This is a Western blot, and the entire experiment was repeated more than five times. B, summary of PC2 expression after PC1 induction and proteasome treatment in MDCK cells.
FIGURE 10.
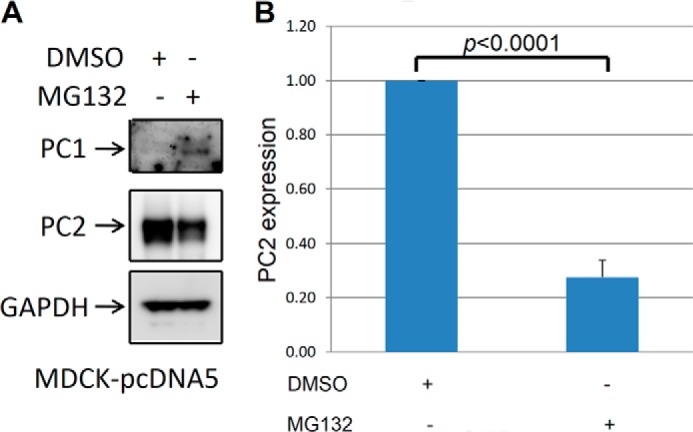
The proteasome inhibitor MG132 increases endogenous PC1 expression and decreases PC2 expression in MDCK cells. A, MDCK cells stably transfected with an empty plasmid were treated with MG132 (1 μm/ml) for 16 h before harvesting, and control cells were treated with vehicle (DMSO). Endogenous PC1 was undetectable in MDCK cells. Treatment with MG-132 led to an up-regulation of endogenous PC1 to a detectable level and down-regulation of PC2. This is a Western blot, and the experiment was repeated three times. B, summary of PC2 expression after proteasome treatment in MDCK cells.
FIGURE 11.
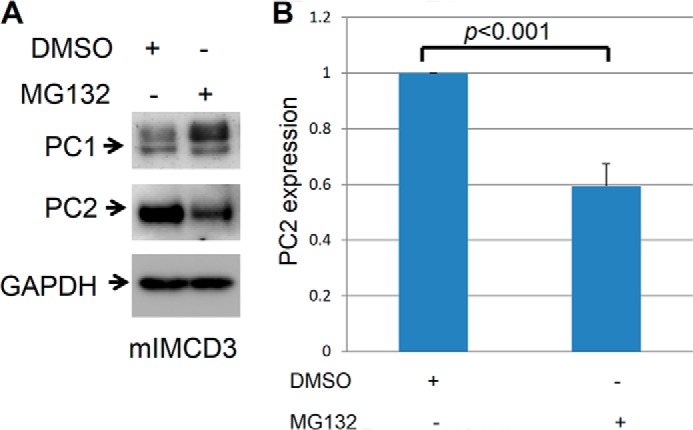
MG132 increases endogenous PC1 expression and decreases PC2 expression in mIMCD-3 cells. A, mIMCD-3 cells were treated with MG132 (1 μm/ml) for 16 h. Control cells were treated with vehicle (DMSO). Treatment with MG-132 led to an up-regulation of endogenous PC1 and down-regulation of PC2. This is a Western blot, and the entire experiment was repeated three times. B, summary of PC2 expression after proteasome treatment in mIMCD3 cells.
PC2 Is Degraded via the Aggresome Pathway
If PC2 is not degraded by proteasomes, then why does it decrease following proteasome inhibition? It turns out that inhibition of proteasomes with MG-132 not only blocks proteasomal degradation but also activates autophagy (23–25), suggesting that PC2 is degraded via autophagy. Hence, we focused our attention on the lysosomal degradation pathway, or autophagy. First, we explored the aggresome pathway. Unfolded or misfolded proteins that are not degraded by proteasomes precipitate in the cytosol (26, 27) and are transported by HDAC6 toward aggresomes. Aggresomes are surrounded by a double-membrane vesicle known as an autophagosome, which then fuses with the lysosome for degradation; this process is also known as autophagy (28). Tubacin is a specific HDAC6 inhibitor that blocks the aggresome pathway (26, 29) without affecting gene expression or cell cycle progression (30). We found that inhibition of the aggresome pathway with tubacin led to up-regulation of PC2 expression when PC1 was overexpressed (Fig. 12, A and B). Importantly, tubacin had no effect on PC1 expression (Fig. 12A). In addition, tubacin had no effect on PC2 when PC1 expression was not induced in MDCK cells (Fig. 13), suggesting that PC1 induction was stimulating the degradation of PC2.
FIGURE 12.
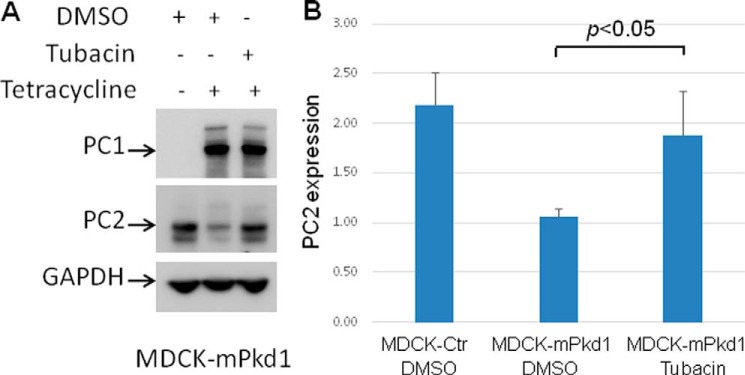
Inhibition of the aggresome degradation pathway with tubacin prevents down-regulation of PC2 when PC1 is expressed. A, tubacin, a specific HDAC6 inhibitor that blocks the aggresome degradation pathway, prevented the down-regulation of PC2 in PC1-induced MDCK cells. PC1 expression was induced with tetracycline (2 μg/ml) for 7 h. Cells were treated with tubacin (10 μm) for 7 h; control cells were treated with DMSO. Tubacin had no effect on PC1 expression. This is a Western blot, and the experiment was repeated three times. B, summary data for the tubacin experiment.
FIGURE 13.
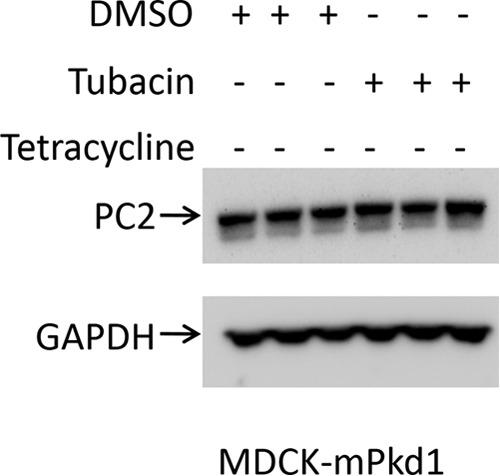
Inhibition of the aggresome degradation pathway with tubacin has no effect on PC2 expression in control cells. PC2 expression remained unchanged after tubacin treatment in MDCK control cells (PC1 uninduced). Cells were treated with tubacin (10 μm) for 7 h; control cells were treated with DMSO. This is a Western blot.
To take this one step further, we asked whether HDAC6 binds to PC2. Fig. 14 shows that HDAC6 does indeed bind to PC2 in control MDCK cells in which PC1 has not been induced. Because tubacin had no effect on PC2 in uninduced cells, it appears that HDAC6 binds to PC2 but does not transfer it to the aggresome for degradation. We also found (Fig. 14) that induction of PC1 leads not only to the down-regulation of PC2 expression but also to a decrease in the binding of HDAC6 to PC2. These data suggest that HADC6 binds to PC2 but can carry it to the aggresome only in the presence of increased levels of PC1. Thus, PC1 likely accelerates the degradation of PC2 via the aggresome pathway, leading to a decreased co-immunoprecipitation of HDAC6 by PC2. On the other hand, PC1 does not co-immunoprecipitate with HDAC6 (Fig. 15), suggesting that PC1 accelerates the aggresomal degradation of PC2 via a second messenger that requires the presence of the C-terminal tail of PC1. Consistent with this concept is the observation that overexpression of the mPkd1-R4227X mutant did not decrease PC2 expression, nor did it decrease the interaction between PC2 and HDAC6 (Fig. 16). Thus, it appears that the C terminus of PC1 has a regulatory role in the aggresome pathway. Taken together, these data suggest that overexpression of full-length mPkd1, but not mPkd1-R4227X, accelerates PC2 degradation via the aggresome pathway.
FIGURE 14.
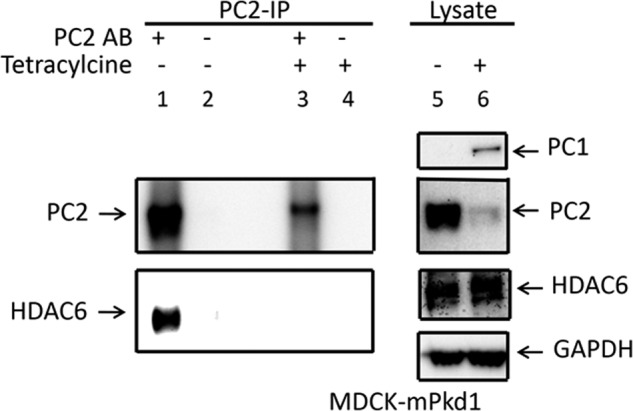
PC2 co-immunoprecipitates with HDAC6. When PC1 was not induced in MDCK cells, PC2 co-immunoprecipitated with HDAC6 (left panels). When PC1 is induced in MDCK cells, co-immunoprecipitation of PC2 with HDAC6 was greatly reduced (left panels). PC1 overexpression had no effect on the HDAC6 expression (right panels). This is a Western blot, and the experiment was repeated three times. IP, immunoprecipitation.
FIGURE 15.
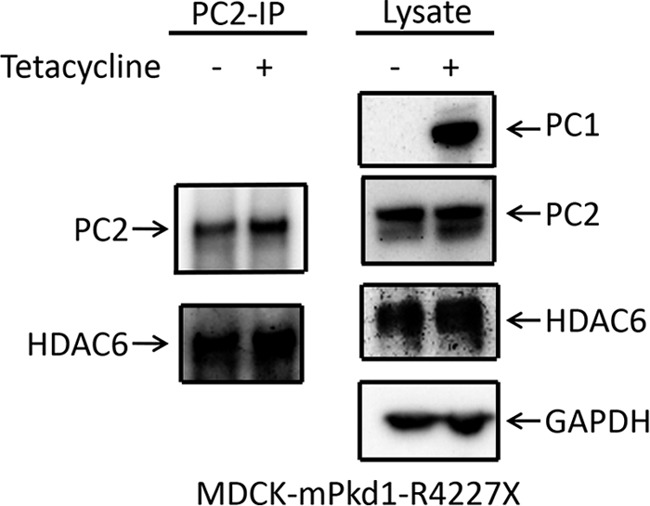
Expression of mPkd1-R4227X does not affect the PC2-HDAC6 interaction. In the presence or absence of mPkd1-R4227X, PC2 was co-immunoprecipitated (IP) with HDAC6 in MDCK cells (left panels). Overexpression of mPkd1-R4227X had no effect on HDAC6 expression (right panels). This is a Western blot, and the experiment was repeated three times.
FIGURE 16.
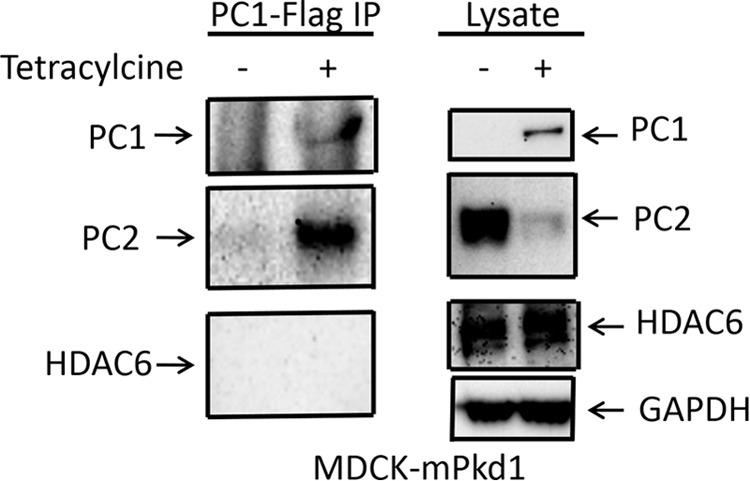
PC1 does not interact with HDAC6. We tested whether PC1 interacts with HDAC6. An anti-FLAG M2 affinity gel was used for PC1 immunoprecipitation (IP). PC1 did not co-immunoprecipitate HDAC6 (left panels). For a positive control, we showed that PC1 co-immunoprecipitated PC2 (left panels). The lysate is shown in the right panels.
Inhibition of Autophagy Prevents PC1-induced Degradation of PC2
Because aggresomes are engulfed by autophagosomes, which then fuse with lysosomes for protein degradation, we explored this pathway further. Bafilomycin A, selective inhibitor of vacuolar H+-ATPases, inhibits autophagy either by blocking autophagosome-lysosome fusion or by blocking lysosomal degradation (31), whereas E64 in combination with pepstatin A inhibits lysosomal proteases and interferes with autolysosomal digestion (32). We inhibited lysosomal autophagy with bafilomycin A or E64 with pepstatin A and found that whereas both decreased the degradation of PC2 when PC1 was overexpressed in MDCK cells, the bafilomycin A effect was stronger than that of E64 with pepstatin A (Fig. 17, A and B). Inhibition of autophagy with both bafilomycin A and E64 with pepstatin A had a synergistic effect and led to further decrease in PC2 degradation when PC1 was overexpressed in MDCK cells (Fig. 17, A and B). Inhibition of autophagy with bafilomycin A, E64 with pepstatin A or both had no effect on the PC2 level when PC1 expression was not induced in MDCK cells (Fig. 18). Taken together, these data support the idea that PC2 is degraded via autophagy.
FIGURE 17.
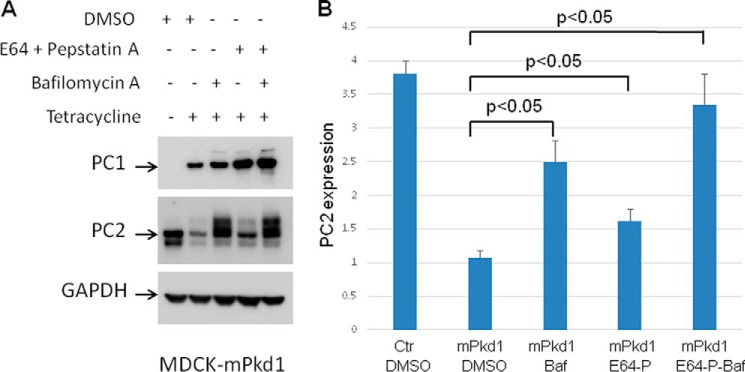
Inhibition of the lysosome degradation pathway prevents PC1-driven degradation of PC2. A, inhibition of autophagy with bafilomycin A (50 nm) or E64 (50 μm) with pepstatin A (2.5 μm) decreased the degradation of PC2 when PC1 was overexpressed in MDCK cells. Inhibition of autophagy with both bafilomycin A (50 nm) and E64 (50 μm) with pepstatin A had a synergistic effect and led to a further decrease in PC2 degradation when PC1 was overexpressed in MDCK cells. MDCK cells were treated for 16 h. Control cells were treated with vehicle (DMSO). PC1 expression was induced with tetracycline (2 μg/ml) for 16 h. This is a Western blot, and the experiment was repeated three times. B, summary of the inhibition of the lysosome degradation pathway. Baf, bafilomycin A; Ctr, control; P, pepstatin A.
FIGURE 18.
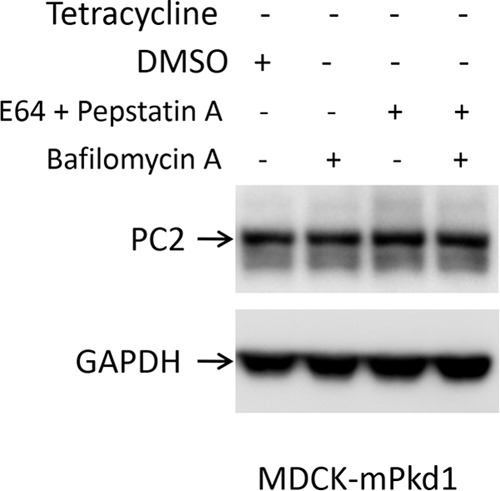
Inhibition of the lysosome degradation pathway has no effect on PC2 expression in control cells. In MDCK control cells (PC1 uninduced), PC2 expression remained unchanged after treatment with bafilomycin A (50 nm), with E64 (50 μm) and pepstatin A (2.5 μm), or with both. Cells were treated for 16 h. Control cells were treated with vehicle (DMSO). This is a Western blot, and the experiment was repeated three times.
PC1 Does Not Increase Autophagosome Accumulation
Next, we asked whether PC1 activates autophagy. Microtubule-associated protein light chain 3 (LC3) is a marker of autophagy. Increased conversion of the cytosolic form, LC3-I, to the autophagosome form, LC3-II, is seen with increased formation of autophagosomes, suggesting increased autophagy (33). Overexpression of PC1 in MDCK cells did not increase the conversion of LC3-I to LC3-II (Fig. 19), suggesting that overexpression of PC1 does not increase autophagosome accumulation. Inhibition of autophagy with bafilomycin A led to an increased conversion of LC3-I to LC3-II (Fig. 19), indicating an accumulation of autophagosomes. These data indicate that overexpression of PC1 does not increase autophagosome accumulation and hence does not activate autophagy. Consistent with this conclusion is the observation by Lee et al. that although HDAC6 stimulates autophagosome-lysosome fusion and substrate degradation, it does not activate autophagy (34).
FIGURE 19.
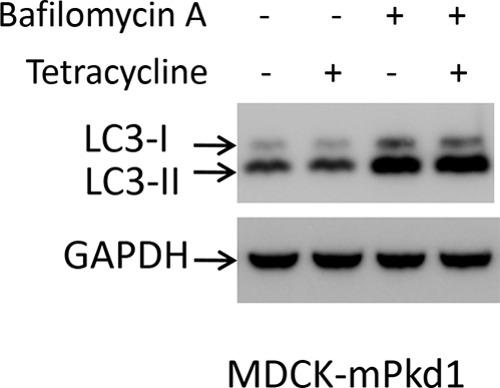
Overexpression of PC1 does not activate autophagy. Overexpression of PC1 in MDCK cells did not increase the conversion of LC3-I to LC3-II. Inhibition of autophagy with bafilomycin A led to increased conversion of LC3-I to LC3-II, indicating accumulation of autophagosomes. Cells were treated with bafilomycin A (50 nm) for 16 h. PC1 expression was induced with tetracycline (2 μg/ml) for 16 h. Control cells were treated with vehicle (DMSO). This is a Western blot, and the experiment was repeated three times.
DISCUSSION
Our data show for the first time that PC1 regulates PC2 expression in both cell culture models and an animal models. We found that the induction of PC1 in MDCK cells leads to a down-regulation of PC2 in a dose-dependent manner. In addition, we showed that in embryos from two separate Pkd1 mouse models, PC2 expression is increased when compared with wild-type embryos. It is known that PC1 and PC2 interact via C-terminal coiled-coil domains. PC2 is a nonselective cation channel that is permeable to Ca2+. Hanaoka et al. (5) have shown that calcium currents are produced in the presence of the PC1-PC2 complex, whereas a PKD1 disease-causing mutation (R4227X) disrupts complex assembly and channel activity (5) at the plasma membrane. We show here that full-length PC1 down-regulates PC2 expression, whereas the mPkd1-R4227X mutant failed to down-regulate PC2 expression, suggesting that the PC1-PC2 interaction is critical for the regulation of PC2 expression.
Proteasome and autophagy pathways play a major role in protein degradation and cellular homeostasis. Unfolded or misfolded proteins are refolded by chaperones, whereas proteins that cannot be refolded are degraded by proteasomes (26). Fedeles et al. (22) have shown that PC1 is degraded by proteasomes, and Liang et al. (20) demonstrated that PC2 is degraded by the same mechanism. Gao et al. (21) have shown that knockdown of PRKCSH leads to a down-regulation of PC2, indicating that PRKCSH protects PC2 against Herp-dependent ubiquitination and ERAD degradation. In our studies, we have demonstrated that overexpression of PC1 down-regulates PC2 but has no effect on PRKCSH expression, suggesting that PC2 may be degraded by a pathway other than via PRKCSH in the presence of PC1. Thus, we took a different approach and studied PC1 and PC2 expression simultaneously when proteasomes were inhibited with MG-132. In agreement with previous reports (22), we found that PC1 was degraded by proteasomes, whereas PC2 was not degraded by proteasomes when PC1 was expressed. We further showed that after treatment with MG-132, endogenous PC2 was down-regulated, and endogenous PC1 was up-regulated in MDCK cells. In addition, we demonstrated that endogenous PC2 expression was further decreased when recombinant PC1 was expressed in MDCK cells, and the proteasomes were inhibited with MG-132. Inhibition of proteasomes leads to activation of autophagy, and this activation would explain the down-regulation of PC2 after treatment with MG-132.
Proteins that are unfolded or misfolded and are not degraded by proteasomes precipitate in the cytoplasm (26). HDAC6 binds to precipitated proteins to facilitate their transport toward the microtubule organizing center to form a storage bin called the aggresome. Tubacin is a specific HDAC6 inhibitor that blocks the aggresome pathway (29). We found that down-regulation of PC2, triggered by PC1 overexpression, was reversed by tubacin, indicating that PC2 is degraded via the aggresome pathway. PC1 overexpression had no effect on HDAC6 expression, suggesting that PC1 increases HDAC6 activity (which is inhibited by tubacin). We showed that activation of autophagy with MG-132 led to increased degradation of PC2 in the presence or absence of PC1. On the other hand, inhibition of autophagy prevented PC2 degradation when PC1 was overexpressed, suggesting that PC2 is degraded via autophagy. HDAC6 does not activate autophagy but plays a critical role in autophagosome-lysosome fusion and substrate degradation (34). Consistent with this role is our observation that PC1 did not increase the conversion of LC3-I to LC3-II, suggesting that PC1 does not activate autophagy. We further showed that HDAC6 binds to PC2 in control MDCK cells, whereas in PC1-induced MDCK cells, the interaction between PC2 and HDAC6 is greatly reduced, suggesting that PC1 accelerates the degradation of PC2 via the aggresome/autophagosome pathway. Chauvet et al. (35) have shown that the C-terminal tail of PC1 (PC1-CTT) is translocated to the nucleus in the renal epithelial cells of mice overexpressing murine PC1. In addition, the expression of PC1-CTT results in reduced proliferation and apoptosis in Pkd1−/− cells and rescues morphant phenotypes in Pkd1 knockdown zebrafish embryos (36). We found that the mPkd1-R4227X mutant, which lacks the last 76 amino acids, had no effect on PC2 expression or the PC2-HDAC6 interaction. On the other hand, full-length PC1 down-regulated PC2 expression but did not interact with HDAC6, suggesting that PC1 accelerates the aggresomal degradation of PC2 via a second messenger, or perhaps by nuclear translocation of PC1-CTT.
Knock-out of the PKD1 or PKD2 gene has been shown to lead to polycystic kidney disease in mouse models (6, 7). On the other hand, overexpression of either gene product in transgenic mice leads to cyst formation (9, 10). In addition, Lantinga-van Leeuwen et al. (8) have shown that down-regulation of PKD1 gene expression (to 13–20% of wild type) results in polycystic kidneys in mice. Interestingly, PC1 is undetectable by immunohistochemical staining in MDCK cells (11), which spontaneously form cysts in three-dimensional collagen gels (11, 38, 39). Boletta et al. (11) have shown that the expression of human PC1 in MDCK cells leads to tubule formation; these authors suggested that in MDCK cells, the PC1 level is below the threshold necessary to prevent cyst formation. On the other hand, Patel et al. (12) have demonstrated that overexpression of PKD1 in renal epithelial cells disrupts tubulogenesis and produces cyst-like structures, suggesting that the level of the PKD1 gene must be tightly regulated for normal tubule formation to occur. These elegant studies have indicated that either up- or down-regulation of PKD1 gene expression beyond a critical point can lead to cyst formation.
PC2 expression has a negative effect on cell proliferation in cell culture models (40, 41), whereas PC2 overexpression in animal models leads to cyst formation (42), suggesting that the level of PC2 must be tightly controlled to prevent cyst formation. It is possible that tight regulation of PC2 as well as PC1 is required to prevent cyst formation. We report here the novel finding that PC2 is degraded via the autophagy. Although full-length PC1 accelerated PC2 degradation presumptively by enhancing degradation via the aggresome/autophagosome pathway, the PC1 mutant R4227X lacking the last 76 amino acids failed to accelerate PC2 degradation. How PC1 accelerates PC2 degradation via the aggresome/autophagosome pathway is not entirely clear.
Increased HDAC6 activity and level stimulates proliferation in cancer cells, whereas inhibition of HDAC6 activity has an anti-proliferative effect (15). We show here for the first time that PC1 regulates PC2 expression via HDAC6. Dysregulation of PC1 or PC2 leads to PKD, a disease characterized by increased proliferation in cystic epithelia (37). This study raises the possibility that HDAC6 might be a therapeutic target to impact not only PC2 levels, but also cyst formation and growth.
Acknowledgments
We thank Dr. Terry Watnick for helpful discussions and Dr. Deborah McClellan for editorial assistance. We also thank Dr. Patricia Garcia for technical advice and experimentation.
This work was supported, in whole or in part, by National Institutes of Health Grants R01 DK 32753 (to W. G.), DK062199 (to F. Q.), and P30 DK090868 (to the Baltimore Polycystic Kidney Disease Research and Clinical Core Center). This work was also supported by a National Kidney Foundation of Maryland Professional Development Award (to V. C.).
- ADPKD
- autosomal dominant polycystic kidney disease
- PKD
- polycystic kidney disease
- PC
- polycystin
- HDAC
- histone deacetylase
- MDCK
- Madin-Darby canine kidney
- ERAD
- endoplasmic reticulum-associated protein degradation.
REFERENCES
- 1. Hughes J., Ward C. J., Peral B., Aspinwall R., Clark K., San Millán J. L., Gamble V., Harris P. C. (1995) The polycystic kidney disease 1 (PKD1) gene encodes a novel protein with multiple cell recognition domains. Nat. Genet. 10, 151–160 [DOI] [PubMed] [Google Scholar]
- 2. Nims N., Vassmer D., Maser R. L. (2003) Transmembrane domain analysis of polycystin-1, the product of the polycystic kidney disease-1 (PKD1) gene. Evidence for 11 membrane-spanning domains. Biochemistry 42, 13035–13048 [DOI] [PubMed] [Google Scholar]
- 3. Mochizuki T., Wu G., Hayashi T., Xenophontos S. L., Veldhuisen B., Saris J. J., Reynolds D. M., Cai Y., Gabow P. A., Pierides A., Kimberling W. J., Breuning M. H., Deltas C. C., Peters D. J., Somlo S. (1996) PKD2, a gene for polycystic kidney disease that encodes an integral membrane protein. Science 272, 1339–1342 [DOI] [PubMed] [Google Scholar]
- 4. Qian F., Germino F. J., Cai Y., Zhang X., Somlo S., Germino G. G. (1997) PKD1 interacts with PKD2 through a probable coiled-coil domain. Nat. Genet. 16, 179–183 [DOI] [PubMed] [Google Scholar]
- 5. Hanaoka K., Qian F., Boletta A., Bhunia A. K., Piontek K., Tsiokas L., Sukhatme V. P., Guggino W. B., Germino G. G. (2000) Co-assembly of polycystin-1 and -2 produces unique cation-permeable currents. Nature 408, 990–994 [DOI] [PubMed] [Google Scholar]
- 6. Lu W., Peissel B., Babakhanlou H., Pavlova A., Geng L., Fan X., Larson C., Brent G., Zhou J. (1997) Perinatal lethality with kidney and pancreas defects in mice with a targetted Pkd1 mutation. Nat. Genet. 17, 179–181 [DOI] [PubMed] [Google Scholar]
- 7. Wu G., Markowitz G. S., Li L., D'Agati V. D., Factor S. M., Geng L., Tibara S., Tuchman J., Cai Y., Park J. H., van Adelsberg J., Hou H., Jr., Kucherlapati R., Edelmann W., Somlo S. (2000) Cardiac defects and renal failure in mice with targeted mutations in Pkd2. Nat. Genet. 24, 75–78 [DOI] [PubMed] [Google Scholar]
- 8. Lantinga-van Leeuwen I. S., Dauwerse J. G., Baelde H. J., Leonhard W. N., van de Wal A., Ward C. J., Verbeek S., Deruiter M. C., Breuning M. H., de Heer E., Peters D. J. (2004) Lowering of Pkd1 expression is sufficient to cause polycystic kidney disease. Hum. Mol. Genet. 13, 3069–3077 [DOI] [PubMed] [Google Scholar]
- 9. Thivierge C., Kurbegovic A., Couillard M., Guillaume R., Coté O., Trudel M. (2006) Overexpression of PKD1 causes polycystic kidney disease. Mol. Cell. Biol. 26, 1538–1548 [DOI] [PMC free article] [PubMed] [Google Scholar]
- 10. Park E. Y., Sung Y. H., Yang M. H., Noh J. Y., Park S. Y., Lee T. Y., Yook Y. J., Yoo K. H., Roh K. J., Kim I., Hwang Y. H., Oh G. T., Seong J. K., Ahn C., Lee H. W., Park J. H. (2009) Cyst formation in kidney via B-Raf signaling in the PKD2 transgenic mice. J. Biol. Chem. 284, 7214–7222 [DOI] [PMC free article] [PubMed] [Google Scholar]
- 11. Boletta A., Qian F., Onuchic L. F., Bhunia A. K., Phakdeekitcharoen B., Hanaoka K., Guggino W., Monaco L., Germino G. G. (2000) Polycystin-1, the gene product of PKD1, induces resistance to apoptosis and spontaneous tubulogenesis in MDCK cells. Mol. Cell 6, 1267–1273 [DOI] [PubMed] [Google Scholar]
- 12. Patel V., Hajarnis S., Williams D., Hunter R., Huynh D., Igarashi P. (2012) MicroRNAs regulate renal tubule maturation through modulation of Pkd1. J. Am. Soc. Nephrol. 23, 1941–1948 [DOI] [PMC free article] [PubMed] [Google Scholar]
- 13. Ong A. C., Harris P. C., Davies D. R., Pritchard L., Rossetti S., Biddolph S., Vaux D. J., Migone N., Ward C. J. (1999) Polycystin-1 expression in PKD1, early-onset PKD1, and TSC2/PKD1 cystic tissue. Kidney Int. 56, 1324–1333 [DOI] [PubMed] [Google Scholar]
- 14. Geng L., Segal Y., Peissel B., Deng N., Pei Y., Carone F., Rennke H. G., Glücksmann-Kuis A. M., Schneider M. C., Ericsson M., Reeders S. T., Zhou J. (1996) Identification and localization of polycystin, the PKD1 gene product. J. Clin. Invest. 98, 2674–2682 [DOI] [PMC free article] [PubMed] [Google Scholar]
- 15. Lee Y. S., Lim K. H., Guo X., Kawaguchi Y., Gao Y., Barrientos T., Ordentlich P., Wang X. F., Counter C. M., Yao T. P. (2008) The cytoplasmic deacetylase HDAC6 is required for efficient oncogenic tumorigenesis. Cancer Res. 68, 7561–7569 [DOI] [PMC free article] [PubMed] [Google Scholar]
- 16. Cheng J., Moyer B. D., Milewski M., Loffing J., Ikeda M., Mickle J. E., Cutting G. R., Li M., Stanton B. A., Guggino W. B. (2002) A Golgi-associated PDZ domain protein modulates cystic fibrosis transmembrane regulator plasma membrane expression. J. Biol. Chem. 277, 3520–3529 [DOI] [PubMed] [Google Scholar]
- 17. Wodarczyk C., Rowe I., Chiaravalli M., Pema M., Qian F., Boletta A. (2009) A novel mouse model reveals that polycystin-1 deficiency in ependyma and choroid plexus results in dysfunctional cilia and hydrocephalus. PLoS One. 4, e7137. [DOI] [PMC free article] [PubMed] [Google Scholar]
- 18. Li A., Davila S., Furu L., Qian Q., Tian X., Kamath P. S., King B. F., Torres V. E., Somlo S. (2003) Mutations in PRKCSH cause isolated autosomal dominant polycystic liver disease. Am. J. Hum. Genet. 72, 691–703 [DOI] [PMC free article] [PubMed] [Google Scholar]
- 19. Drenth J. P., te Morsche R. H., Smink R., Bonifacino J. S., Jansen J. B. (2003) Germline mutations in PRKCSH are associated with autosomal dominant polycystic liver disease. Nat. Genet. 33, 345–347 [DOI] [PubMed] [Google Scholar]
- 20. Liang G., Li Q., Tang Y., Kokame K., Kikuchi T., Wu G., Chen X. Z. (2008) Polycystin-2 is regulated by endoplasmic reticulum-associated degradation. Hum. Mol. Genet. 17, 1109–1119 [DOI] [PubMed] [Google Scholar]
- 21. Gao H., Wang Y., Wegierski T., Skouloudaki K., Pütz M., Fu X., Engel C., Boehlke C., Peng H., Kuehn E. W., Kim E., Kramer-Zucker A., Walz G. (2010) PRKCSH/80K-H, the protein mutated in polycystic liver disease, protects polycystin-2/TRPP2 against HERP-mediated degradation. Hum. Mol. Genet. 19, 16–24 [DOI] [PubMed] [Google Scholar]
- 22. Fedeles S. V., Tian X., Gallagher A. R., Mitobe M., Nishio S., Lee S. H., Cai Y., Geng L., Crews C. M., Somlo S. (2011) A genetic interaction network of five genes for human polycystic kidney and liver diseases defines polycystin-1 as the central determinant of cyst formation. Nat. Genet. 43, 639–647 [DOI] [PMC free article] [PubMed] [Google Scholar]
- 23. Xiong R., Siegel D., Ross D. (2013) The activation sequence of cellular protein handling systems after proteasomal inhibition in dopaminergic cells. Chem. Biol. Interact. 204, 116–124 [DOI] [PMC free article] [PubMed] [Google Scholar]
- 24. Kirkin V., McEwan D. G., Novak I., Dikic I. (2009) A role for ubiquitin in selective autophagy. Mol. Cell 34, 259–269 [DOI] [PubMed] [Google Scholar]
- 25. Wu W. K., Sakamoto K. M., Milani M., Aldana-Masankgay G., Fan D., Wu K., Lee C. W., Cho C. H., Yu J., Sung J. J. (2010) Macroautophagy modulates cellular response to proteasome inhibitors in cancer therapy. Drug Resist. Updat. 13, 87–92 [DOI] [PubMed] [Google Scholar]
- 26. Rodriguez-Gonzalez A., Lin T., Ikeda A. K., Simms-Waldrip T., Fu C., Sakamoto K. M. (2008) Role of the aggresome pathway in cancer. Targeting histone deacetylase 6-dependent protein degradation. Cancer Res. 68, 2557–2560 [DOI] [PubMed] [Google Scholar]
- 27. Simms-Waldrip T., Rodriguez-Gonzalez A., Lin T., Ikeda A. K., Fu C., Sakamoto K. M. (2008) The aggresome pathway as a target for therapy in hematologic malignancies. Mol. Genet. Metab. 94, 283–286 [DOI] [PMC free article] [PubMed] [Google Scholar]
- 28. McConkey D. J., White M., Yan W. (2012) HDAC inhibitor modulation of proteotoxicity as a therapeutic approach in cancer. Adv. Cancer Res. 116, 131–163 [DOI] [PubMed] [Google Scholar]
- 29. Dallavalle S., Pisano C., Zunino F. (2012) Development and therapeutic impact of HDAC6-selective inhibitors. Biochem. Pharmacol. 84, 756–765 [DOI] [PubMed] [Google Scholar]
- 30. Hideshima T., Bradner J. E., Wong J., Chauhan D., Richardson P., Schreiber S. L., Anderson K. C. (2005) Small-molecule inhibition of proteasome and aggresome function induces synergistic antitumor activity in multiple myeloma. Proc. Natl. Acad. Sci. U.S.A. 102, 8567–8572 [DOI] [PMC free article] [PubMed] [Google Scholar]
- 31. Yamamoto A., Tagawa Y., Yoshimori T., Moriyama Y., Masaki R., Tashiro Y. (1998) Bafilomycin A1 prevents maturation of autophagic vacuoles by inhibiting fusion between autophagosomes and lysosomes in rat hepatoma cell line, H-4-II-E cells. Cell Struct. Funct. 23, 33–42 [DOI] [PubMed] [Google Scholar]
- 32. Tanida I., Minematsu-Ikeguchi N., Ueno T., Kominami E. (2005) Lysosomal turnover, but not a cellular level, of endogenous LC3 is a marker for autophagy. Autophagy. 1, 84–91 [DOI] [PubMed] [Google Scholar]
- 33. Mizushima N., Yoshimori T. (2007) How to interpret LC3 immunoblotting. Autophagy 3, 542–545 [DOI] [PubMed] [Google Scholar]
- 34. Lee J. Y., Koga H., Kawaguchi Y., Tang W., Wong E., Gao Y. S., Pandey U. B., Kaushik S., Tresse E., Lu J., Taylor J. P., Cuervo A. M., Yao T. P. (2010) HDAC6 controls autophagosome maturation essential for ubiquitin-selective quality-control autophagy. EMBO J. 29, 969–980 [DOI] [PMC free article] [PubMed] [Google Scholar]
- 35. Chauvet V., Qian F., Boute N., Cai Y., Phakdeekitacharoen B., Onuchic L. F., Attié-Bitach T., Guicharnaud L., Devuyst O., Germino G. G., Gubler M. C. (2002) Expression of PKD1 and PKD2 transcripts and proteins in human embryo and during normal kidney development. Am. J. Pathol. 160, 973–983 [DOI] [PMC free article] [PubMed] [Google Scholar]
- 36. Merrick D., Chapin H., Baggs J. E., Yu Z., Somlo S., Sun Z., Hogenesch J. B., Caplan M. J. (2012) The γ-secretase cleavage product of polycystin-1 regulates TCF and CHOP-mediated transcriptional activation through a p300-dependent mechanism. Dev. Cell 22, 197–210 [DOI] [PMC free article] [PubMed] [Google Scholar]
- 37. Ramasubbu K., Gretz N., Bachmann S. (1998) Increased epithelial cell proliferation and abnormal extracellular matrix in rat polycystic kidney disease. J. Am. Soc. Nephrol. 9, 937–945 [DOI] [PubMed] [Google Scholar]
- 38. Qian F., Boletta A., Bhunia A. K., Xu H., Liu L., Ahrabi A. K., Watnick T. J., Zhou F., Germino G. G. (2002) Cleavage of polycystin-1 requires the receptor for egg jelly domain and is disrupted by human autosomal-dominant polycystic kidney disease 1-associated mutations. Proc. Natl. Acad. Sci. U.S.A. 99, 16981–16986 [DOI] [PMC free article] [PubMed] [Google Scholar]
- 39. Montesano R., Matsumoto K., Nakamura T., Orci L. (1991) Identification of a fibroblast-derived epithelial morphogen as hepatocyte growth factor. Cell 67, 901–908 [DOI] [PubMed] [Google Scholar]
- 40. Liang G., Yang J., Wang Z., Li Q., Tang Y., Chen X. Z. (2008) Polycystin-2 down-regulates cell proliferation via promoting PERK-dependent phosphorylation of eIF2alpha. Hum. Mol. Genet. 17, 3254–3262 [DOI] [PubMed] [Google Scholar]
- 41. Grimm D. H., Karihaloo A., Cai Y., Somlo S., Cantley L. G., Caplan M. J. (2006) Polycystin-2 regulates proliferation and branching morphogenesis in kidney epithelial cells. J. Biol. Chem. 281, 137–144 [DOI] [PubMed] [Google Scholar]
- 42. Tian Y., Kolb R., Hong J. H., Carroll J., Li D., You J., Bronson R., Yaffe M. B., Zhou J., Benjamin T. (2007) TAZ promotes PC2 degradation through a SCFβ-Trcp E3 ligase complex. Mol. Cell. Biol. 27, 6383–6395 [DOI] [PMC free article] [PubMed] [Google Scholar]