Background: Cytosine hydroxymethylation in the genomic DNA controls gene expression.
Results: Treatment of primary chondrocytes with IL-1β alone or in conjunction with TNF-α inhibited TET1 and IDH expression and suppressed cytosine hydroxymethylation.
Conclusion: IL-1β and TNF-α decrease DNA hydroxymethylation by suppressing the expression and activity of TET1 and IDH.
Significance: Pro-inflammatory cytokines likely control gene expression by modulating the 5-hmC levels.
Keywords: Chondrocytes, Cytokine, Dioxygenase, DNA Methylation, Epigenetics, 5-hmC, IL-1, TNF-α
Abstract
5-Hydroxymethylcytosine (5-hmC) generated by ten-eleven translocation 1–3 (TET1–3) enzymes is an epigenetic mark present in many tissues with different degrees of abundance. IL-1β and TNF-α are the two major cytokines present in arthritic joints that modulate the expression of many genes associated with cartilage degradation in osteoarthritis. In the present study, we investigated the global 5-hmC content, the effects of IL-1β and TNF-α on 5-hmC content, and the expression and activity of TETs and isocitrate dehydrogenases in primary human chondrocytes. The global 5-hmC content was found to be ∼0.1% of the total genome. There was a significant decrease in the levels of 5-hmC and the TET enzyme activity upon treatment of chondrocytes with IL-1β alone or in combination with TNF-α. We observed a dramatic (10–20-fold) decrease in the levels of TET1 mRNA expression and a small increase (2–3-fold) in TET3 expression in chondrocytes stimulated with IL-1β and TNF-α. IL-1β and TNF-α significantly suppressed the activity and expression of IDHs, which correlated with the reduced α-ketoglutarate levels. Whole genome profiling showed an erasure effect of IL-1β and TNF-α, resulting in a significant decrease in hydroxymethylation in a myriad of genes including many genes that are important in chondrocyte physiology. Our data demonstrate that DNA hydroxymethylation is modulated by pro-inflammatory cytokines via suppression of the cytosine hydroxymethylation machinery. These data point to new mechanisms of epigenetic control of gene expression by pro-inflammatory cytokines in human chondrocytes.
Introduction
Epigenetic modifications of the mammalian genome have been shown to regulate gene expression during embryonic development, stem cell differentiation, and cancer development. Distribution and function of 5-methylcytosine (5-mC)2 are well known. 5-Hydroxymethylcytosine (5-hmC) was recently discovered as a new epigenetic mark widely distributed in all types of tissues with varying degrees of abundance (1). The highest levels of 5-hmC are found in brain (2, 3) and in embryonic stem cells (3). 5-hmC is generated by the oxidation of 5-mC by ten-eleven translocation (TET) family of enzymes (TET1, TET2, and TET3) (4). 5-hmC plays an important role in the regulation of gene expression by acting as an intermediate state of complete demethylation as well as by modulating the binding of the factors responsible for regulation of transcription (5).
Pro-inflammatory cytokines IL-1β and TNF-α are the two major factors that are up-regulated during joint diseases including osteoarthritis (OA) and rheumatoid arthritis. High levels of these cytokines have been shown to modulate the expression of many genes in chondrocytes, resulting in the activation of catabolic mechanisms that cause the damage to articular cartilage. Several recent studies have shown significant demethylation at specific sites in the promoter regions of important genes involved in cartilage catabolism such as MMP-13, ADAMTS-4, and IL-1β in OA chondrocytes compared with normal chondrocytes or in OA chondrocytes in response to cytokines (6–10). These data demonstrate the involvement of epigenetic DNA modifications in cartilage degradation in OA.
In the present study, we determined whether pro-inflammatory cytokines IL-1β and TNF-α regulate gene expression in human chondrocytes by modulating the levels of 5-hmC. We investigated the global 5-hmC content in primary human chondrocytes isolated from OA patients. We also investigated whether IL-1β and TNF-α, alone or in combination, modulate the expression and activity of TET enzymes, gene expression of isocitrate dehydrogenases 1 and 2 (IDH1 and IDH2, respectively), total IDH enzyme activity, α-ketoglutarate (α-KG) levels, and global as well as locus-specific DNA hydroxymethylation in human chondrocytes.
EXPERIMENTAL PROCEDURES
Reagents
All the media and reagents for cell culture were purchased either from HyClone Laboratories (Logan, UT) or from Invitrogen. Primocin was purchased from InvivoGen (San Diego, CA). Pronase and collagenase were purchased from Roche Diagnostics. Recombinant human IL-1β and TNF-α were purchased from R&D Systems. BAY 11-7082 and MG-132 were from EMD Millipore. Nucleoside standards for LC-MS/MS analysis were obtained from Berry & Associates (Dexter, MI). Gene-specific TaqMan assays were purchased from Invitrogen. α-KG was purchased from Sigma-Aldrich.
Human Cartilage Samples and Preparation of Primary Chondrocytes
The study protocol was reviewed and approved by the Institutional Review Board of Northeast Ohio Medical University, Rootstown, OH, as exempt, and no informed consent was needed. Discarded and de-identified knee or hip joint tissue samples were from the patients who underwent total joint replacement surgery at Summa St. Thomas Hospital, Akron, OH. Cartilage was resected from macroscopically unaffected areas (no staining with India ink, smooth cartilage). Human chondrocytes were prepared from cartilage pieces by sequential digestion with Pronase (1 mg/ml) for 1 h followed by collagenase (1 mg/ml) overnight essentially as described previously (11, 12).
Treatment of Primary Human Chondrocytes with TNF-α, IL-1β, BAY 11-7082, and MG-132
Primary human chondrocytes (1 × 10⁶/60-mm dish) were allowed to grow in Dulbecco's modified Eagle's medium (DMEM) supplemented with 10% fetal calf serum (FCS), 100 units/ml penicillin, and 100 mg/ml streptomycin for 2–3 days after plating. Only primary (unpassaged) chondrocytes were used in the experiments. At approximately 80% confluence, chondrocytes were serum-starved for 12–15 h and were then treated with BAY 11-7082 or MG-132 for 2 h followed by treatment with human recombinant IL-1β and/or TNF-α for different times. Chondrocytes not treated with inhibitors, IL-1β or TNF-α served as controls. All experiments were completed within 3 days of culture initiation to avoid dedifferentiation of chondrocytes.
DNA Isolation and Determination of Global 5-hmC Levels
Genomic DNA from the primary human chondrocytes was isolated using DNeasy kit (Qiagen) according to the instructions provided with the kit. Briefly, cells were harvested from a 60-mm dish by scraping and were resuspended in 200 μl of PBS. Cells were incubated at room temperature in 20 μl of proteinase K and 10 μl of 32 mg/ml RNase A (Sigma-Aldrich) for 5 min. Buffer AL was added to the cells and incubated at 56 °C for 10 min followed by addition of 100% ethanol. The mixture was applied to a spin column, and the bound DNA was washed with buffers AW1 and AW2 and eluted in 200 μl of elution buffer. The concentration and quality of the DNA were determined by UV absorption analysis using NanoDrop spectrophotometer (Thermo Fisher Scientific).
Global 5-hmC levels in the genomic DNA were estimated by a fluorescence-based ELISA kit, which uses a 5-hmC-specific antibody (Epigentek, Farmingdale, NY) essentially according to the manufacturer's recommendations. One hundred ng of total genomic DNA was used for this assay, and the absolute quantity of 5-hmC in the DNA samples was determined based on a standard curve generated by using a control DNA provided with the kit. All samples were run in duplicate, and reproducibility of the data was confirmed in cartilage samples obtained from at least three donors.
LC-MS/MS Analysis of Hydrolyzed Genomic DNA
LC-MS/MS analysis was performed using a Nexera2 LC system (Shimadzu Corporation, Kyoto, Japan) connected to a triple quadrupole mass spectrometer (LC-MS 8040; Shimadzu, Kyoto, Japan) equipped with an electrospray ionization (ESI) source. Chromatographic separation was performed at 30 °C using a SUPELCOSIL LC-18-S HPLC analytical column (5-μm particle size, 25-cm length × 4.6-mm inner diameter; Sigma-Aldrich). We developed a LC protocol using standard nucleosides, dC, 5-mdC, and 5-hmdC by modifying the method described by Pomerantz and McCloskey (13) using 20 mm ammonium acetate, pH 6.0 (A) and 40% acetonitrile+60% water (B) and a flow rate of 0.7 ml/min. Initial separation was done at 5% B for 11 min followed by 15% B for 6 min.
One μg of purified genomic DNA from human chondrocytes was hydrolyzed using a DNA Degradase kit (Zymo Research) for >2 h. The digested DNA was diluted 1:1 with mobile phase (95% A + 5% B) before injection. Different forms of cytosines were identified by running MS/MS multiple reaction monitoring in positive ion mode (MRM+) and by monitoring transition pairs of m/z 228.1 (precursor ion)/112.1 (product ion) for dC, m/z 242.1/126.1 for 5-mdC, and m/z 258.1/142.1 for 5-hmdC. Heat block temperature was set at 500 °C, and the drying gas (N2) was used at a flow rate of 15 liters/min.
RNA Isolation and Real-time PCR Analysis of Gene Expression
Total RNA was isolated using RNeasy Mini kit (Qiagen) on a Qiacube automated sample preparation platform (Qiagen) according to the manufacturer's instructions. Total RNA concentration was determined by absorbance at 260 nm using NanoDrop spectrophotometer. cDNA synthesis was performed using the QuantiTect reverse transcription kit (Qiagen) using 500 ng of total RNA according to the instructions provided with the kit. Two μl from a 20-μl cDNA synthesis reaction mixture was used for TaqMan assays using the StepOne Plus real-time PCR system (Applied Biosystems/Invitrogen). Relative quantification was performed using ΔΔCT method with β-actin as an endogenous control.
Determination of Total TET Activity
Total TET activity was estimated by fluorescence-based ELISA kit according to the instructions provided by the manufacturer (Epigentek). This assay involves the conversion of 5-mC substrate coated onto the microplate wells by the TET enzymes in the sample resulting in conversion of 5-mC to 5-hmC, which in turn is detected fluorometrically using a specific antibody. Nuclear extracts were prepared from the treated chondrocytes using a nuclear extract preparation kit (Active Motif, Carlsbad, CA), and 5 μg of the nuclear extract was used for the TET activity assay. Data are expressed as relative fluorescence units (mean ± S.D.).
Determination of Total IDH Activity and α-KG Levels
Total IDH activity was determined by a colorimetric IDH activity assay kit (Sigma-Aldrich) essentially according to the manufacturer's instructions. This assay involves the generation of colorimetric product from isocitrate by the IDH enzymes present in the samples. Treated cells were lysed in IDH assay buffer, and 40 μg of the total cellular protein was used for the assay. Measurements of A450 at 0 min and at 65 min were performed and used for the calculation of the enzyme activity. Data were expressed as total activity/μg of total cellular protein (mean ± S.D.).
α-KG levels were estimated in the culture supernatants by LC-MS/MS analysis. Chromatographic separation was performed at 30 °C using a Kinetex C-18 HPLC analytical column (1.7-μm particle size, 100-mm length × 2.1-mm inner diameter; Phenomenex Inc., Torrance, CA). Elutions were carried out using 0.1% formic acid in water (solvent A) and 0.1% formic acid in methanol (solvent B) at a flow rate of 0.5 ml/min. The following gradient scheme was used for elution: 0–0.2 min isocratic 5% B, 0.2–1.0 min linear gradient from 5% B to 90% B, 1.0–1.5 min isocratic 90% B, 1.5–1.8 min linear gradient from 90% to 5% B; finally, the column was equilibrated to initial condition of 5% B from 1.8 to 3.0 min. Standards and samples were diluted 1:5 in an acidified injection solvent (50% of 5% formic acid in water + 50% of 5% formic acid in acetonitrile) before column injection (injection volume 10 μl).
The mass spectrometric analyses for α-KG quantitation in cleared culture supernatants were performed on the MS/MS system described above using the ESI ion source in multiple reaction monitoring and negative ion mode (MRM−) by monitoring transition pairs of m/z 144.9 (precursor ion)/57.0 (product ion). The following settings were used: heat block temperature, 500 °C; DL temperature, 250 °C; nebulizing gas (N2), 3 liters/min; drying gas (N2), 15 liters/min; collision energy, 10.0; dwell time, 200 ms. A calibration curve was prepared using pure α-KG dissolved in DMEM at the concentrations of 0.001, 0.005, 0.01, 0.1, and 1 mg/ml.
Whole Genome Profiling of 5-hmC
5-Hydroxymethylation in chondrocyte genomic DNA was profiled by reduced representation hydroxymethylation profiling method. Genomic DNA from treated and untreated cells was fragmented with MspI (NEB), with heat inactivation of the enzyme followed by purification of the resultant fragments with the DNA Clean and Concentrator kit (Zymo Research). Purified fragments were ligated with T4 DNA ligase to TruSeq-style adapters, wherein the CCGG site was reconstituted at the P5 junction but not at the P7 junction. All adapter and PCR oligonucleotides were synthesized by IDT. Following brief extension with GoTaq (Promega), the library was glucosylated with T4 β-glucosyltransferase (Zymo Research) and then subjected to a final round of MspI digestion to eliminate fragments lacking glucosylation at the adapter junction. After heat inactivation of the enzyme and purification, libraries were subjected to limited amplification with QuestTaq (Zymo Research) with indexing, adapter-specific primers. Following purification and quantification, libraries were sequenced with 50-base paired-end reads on the HiSeq2000 platform (Illumina). FASTQ data were filtered for the CCGG tag and aligned to hg19 (or mm9) with Bowtie.
Statistical Analyses
Each experiment was repeated on primary chondrocytes obtained from at least three donors (n = 3) to ensure reproducibility of the data. All of the experiments were performed in duplicate. Values shown are mean ± S.D. and were compared using a two-tailed Student's t test. A p value <0.05 was considered significant. Data were plotted using the Origin 8.1 software.
RESULTS
Estimation of 5-hmC in Chondrocytes by LC-MS/MS
A LC chromatogram of standard nucleosides dC, 5-mdC, and 5-hmdC is shown in Fig. 1A. We modified the LC protocol previously described by Pomerantz and McCloskey (13) by reducing the concentration of ammonium acetate from 250 to 20 mm, resulting in improved ionization in the subsequent MS analysis. We also used a simpler gradient profile to reduce the analysis time as there were fewer analytes in our experiments. Both dC and hmdC eluted at 5% B, and mdC eluted at 15% B.
FIGURE 1.
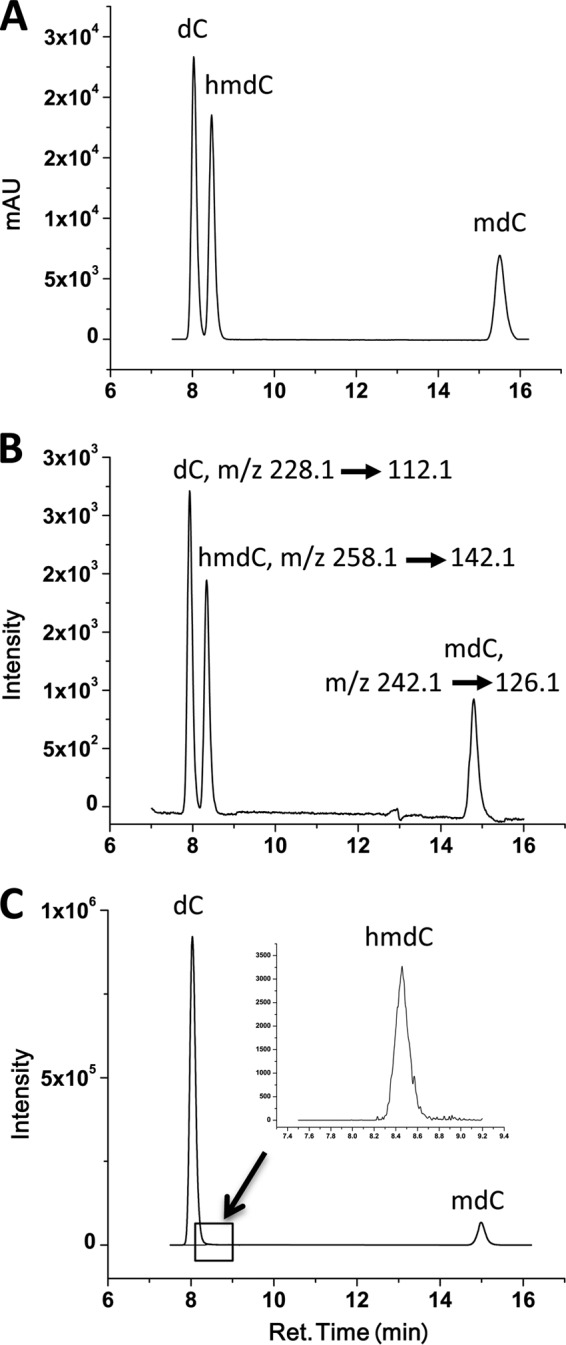
LC-MS/MS identification of 5-hmC in human primary chondrocytes. A, liquid chromatography of nucleoside standards dC, hmdC, and mdC. Shown are the HPLC chromatograms (mA, 254 nm) on a SUPELCOSIL LC-18-S HPLC column (5 μm, 25 cm × 4.6 mm). We used 20 mm ammonium acetate, pH 6.0 (A), and 40% acetonitrile+60% water (B) as mobile phases at a flow rate of 0.7 ml/min. Initial separation was performed at 5% B for 11 min followed by 15% B for next 6 min. B, LC-ESI of nucleoside standards dC, hmdC, and mdC. Eluants from the column separated as in A were directed to a mass spectrometer set up to run in positive multiple reaction (MRM+) mode detecting the transitions m/z 228.1/112.1 for dC, m/z, m/z 258.1/142.1 for 5-hmdC and 242.1/126.1 for 5-mdC. C, LC-MS/MS analysis of genomic DNA isolated from primary human chondrocytes. One μg of genomic DNA was hydrolyzed using DNA Degradase kit in a 30-μl reaction volume for >2 h. The hydrolyzed DNA was diluted 1:1 with initial mobile phase (95% A+ 5% B) and injected (10 μl of diluted reaction mix) for LC-MS/MS analysis as described in A and B, and under “Experimental Procedures.”
Fig. 1B shows the LC-ESI-MS/MS-MRM+ chromatogram of standard nucleosides dC, mdC, and hmdC. The separated analytes were directed to a Shimadzu 8040 triple Quad mass spectrometer. First, we optimized the best transition using the MRM optimization wizard included in the operating software. The best parameters and transitions were chosen for subsequent MRM analysis. Transitions m/z 228.1 > 112.1 for dC, m/z 258.1 > 142.1 for 5-hmdC, and m/z 242.1 > 126.1 for 5-mdC showed the highest intensities. These transitions are produced by collision-induced dissociation of protonated nucleosides through breakage of the glycosidic bonds.
Fig. 1C shows the LC-ESI-MS/MS-MRM+ chromatogram of genomic DNA isolated from primary human chondrocytes and analyzed using the same conditions as described for nucleoside standards. Absolute concentrations of nucleosides in the genomic DNA were estimated using the peak area based on the calibration curve produced from the standards. We observed approximately 7% of the total cytosine (1.6% of total DNA) to be methylated and ∼0.4% (0.1% of total DNA) to be hydroxymethylated in human chondrocytes.
IL-1β and TNF-α Inhibit Global 5-hmC Levels in Human Primary Chondrocytes
5-hmC content in the genomic DNA in different human adult tissues ranges from 0.1% to 0.7% of total DNA (1). In this study the global 5-hmC content in human chondrocytes estimated by an ELISA was found to be 0.1% of total genomic DNA. There was a significant decrease in the levels of 5-hmC content upon treatment with IL-1β alone and in combination with TNF-α for 24 and 48 h (Fig. 2). There was >50% loss in global 5-hmC content upon treatment with both the cytokines in combination for 24 h and ∼75% upon treatment for 48 h.
FIGURE 2.
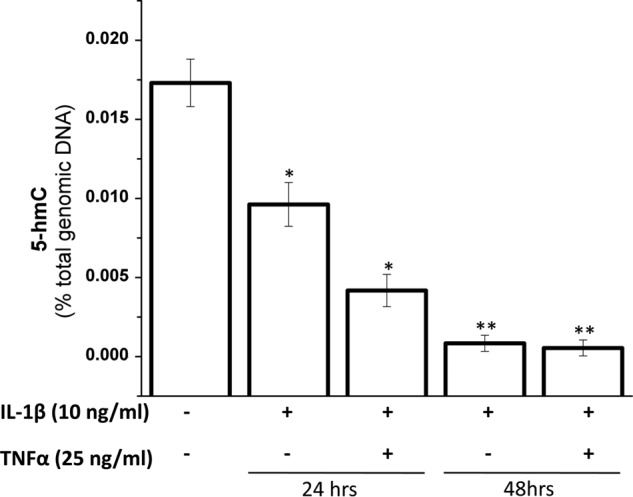
Inhibition of global 5-hmC levels by IL-1β and TNF-α. Human primary chondrocytes isolated from deep zone OA cartilage were treated with IL-1β and TNF-α for indicated times. After the treatments, genomic DNA was isolated using a DNeasy kit and quantitated by spectrophotometry (A260) using NanoDrop. 100 ng of total genomic DNA was used to estimate the global 5-hmC levels by an ELISA-based 5-hmC DNA quantitation kit (Epigentek). Data are presented as relative fluorescence units (mean ± S.D. (error bars); *, p < 0.05; **, p < 0.01).
IL-1β and TNF-α Inhibit the Expression of TET1 mRNA in Human Primary Chondrocytes
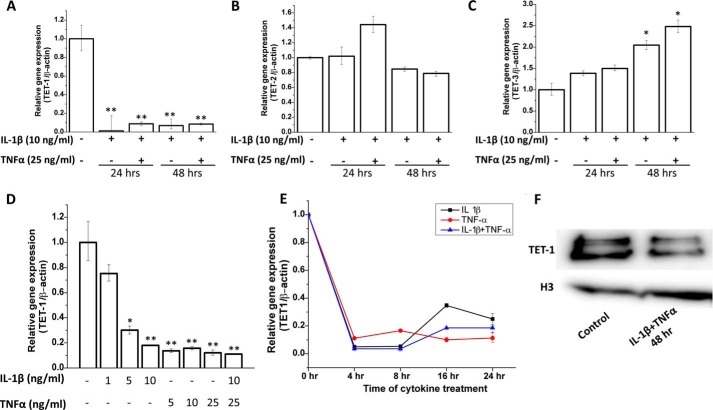
We next investigated whether there were any changes in expression levels of the TET genes upon treatment with IL-1β and TNF-α. We found a dramatic (>10-fold) decrease in the expression of TET1 mRNA upon treatment with IL-1β alone or in combination with TNF-α (Fig. 3A). There was no significant change in the expression of TET2 mRNA (Fig. 3B) and a nominal increase in TET3 expression (Fig. 3C). We next carried out a dose-response experiment to check the effect of different concentrations of the cytokines on TET1 mRNA expression. We found that whereas there was a dose-dependent decrease in TET1 expression upon treatment with IL-1β and there was maximum down-regulation by IL-1β at 10 ng/ml, TNF-α was able to cause maximum reduction even at the lowest dose used (5 ng/ml) (Fig. 3D). Time course analysis showed a maximum decrease in TET1 mRNA levels within 4 h that was sustained until 8 h, and then there was a slight increase at 16 and 24 h (Fig. 3E). At the protein level, we found a visible decrease upon treatment with IL-1β and TNF-α together for 48 h (Fig. 3F).
FIGURE 3.
Regulation of gene expression of TETs by IL-1β and TNF-α. Human primary chondrocytes isolated from deep zone OA cartilage were treated with IL-1β and TNF-α for the indicated times (24 h or 48 h). Total RNA was isolated using the RNeasy kit and quantitated by spectrophotometry (A260) using NanoDrop. A and B, cDNA synthesis was performed using a QuantiTect reverse transcription kit. mRNA levels of TET1 (A), TET2 (B), and TET3 (C) were quantitated by real time PCR using TaqMan assay (Applied Biosystems). D, a dose-response study was performed to assess the effect of different amounts of cytokines on mRNA levels of TET1 after treatment for 24 h. E, a time course analysis shows the effect of IL-1β, TNF-α, and IL-1β+TNF-α on gene expression of TET1 from 4 to 24 h. Data are presented as relative gene expression compared with β-actin (mean ± S.D. (error bars); *, p < 0.05; **, p < 0.01). F, effect of IL-1β and TNF-α treatment on TET1 protein expression is shown. Nuclear extracts were prepared from untreated and human primary chondrocytes treated with IL-1β+TNF-α for 24 h, and Western immunoblotting was carried out using anti-TET1 antibody. Histone H3 was used as a loading control.
IL-1β Inhibits Total TET Activity in Human Primary Chondrocytes
A family of TET enzymes is responsible for generation and maintenance of 5-hmC levels in the genomic DNA. We utilized an ELISA to determine whether the loss of global 5-hmC content upon treatment with IL-1β and TNF-α in human chondrocytes was due to an overall decrease in the activity of TET enzymes. Indeed, total TET activity decreased by 35% upon treatment with both the cytokines in combination for 24 h and 48 h compared with the activity present in untreated chondrocytes (Fig. 4). This loss of enzyme activity could explain the reduction in the 5-hmC content observed above (Fig. 2).
FIGURE 4.
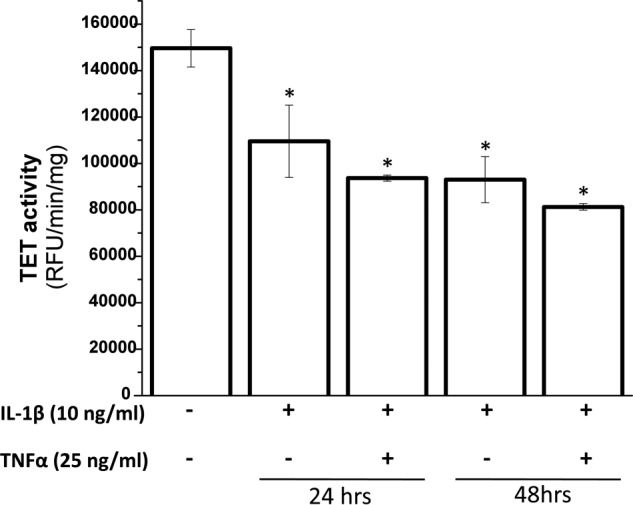
Inhibition of total TET activity by IL-1β and TNF-α. Human primary chondrocytes isolated from deep zone OA cartilage were treated with IL-1β and TNF-α for the indicated times. Following treatments nuclear extracts were prepared by standard method. 5 μg of cleared nuclear extract was used to estimate the total TET activity by an ELISA-based kit. Data are presented as relative fluorescence unit (RFU) (mean ± S.D. (error bars); *, p < 0.05).
IL-1β and TNF-α Inhibit the Expression of TET1 mRNA by Activating the NF-κB Pathway
Activation of NF-κB is one of the most important mechanisms utilized by both IL-1β and TNF-α in their biological actions. Therefore, we used small molecule inhibitors of NF-κB, BAY 11-7082, and MG-132 to check the involvement of NF-κB in the regulation of global 5-hmC levels and TET1 expression. Surprisingly, the down-regulation of TET1 gene expression and decrease in global 5-hmC caused by the cytokines was completely blocked by NF-κB inhibitors in chondrocytes treated with IL-1β and TNF-α (Fig. 5A) suggesting that cytokine-induced activation of NF-κB is a negative regulator of TET1 gene expression in human chondrocytes. Suppression of TET1 expression was not abrogated when cellular translation was blocked by treatment with cycloheximide, suggesting that the suppressive effect did not require de novo protein synthesis (Fig. 5B).
FIGURE 5.
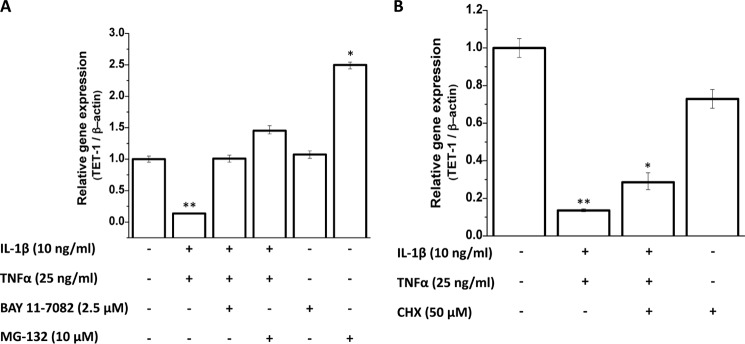
Mechanism of regulation of gene expression of TET1 by IL-1β and TNF-α. A, human primary chondrocytes isolated from deep zone OA cartilage were pre-treated with NF-κB inhibitors BAY 11-7082 and MG-132 for 1 h followed by treatment with IL-1β and TNF-α for 24 h. mRNA levels of TET1 were quantitated by real-time PCR. B, cells were pre-treated with translation inhibitor cycloheximide (CHX) for 1 h followed by treatment with IL-1β and TNF-α for 24 h. mRNA levels of TET1 were quantitated by real-time PCR. Data are presented as relative gene expression compared with β-actin (mean ± S.D. (error bars); *, p < 0.05; **, p < 0.01).
IL-1β and TNF-α Down-regulate the Total Activity of IDH, α-KG Levels, and Gene Expression of IDH1 and IDH2
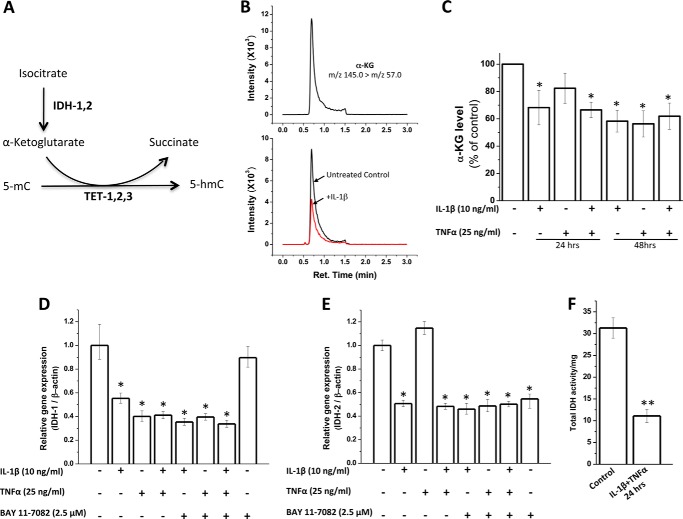
Although the conversion of 5-mC to 5-hmC is directly catalyzed by TET enzymes, this reaction requires the co-factor α-KG (4), which is generated from isocitrate by IDHs (Fig. 6A). Therefore, we next checked whether treatment of human chondrocytes with IL-1β and TNF-α results in any changes in the levels of α-KG and activity and expression of IDH enzymes. There was an approximately 40% decrease in α-KG secreted in the culture supernatant of cytokine-treated chondrocytes compared with untreated chondrocytes as measured by LC-MS/MS (Fig. 6, B and C). There was a significant decrease (∼50–60%) in gene expression of IDH1 (Fig. 6D) and IDH2 (Fig. 6E). The suppressive effect of the cytokines on mRNA levels of IDH1 and IDH2 was not altered in the presence of an NF-κB inhibitor, BAY 11-7082 (Fig. 6, D and E). Fig. 6F shows a decrease in the total activity of IDHs upon treatment of chondrocytes with IL-1β+TNF-α for 24 h.
FIGURE 6.
Regulation of activity and gene expression of IDHs and α-KG levels by IL-1β and TNF-α. A, schematic of conversion of 5-hmC from 5-mC by TET enzymes that use α-KG as a cofactor. B, representative LC-MS/MS MRM chromatograms of 0.01 ng/ml standard α-KG (upper panel) and culture supernatants of chondrocytes untreated (black line) and treated with 10 ng/ml IL-1β for 48 h (red line) (lower panel). C, α-KG levels in culture supernatants of human chondrocytes with or without treatment with cytokines for 24/48 h as measured by LC-MS/MS analysis. Results are expressed as percentage of untreated control. D and E, total RNA was isolated using the RNeasy kit and quantitated by spectrophotometry (A260) using NanoDrop. cDNA synthesis was performed using a QuantiTect reverse-transcription kit. mRNA levels of IDH1 (D) and IDH2 (E) were quantitated by real-time PCR using TaqMan assay. Data are presented as relative gene expression compared with β-actin (mean ± S.D. (error bars)). F, total IDH (NAD+- and NADP+-dependent) activity was measured by IDH assay kit. Data are expressed as total IDH activity/mg of cellular lysate protein (*, p < 0.05; **, p < 0.01).
IL-1β Treatment Results in Genome-wide Reduction in Hydroxymethylation
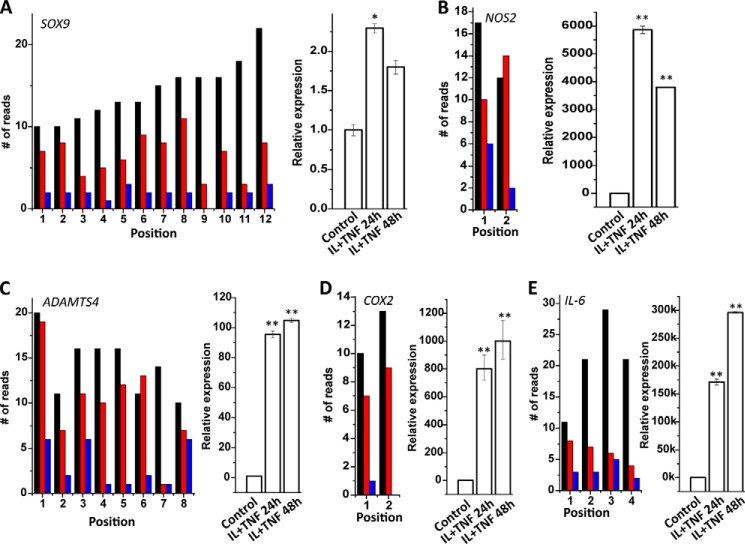
Next we carried out a genome-wide analysis to determine the effect of IL-1β treatment on hydroxymethylation at specific gene loci. We found a significantly lower number of reads in the cells treated with IL-1β in conjunction with TNF-α compared with untreated cells demonstrating a significant decrease in hydroxymethylation. In chondrocytes treated with IL-1β+TNF-α for 48 h there were 975,083 loci that had less read count compared with untreated control cells whereas there were only 73,493 loci that had more read count compared with untreated control cells (Table 1). We also checked the changes in hydroxymethylation content in the promoter regions of selected IL-1β-regulated genes and found a significant decrease in 5-hmC content in the promoters of these genes in chondrocytes treated with IL-1β and TNF-α for 24 h and 48 h (Fig. 7). All of these genes (Fig. 7) are well known to be up-regulated by IL-1β in chondrocytes.
TABLE 1.
Distribution of number of fragments according to read count ratios in samples treated with IL-1β and TNF-α compared with untreated control
| Read counts ratio | 24 h | 48 h |
|---|---|---|
| <1 | 645,656 | 975,083 |
| >1 | 402,920 | 73,493 |
FIGURE 7.
Effect of IL-1β treatment on locus-specific 5-hydroxymethylation levels in the promoter region of selected genes. Human primary chondrocytes were treated with IL-1β (10 ng/ml) for 24 and 48 h. Whole genome analysis of 5-hmC was carried out employing reduced representation hydroxymethylation profiling on the DNA isolated from untreated and treated cells. Number of reads at specific loci in the promoter region of five selected IL-1β-regulated genes was plotted using Origin 8.1 software (black bars, untreated control; red bars, IL-1β+TNF-α-treated for 24 h; blue bars, IL-1β+TNF-α-treated for 48 h). mRNA expression was assayed by TaqMan probes and are expressed as relative expression compared with β-actin.
DISCUSSION
Several recent reports have highlighted the importance of 5-hmC as an epigenetic mark playing vital roles in gene regulation during development (14) and certain disease conditions such as cancer (15). 5-hmC has been shown to be an intermediate in active demethylation of DNA (3) as well as to act as an epigenetic mark, per se, regulating the binding of DNA-binding factors such as TET proteins, some transcription factors, and gene repressors (5). Pro-inflammatory cytokines IL-1β and TNF-α are up-regulated in joints with osteoarthritis, and these cytokines play important roles in the progression of the disease by imparting physiological changes in several cell types, including the chondrocytes that are present in the ailing joints. Recent reports have suggested that these cytokines regulate gene expression in chondrocytes by bringing about epigenetic changes such as CpG methylation of the genomic DNA (7, 8, 10). In the present study we looked at the role of 5-hmC in chondrocyte physiology and whether hydroxymethylation in chondrocytes is modulated by pro-inflammatory cytokines that are important players in the pathophysiology of osteoarthritis.
Here we report the presence of 5-hmC in the genomic DNA of primary human chondrocytes at low levels (0.1% of all nucleotides, ∼0.4% of the total cytosine). This puts chondrocytes in the category of tissues that express medium to low levels of 5-hmC (1). IL-1β and TNF-α suppressed the global levels of 5-hmC by modulating the activity of the TET and IDH enzymes and by specifically down-regulating the expression of TET1, IDH1, and IDH2 genes.
To detect 5-hmC in primary human chondrocytes, we performed LC-MS/MS analysis employing a modified version of a method that was developed by Pomerantz and McCloskey (13) to detect nucleotides and nucleosides by mass spectrometry. This method was recently used by Kriaucionis and Heintz for the detection of 5-hmC in neuronal cells (2).
We further quantitated the global levels of 5-hmC in primary human chondrocytes using a fluorometric ELISA that uses a highly specific antibody against this modified form of cytosine. For absolute quantitation, we prepared a calibration curve using a standard DNA that had 20% of its nucleotides as 5-hmC. Antibody-based quantitation of 5-hmC is being widely used and is considered to be a reliable method for this purpose. Li and Liu have studied the sensitivity and specificity of an ELISA based on this antibody (1). We used the same ELISA method to assess the effects of IL-1β and TNF-α on the levels of 5-hmC and found a significant decrease in the levels of 5-hmC when cells were treated with these cytokines for 24 and 48 h (Fig. 2).
IL-1β and TNF-α brought about the suppression of 5-hmC levels by significantly suppressing the expression and total activity of TET enzymes responsible for the generation of 5-hmC. All the three TET genes, TET1, TET2, and TET3, showed low but similar levels of expression in human chondrocytes. This is interesting because these genes have been shown to be differentially expressed during developmental stages and in mature tissues (5). Most surprisingly, the gene expression of TET1 was dramatically (∼10–20-fold) suppressed by treatment with IL-1β and TNF-α. TET2 expression was largely unaffected, and there was a moderate increase in TET3 expression. We further focused on the effects of these cytokines on TET1 expression to elucidate the mechanism of this phenomenon. Dose-response experiments showed that IL-1β brought about maximum suppression at 10 ng/ml whereas TNF-α showed maximum suppression of the TET1 gene at 5 ng/ml (Fig. 3D). In a separate experiment looking at the time course of this effect, we found a rapid decrease in TET1 mRNA levels within 4 h after treatment with IL-1β and TNF-α alone and when used together, that was largely sustained even after 24 h (Fig. 3E).
IL-1β and TNF-α are known to regulate gene expression by activating the NF-κB pathway. Interestingly, these cytokines were unable to suppress the expression of TET1 in chondrocytes pre-treated with NF-κB inhibitors BAY 11-7082 and MG-132. This suggests that activation of NF-κB negatively regulates the gene expression of TET1. Blockage of cellular translation by cycloheximide could not block the suppression of TET1 expression by IL-1β and TNF-α, suggesting that synthesis of new proteins was not necessary for this effect. Possibly, suppression was caused by changes in the binding or release of some cellular factors or by a change in some cellular signaling events.
α-KG generated by IDH enzymes is a co-factor for the activity of TET enzymes and is essential for their activity in oxidizing 5-mC to 5-hmC (4, 16). In a recent report it was shown that loss of hydroxymethylation during melanoma was mediated by down-regulation of the IDH2 enzyme along with TET enzymes (17). In the present study, we found a significant suppression of total IDH activity in human chondrocytes in the presence of IL-1β and TNF-α. Suppression of IDH enzyme activity was likely due to the suppression of IDH1 and IDH2 gene expression that correlated with reduced α-KG levels in the culture supernatant. These results suggest that IL-1β and TNF-α suppress 5-hmC in human chondrocytes at multiple levels, by suppressing both TET and IDH enzyme activities.
While this study was under way, another group reported that TET1 regulates the expression of IL-1β in THP-1 cell line. Further, TET1 was found to be down-regulated whereas TET2 expression was up-regulated when the monocytes were stimulated by Escherichia coli (18). Our study supports the reported data by showing that stimulation of cells by IL-1β and TNF-α also down-regulates the expression of TET1. However, in chondrocytes, TET2 remains unaffected whereas expression of TET3 was marginally up-regulated. These observations highlight the presence of different mechanisms in different cell types. Both pro-inflammatory cytokines (such as IL-1β and TNF-α) as well as LPS act through the activation of NF-κB, hence, the down-regulation of TET1 in monocytes, as reported earlier (18), and in chondrocytes, as reported here, might be working through the same mechanism.
Our whole genome hydroxymethylation profiling showed a significant decrease in 5-hmC at most of the gene loci analyzed upon treatment with IL-1β and TNF-α for 24 and 48 h (Table 1). There was also a decrease in hydroxymethylation near the transcription start sites of several specific genes that are known to be up-regulated by IL-1β and TNF-α in human chondrocytes (Fig. 7). These data suggest that IL-1β and TNF-α act as general erasures of 5-hmC by suppressing the hydroxymethylation machinery resulting in overexpression of certain genes that are poised to get expressed (5). It will be interesting to know how the removal of 5-hmC from these loci affects the binding of different factors, including TETs and transcription factors, that may have implications in the expression of these genes.
Taken together, the data presented here show the presence of 5-hmC in human chondrocytes that was suppressed by pro-inflammatory cytokines IL-1β and TNF-α. This work also highlights the mechanism of this suppression that involves down-regulation of TET1 and IDH expression and activity. These novel findings may help in better understanding of changes in chondrocyte function brought about by pro-inflammatory cytokines IL-1β and TNF-α in disease conditions such as OA and rheumatoid arthritis.
This work was supported, in whole or in part, by National Institutes of Health Grants AT003627 and AT005520 (to T. M. H.). This work was also supported by the Northeast Ohio Medical University (to T. M. H.).
- 5-mC
- 5-methylcytosine
- dC
- deoxycytosine
- ESI
- electrospray ionization
- 5-hmC
- 5-hydroxymethylcytosine
- IDH
- isocitrate dehydrogenase
- α-KG
- α-ketoglutarate
- MRM+
- multiple reaction monitoring in positive ion mode
- MRM−
- multiple reaction monitoring in negative ion mode
- MS/MS
- tandem mass spectrometry
- OA
- osteoarthritis
- TET
- ten-eleven translocation.
REFERENCES
- 1. Li W., Liu M. (2011) Distribution of 5-hydroxymethylcytosine in different human tissues. J. Nucleic Acids 2011, 870726. [DOI] [PMC free article] [PubMed] [Google Scholar]
- 2. Kriaucionis S., Heintz N. (2009) The nuclear DNA base 5-hydroxymethylcytosine is present in Purkinje neurons and the brain. Science 324, 929–930 [DOI] [PMC free article] [PubMed] [Google Scholar]
- 3. Globisch D., Münzel M., Müller M., Michalakis S., Wagner M., Koch S., Brückl T., Biel M., Carell T. (2010) Tissue distribution of 5-hydroxymethylcytosine and search for active demethylation intermediates. PLoS One 5, e15367. [DOI] [PMC free article] [PubMed] [Google Scholar]
- 4. Tahiliani M., Koh K. P., Shen Y., Pastor W. A., Bandukwala H., Brudno Y., Agarwal S., Iyer L. M., Liu D. R., Aravind L., Rao A. (2009) Conversion of 5-methylcytosine to 5-hydroxymethylcytosine in mammalian DNA by MLL partner TET1. Science 324, 930–935 [DOI] [PMC free article] [PubMed] [Google Scholar]
- 5. Branco M. R., Ficz G., Reik W. (2012) Uncovering the role of 5-hydroxymethylcytosine in the epigenome. Nat. Rev. Genet. 13, 7–13 [DOI] [PubMed] [Google Scholar]
- 6. Cheung K. S., Hashimoto K., Yamada N., Roach H. I. (2009) Expression of ADAMTS-4 by chondrocytes in the surface zone of human osteoarthritic cartilage is regulated by epigenetic DNA de-methylation. Rheumatol. Int. 29, 525–534 [DOI] [PubMed] [Google Scholar]
- 7. Roach H. I., Yamada N., Cheung K. S., Tilley S., Clarke N. M., Oreffo R. O., Kokubun S., Bronner F. (2005) Association between the abnormal expression of matrix-degrading enzymes by human osteoarthritic chondrocytes and demethylation of specific CpG sites in the promoter regions. Arthritis Rheum. 52, 3110–3124 [DOI] [PubMed] [Google Scholar]
- 8. Imagawa K., de Andrés M. C., Hashimoto K., Pitt D., Itoi E., Goldring M. B., Roach H. I., Oreffo R. O. (2011) The epigenetic effect of glucosamine and a nuclear factor-κB (NF-κB) inhibitor on primary human chondrocytes: implications for osteoarthritis. Biochem. Biophys. Res. Commun. 405, 362–367 [DOI] [PMC free article] [PubMed] [Google Scholar]
- 9. Hashimoto K., Oreffo R. O., Gibson M. B., Goldring M. B., Roach H. I. (2009) DNA demethylation at specific CpG sites in the IL1B promoter in response to inflammatory cytokines in human articular chondrocytes. Arthritis Rheum. 60, 3303–3313 [DOI] [PMC free article] [PubMed] [Google Scholar]
- 10. Hashimoto K., Otero M., Imagawa K., de Andrés M. C., Coico J. M., Roach H. I., Oreffo R. O., Marcu K. B., Goldring M. B. (2013) Regulated transcription of human matrix metalloproteinase 13 (MMP13) and interleukin-1β (IL1β) genes in chondrocytes depends on methylation of specific proximal promoter CpG sites. J. Biol. Chem. 288, 10061–10072 [DOI] [PMC free article] [PubMed] [Google Scholar]
- 11. Rasheed Z., Anbazhagan A. N., Akhtar N., Ramamurthy S., Voss F. R., Haqqi T. M. (2009) Green tea polyphenol epigallocatechin-3-gallate inhibits advanced glycation end product-induced expression of tumor necrosis factor-α and matrix metalloproteinase-13 in human chondrocytes. Arthritis Res. Ther. 11, R71. [DOI] [PMC free article] [PubMed] [Google Scholar]
- 12. Haseeb A., Chen D., Haqqi T. M. (2013) Delphinidin inhibits IL-1β-induced activation of NF-κB by modulating the phosphorylation of IRAK-1(Ser-376) in human articular chondrocytes. Rheumatology 52, 998–1008 [DOI] [PMC free article] [PubMed] [Google Scholar]
- 13. Pomerantz S. C., McCloskey J. A. (1990) Analysis of RNA hydrolysates by liquid chromatography-mass spectrometry. Methods Enzymol. 193, 796–824 [DOI] [PubMed] [Google Scholar]
- 14. Ito S., Shen L., Dai Q., Wu S. C., Collins L. B., Swenberg J. A., He C., Zhang Y. (2011) Tet proteins can convert 5-methylcytosine to 5-formylcytosine and 5-carboxylcytosine. Science 333, 1300–1303 [DOI] [PMC free article] [PubMed] [Google Scholar]
- 15. Wossidlo M., Nakamura T., Lepikhov K., Marques C. J., Zakhartchenko V., Boiani M., Arand J., Nakano T., Reik W., Walter J. (2011) 5-Hydroxymethylcytosine in the mammalian zygote is linked with epigenetic reprogramming. Nat. Commun. 2, 241. [DOI] [PubMed] [Google Scholar]
- 16. Ito S., D'Alessio A. C., Taranova O. V., Hong K., Sowers L. C., Zhang Y. (2010) Role of Tet proteins in 5mC to 5hmC conversion, ES-cell self-renewal and inner cell mass specification. Nature 466, 1129–1133 [DOI] [PMC free article] [PubMed] [Google Scholar]
- 17. Lian C. G., Xu Y., Ceol C., Wu F, Larson A., Dresser K., Xu W., Tan L., Hu Y., Zhan Q., Lee C. W., Hu D., Lian B. Q., Kleffel S., Yang Y., Neiswender J., Khorasani A. J., Fang R., Lezcano C., Duncan L. M., Scolyer R. A., Thompson J. F., Kakavand H., Houvras Y., Zon L. I., Mihm M. C., Jr., Kaiser U. B., Schatton T., Woda B. A., Murphy G. F., Shi Y. G. (2012) Loss of 5-hydroxymethylcytosine is an epigenetic hallmark of melanoma. Cell 150, 1135–1146 [DOI] [PMC free article] [PubMed] [Google Scholar]
- 18. Neves-Costa A., Moita L. F. (2013) TET1 is a negative transcriptional regulator of IL-1β in the THP-1 cell line. Mol. Immunol. 54, 264–270 [DOI] [PubMed] [Google Scholar]


