

Background: Can1 is a yeast plasma membrane permease catalyzing specific uptake of arginine.
Results: Two residues in the binding pocket of Can1 affect its selectivity.
Conclusion: Subtle amino acid changes can convert Can1 to a lysine-specific permease.
Significance: Understanding, at the molecular level, the translocation mechanism(s) of yeast amino acid transporters has bearings on our knowledge of other transporters featuring the same fold.
Keywords: Amino Acid Transport, Membrane Proteins, Molecular Modeling, Protein Engineering, Proton Transport, Site-directed Mutagenesis, Transporters, Yeast Physiology, Ligand Docking
Abstract
Amino acid uptake in yeast cells is mediated by about 16 plasma membrane permeases, most of which belong to the amino acid-polyamine-organocation (APC) transporter family. These proteins display various substrate specificity ranges. For instance, the general amino acid permease Gap1 transports all amino acids, whereas Can1 and Lyp1 catalyze specific uptake of arginine and lysine, respectively. Although Can1 and Lyp1 have different narrow substrate specificities, they are close homologs. Here we investigated the molecular rules determining the substrate specificity of the H+-driven arginine-specific permease Can1. Using a Can1-Lyp1 sequence alignment as a guideline and a three-dimensional Can1 structural model based on the crystal structure of the bacterial APC family arginine/agmatine antiporter, we introduced amino acid substitutions liable to alter Can1 substrate specificity. We show that the single substitution T456S results in a Can1 variant transporting lysine in addition to arginine and that the combined substitutions T456S and S176N convert Can1 to a Lyp1-like permease. Replacement of a highly conserved glutamate in the Can1 binding site leads to variants (E184Q and E184A) incapable of any amino acid transport, pointing to a potential role for this glutamate in H+ coupling. Measurements of the kinetic parameters of arginine and lysine uptake by the wild-type and mutant Can1 permeases, together with docking calculations for each amino acid in their binding site, suggest a model in which residues at positions 176 and 456 confer substrate selectivity at the ligand-binding stage and/or in the course of conformational changes required for transport.
Introduction
Transmembrane amino acid transporters are crucial to supplying amino acids to all cells. Most of these transporters belong to one of the largest families of secondary transporters, found in all living organisms, including mammals, plants, and prokaryotes: the amino acid-polyamine-organocation (APC)7 superfamily (1, 2).
In the yeast Saccharomyces cerevisiae, about 16 plasma membrane amino acid permeases (yAAPs) have been characterized, displaying various substrate specificity ranges and affinities. All but one of these proteins are highly similar in sequence and are members of the APC superfamily (3–5). Many of them are regulated according to the content of the medium in amino acids and other nitrogenous compounds. The corresponding controls act at various levels: intracellular permease traffic, permease activity, and gene transcription (5, 6). The wide variety of yAAPs and their differential control probably enable yeast to adapt its uptake of amino acids to very diverse environmental conditions.
Detailed structural information about yAAPs is still lacking. This precludes a detailed understanding of the molecular basis of their substrate specificity and transport mechanism(s). However, the atomic level structures of three bacterial proteins of the APC family have recently been resolved: those of the arginine/agmatine (AdiC) and glutamate/γ-aminobutyric acid (GadC) antiporters and of ApcT, a broad specificity proton/amino acid symporter (7–11). These structures provide the long awaited structural framework for deciphering structure-function relationships in APC superfamily transporters. All three proteins adopt the so-called “5 + 5” fold, consisting of a core of two inverted repeats of five α-helical transmembrane (TM) segments that shape the substrate binding site. This fold is shared by transporters of several different families (1). Structural studies of different “5 + 5” transporters, including the bacterial Na+/amino acid symporter LeuT, have provided major insights into the successive conformations adopted by this category of transporters during substrate transport via an alternative access mechanism (1, 12, 13).
The specific arginine (Can1) and lysine (Lyp1) permeases were the first two amino acid transporters to be characterized in yeast, by means of uptake assays combined with the isolation of mutants (14, 15). Can1 transports arginine much more efficiently (Km ∼10 μm) than lysine (Km ∼200 μm), whereas Lyp1 mediates efficiently only lysine transport (Km ∼25 μm) (14, 15). Cloning of the corresponding genes (16, 17) has revealed that they encode highly similar proteins made of 12 TM helices flanked by hydrophilic tails facing the cytosol, and later studies on yAAPs have shown that most of these proteins, including Can1 and Lyp1, are close homologs (3, 4). Assays of Can1-mediated arginine uptake in reconstituted plasma membrane vesicles show a strict dependence on the proton-motive force (18), suggesting that Can1 catalyzes H+/arginine symport. Like other yAAPs, Can1 and Lyp1 provide convenient systems for exploring various facets of the function and regulation of plasma membrane proteins, including their lateral distribution in the membrane (19, 20) and their intracellular traffic (21, 22).
In this study, we have combined molecular modeling and experimental approaches to investigate the determinants of specific recognition of arginine by Can1. We find that replacing only two residues, Ser-176 and Thr-456, in Can1 can switch the selectivity of this permease to that of Lyp1.
EXPERIMENTAL PROCEDURES
Construction of Wild-type and Mutant Can1 Models in the Outward Facing Occluded State
A BLAST search (23) performed on the PDB sequences (24) identified three bacterial APC transporters similar to Can1. One is AdiC of Escherichia coli and Salmonella enterica whose structures were solved either in the outward facing (OF) open or occluded states, in the apo or holo forms (7–9). The others are GadC of E. coli, available in the apo inward facing conformation (11), and ApcT of Methanocaldococcus jannaschii, adopting a fully apo occluded state (10). To build a three-dimensional structure of Can1 by comparative modeling, we chose AdiC as a template, rather than GadC or ApcT, because the structure of this transporter has been solved for the transporter bound to its arginine substrate, which is also the substrate of Can1. The AdiC structure employed was the conformation trapped in the OF occluded state, where the binding site is configured for a tight fit with the arginine substrate (PDB code 3L1L (8)). The AdiC sequence can be accessed at the Universal Protein Resource (UniProt) (25). An alignment of the AdiC and Can1 sequences was performed with PROMALS3D (26), also using information from the OF occluded crystal structure of AdiC (8). Sequence identity/similarity was calculated with the LALIGN program (27) using standard parameters. Transmembrane domain predictions were performed on the Can1 sequence with HMMTOP (28) and TMpred (29).
Five models describing Can1 in the arginine-bound OF occluded state were thus built with MODELLER 9v1 (30) on the basis of the PROMALS3D (26) alignment of Can1 with AdiC. They lack the N- and C-cytosolic tails that are not present in AdiC. The stereochemistry of the model was assessed with PROCHECK (31).
Docking Calculations
Docking of arginine and lysine was performed with inclusion of protein flexibility (Induced Fit Protocol of Schrödinger, LLC (New York), Impact version 5.8) in the form of flexible residue side chains rather than with a rigid transporter. Ligand input files were prepared with the LigPrep module of Schrödinger (Schrödinger Suite 2012). Prior to docking, transporter preparation was carried out with Schrödinger's Protein Preparation Wizard protocol, whose included PROPKA module (32) was used to adjust the ionization state of all titratable residues in the protein. The Glide XP function was chosen to score the docking poses of the ligand (33). The remaining parameters were set at their default values. Selected docked poses were also scored with the molecular mechanics/generalized Born surface area (MM-GBSA) module (34). This method has indeed been shown to better predict the relative ranking of ligand binding affinities (34–37). However, it lacks the accuracy required to estimate absolute binding free energies (38, 39) and also has some weaknesses in estimating relative energies. For instance, the continuum electrostatics models used in this scoring method ignore the detailed molecular structure of the solvent, and neglect of the entropic contribution may be a source of errors, although the benefit of including this contribution has been disputed (40).
The pH-dependent protonation probability of all titratable protein residues in selected protein-ligand complexes was calculated by a continuum electrostatics/Monte Carlo approach (41–43).
Point mutations (S176N, T456S, and S176N/T456S) were introduced into the best scored OF occluded model of Can1 bound to either lysine or arginine using Maestro (Schrödinger Suite 2012). The mutated residue rotamers with the least steric hindrance were selected, and the complex was scored with the MM-GBSA module.
Sequence Analysis of Can1 Orthologs
Orthologs of Can1 were detected as described previously (44) by running BLAST against the translated coding regions of multiple genomes of the Saccharomycetes taxon. The bidirectional best hits were viewed as putative orthologs when the E-value was smaller than 10−6.
Strains and Growth Conditions
The S. cerevisiae strains used in this study (Table 1) derive from the Σ1278b wild type (45). Cells were grown at 29 °C in minimal buffered medium, pH 6.1 (46). In all experiments, the main carbon source was glucose (3%). Nitrogen sources were ammonium (20 mm) or one of the following 16 amino acids (1 or 5 mm) usable as a sole nitrogen source by S. cerevisiae: arginine, aspartate, glutamate, alanine, leucine, isoleucine, methionine, phenylalanine, tryptophan, tyrosine, threonine, proline, valine, serine, citrulline, and 4-aminobutyrate. Lysine was not included in the growth test because it cannot be used as a nitrogen source (47). Canavanine was added at a final concentration of 10 μg/ml.
TABLE 1.
Strains used in this study
| Strain | Genotype | Reference |
|---|---|---|
| 23344c | ura3 | Laboratory collection |
| 22Δ8AA | MATa, gap1-1, put4-1, uga4-1, can1::HisG, lyp1/alp1::HisG, hip1::HisG, dip5::HisG, ura3-1 | Ref. 59 |
| MS001 | MATa, gap1-1, put4-1, uga4-1, can1::HisG, lyp1/alp1::HisG, hip1::HisG, dip5::HisG, ssy1::kanMX2, ura3-1 | This study |
| 21983c | MATα, gap1, can1, ura3 | Ref. 65 |
Construction of Plasmids
The plasmids used in this study are listed in Table 2. All derive from the centromere-based pFL38 (48) vector carrying the URA3 gene. The native CAN1 allele was constructed by recombination in yeast between a CAN1 gene (amplified by PCR from Σ1278b strain DNA) and the BamHI-linearized and alkaline phosphatase-treated pFL38 plasmid. The five mutant CAN1 alleles were constructed by recombination in yeast between two partially overlapping PCR fragments corresponding to the 5′ and 3′ regions of the CAN1 coding region. The overlapping sequence was 40 bp long and contained the sequences needed to introduce the substitution. GFP-coupled alleles were also constructed by recombination between the PCR-amplified GFP fragment and each recipient CAN1 plasmid linearized with PstI and treated with alkaline phosphatase. Each plasmid construct was purified by cloning into E. coli and verified by sequencing. The sequences of the oligonucleotides used to construct the native and 10 mutant CAN1 plasmids are listed in Table 3.
TABLE 2.
Plasmids used in this study
| Plasmid | Description | Reference or source |
|---|---|---|
| pFL38 | CEN-ARS URA3 (YCp) | Ref. 66 |
| pKG001 | YCpCAN1 | This study |
| pKG036 | YCpCAN1-GFP | This study |
| pKG009 | YCpCAN1S176N | This study |
| pKG065 | YCpCAN1S176N-GFP | This study |
| pKG015 | YCpCAN1T456S | This study |
| pKG046 | YCpCAN1T456S-GFP | This study |
| pKG026 | YCpCAN1S176N/T456S | This study |
| pKG066 | YCpCAN1S176N/T456S-GFP | This study |
| pKG020 | YCpCAN1S176A | This study |
| pKG023 | YCpCAN1S176A-GFP | This study |
| pKG031 | YCpCAN1T456A | This study |
| pKG040 | YCpCAN1T456A-GFP | This study |
| pKG062 | YCpLYP1 | This study |
| pNAM001 | YCpLYP1-GFP | This study |
| pKG023 | YCpCAN1E184Q | This study |
| pKG035 | YCpCAN1E184Q-GFP | This study |
| pES001 | YCpCAN1E184A | This study |
| pES003 | YCpCAN1E184A-GFP | This study |
TABLE 3.
Primer sequences used in this study
| Primer | Sequence (5′ → 3′) |
|---|---|
| 5clCAN1pFL38 | ACGACGTTGTAAAACGACGGCCAGTGAATTCGAGCTCGGTACTCTTGTCCCTTATTAGCC |
| 3clCAN1pFL38 | TATCACCATGATTACGCCAAGCTTGCATGCCTGCAGGTCGCTAATTATACATTAGTATTAGCGTG |
| 5-CAN1S176N | AATGGTTACATGTATTGGTTTAATTGGGCAATCACTTTTGCCCT |
| 3-CAN1S176N | AGGGCAAAAGTGATTGCCCAATTAAACCAATACATGTAACCATTGGCC |
| NEW5CAN1-S176A | AATGGTTACATGTATTGGTTTGCTTGGGCAATCACTTTTGCCCT |
| NEW3CAN1-S176A | AGGGCAAAAGTGATTGCCCATCGAAACCAATACATGTAACCATTGGCC |
| 5CAN1-T456S | TACTGGTGGTGACAAAGTTTTCGAATGGCTATTAAATATCTCTGGTGTTGCAGGCTTTTTTGC |
| 5CAN1-T456A | TACTGGTGGTGACAAAGTTTTCGAATGGCTATTAAATATCGCTGGTGTTGCAGGCTTTTTTGC |
| 3CAN1-T456 | GATATTTAATAGCCATTCGAAAACTTTGTCACCACCAG |
| 5CAN1-E184Q | GGGCAATCACTTTTGCCCTGCAACTTAGTGTAGTTGGCCAAGTCA |
| 3CAN1-E184Q | ACTTGGCCAACTACACTAAGAACCAGGGCAAAAGTGATTGCCC |
| 5-E184A-CAN1 | GCAATCACTTTTGCCCTGGCACTTAGTGTAGTTGGCCAAG |
| 3-E184A-CAN1 | CTTGGCCAACTACACTAAGTGCCAGGGCAAAAGTGATTGC |
| 5–433-CAN1 | CATTCATCCCTGTTACATCC |
| 3–836-CAN1 | AACCTAAGAACCTCCCTTCG |
| 5-CAN1-GFP | ACCAAAGACTTTTTGGGACAAATTTTGGAATGTTGTAGCAGGAGCAGGTGCTGGTGCTGG |
| 3-CAN1-GFP | AGGAAACAGCTATGACCATGATTACGCCAAGCTTGCATGCAGCTAAACAGATCTATATTACCCTG |
| 5clLYP1pFL38 | ACGACGTTGTAAAACGACGGCCAGTGAATTCGAGCTCGGTATTGCCATTGGAGAAAGCCC |
| 3clLYP1pFL38 | TATCACCATGATTACGCCAAGCTTGCATGCCTGCAGGTCGATTTGAGTACTATCGCTGGC |
| 5-LYP1-GFP | GCCTAAGAATTTATGGGAGAAATTCTGGGCTGCTGTTGCAGGAGCAGGTGCTGGTGCTGG |
| 3-LYP1-GFP | TATGACCATGATTACGCCAAGCTTGCATGCCTGCAGGTCGAGCTAAACAGATCTATATTACCCTG |
Permease Activity Assays
The apparent kinetic transport parameters were characterized by whole-cell uptake assays. Can1 transport activity was determined by measuring the initial uptake rate of 14C-labeled arginine (specific activity, 274.3 mCi·mmol−1) or lysine (specific activity, 326 mCi·mmol−1) (purchased from PerkinElmer Life Sciences) provided at 10 μm final concentration (14). Accumulated counts were measured 30, 60, and 90 s after the addition of the radioactive substrate and corrected for protein concentration. The transport was expressed as nmol/mg of protein per unit of time and reported as the mean ± S.D. (n = 2–3). At least 10 substrate concentrations spread over a relevant range (0.5–160 μm) were used to determine the apparent Michaelis constant (Km) and maximal velocity (Vmax) values for [14C]arginine or [14C]lysine for the fully and partially active mutants. The values were well fitted by a single-site Michaelis-Menten model. In contrast to the Km, which is an intrinsic characteristic of a transporter, the Vmax depends on the absolute quantity of transporter inserted into the membrane. Because this quantity depends on growth conditions and gene copy number, all uptake assays were carried out under the same, rigorously fixed conditions, so that the Vmax values could be compared with each other. Data were analyzed using GraphPad Prism version 5.0.
Fluorescence Microscopy
The steady-state subcellular location of Can1-GFP proteins was determined in cells growing exponentially in liquid glucose-ammonium medium. Cells were laid on a thin layer of 1% agarose and viewed at room temperature with a fluorescence microscope (Eclipse E600; Nikon) equipped with a ×100 differential interference contrast numerical aperture 1.40 Plan-Apochromat objective (Nikon) and appropriate fluorescence light filter sets. Images were captured with a digital camera (DXM1200, Nikon) and ACT-1 acquisition software (Nikon) and processed with Photoshop CS (Adobe Systems).
Protein Extracts and Western Blotting
Proteins were immunodetected in total protein extracts as described previously (49). After transfer to a nitrocellulose membrane (Schleicher & Schuell, catalogue no. NBA085B), the proteins were probed with a monoclonal antibody raised against GFP (Roche Applied Science, catalogue no. 11 814 460 001) or Pma1 (50). Both antibodies were used at 1:10,000 dilution. Primary antibodies were detected with horseradish peroxidase-conjugated anti-mouse or anti-rabbit IgG secondary antibodies (GE Healthcare, catalogue no. NA931V) followed by enhanced chemiluminescence (Roche Applied Science, catalogue no. 12 015 196 001).
RESULTS
Modeled Three-dimensional Structures of Can1
Atomic level structural data on the yeast Can1 permease would be most helpful in understanding the determinants of its substrate specificity and molecular transport mechanism. To make up for the absence of such experimental data, we modeled the three-dimensional structure of Can1, using the OF occluded AdiC crystal structure as template (see “Experimental Procedures”). The yeast Can1 sequence and the E. coli AdiC sequence were aligned, using the structural information for the OF occluded arginine-bound structure of AdiC (PDB code 3L1L) (8) (Fig. 1). The sequence identity and similarity between AdiC and Can1 are 15 and 55%, respectively. The sequence identity value is below the 30% “twilight zone” for high accuracy template-based three-dimensional modeling. However, despite this relatively low level of sequence identity, accurate alignment can be obtained, because biological membranes provide a highly contrasted environment with a hydrophobic internal region and hydrophilic edges. This imposes, rather than strict conservation of residues, conservation of apolar and polar segments (51), as reflected by the relatively high sequence similarity value. The positions of the 12 TM regions of Can1 predicted by HMMTOP (28) and TMPRED (29) showed good correspondence with the helical segments identified by PDBTM (52) in the AdiC structure (Fig. 1). This supports the assumption that AdiC is an appropriate template for modeling Can1. The long N- and C-terminal tails of Can1 were not modeled, because AdiC lacks these regions.
FIGURE 1.

Alignment of Can1 and AdiC sequences. The TM helices as determined by STRIDE (67) on the crystal structure of the OF occluded AdiC state (PDB code 3L1L (8)) are shown as black lines above the AdiC sequence. The TM helices predicted on the Can1 sequence by either HMMTOP (black) (28) or TMPRED (gray) (29) are shown as solid lines below the Can1 sequence. Residue motifs (see “Results”) are framed, and residues interacting with the substrate (see Table 4) are marked by an asterisk. Conserved residues in AdiC and Can1 are boxed in gray.
Several three-dimensional models of the Can1 permease OF occluded state were constructed. They all feature 12 TM helical segments and superimpose well on the AdiC structure (Fig. 2A). The most significant differences between the Can1 models and the AdiC structure are two extracellular loops, one between TM5 and TM6 and one between TM7 and TM8, which appear longer in Can1 than in AdiC and are thus poorly modeled. The Can1 three-dimensional models reveal a belt of hydrophobic residues corresponding to the transmembrane area (Fig. 2B). The cytoplasmic surface is markedly positively charged, because arginine and lysine residues are clustered near the intracellular membrane-solvent interface. The extracellular surface is less positively charged, in line with the positive-inside rule of membrane proteins (53). Most of the aromatic Trp and Tyr residues are located at the membrane interface, in keeping with previous observations on membrane protein structures (54).
FIGURE 2.

Three-dimensional model of Can1 permease. A, best energy-scored three-dimensional model of Can1 in the OF occluded state superimposed onto the AdiC crystal structure (PDB code 3L1L) (8). The last two TMs (TM11 and TM12) are not part of the “5 + 5” fold. The proteins are depicted in a ribbon diagram, with AdiC in blue and Can1 in purple. The arginine ligand of the AdiC crystal structure is shown as yellow spheres. The two long extracellular loops located in Can1 between TM5 and TM6 and between TM7 and TM8 are not shown. B, three views of the molecular surface of the Can1 model colored according to the residue type (hydrophobic in white, polar in green, positively charged in blue, and negatively charged in red). The figure was prepared with vmd (68).
The model featuring the best Modeler score (Fig. 2A) was analyzed further. The root mean square distance of its Cα atoms calculated for the TMs, using AdiC structure as a reference, amounts to a small value of 0.35 Å. This model was also subjected to stereochemical analysis (31). Ramachandran plots (data not shown) indicated that a high percentage (∼92%) of nonglycine and nonproline residues have their φ,ψ torsional angles located in the most energetically favored regions. This supports the stereochemical quality of the model.
Arginine Binding to Can1
The arginine-containing pocket at the center of the Can1 structure is mainly shaped by residues of TM1, -3, -6, -8, and -10 (Fig. 3A), with TM1 and TM6 being unwound as observed in a majority of high resolution structures featuring a “5 + 5” fold, including AdiC and LeuT (1). The GSG motif in TM1 of AdiC, located in the interrupted stretch of helical TM1 and involved in binding of the carboxyl group of arginine, corresponds to the GTG motif in Can1. The WSFIGVE motif of AdiC located in the unwound portion of TM6 participates in recognition of the amino group of the substrate and of the side chain of arginine and corresponds to FTFQGTE in Can1 (see Fig. 1).
FIGURE 3.

Close view of the Can1 OF occluded substrate binding site. A, TM1, -3, -6, -8, and -10 shape the binding site. Also shown is a close view of either arginine (B) or lysine (D) bound to Can1. Lysine and arginine are shown as ball-and-stick representations. The surrounding residues are depicted as sticks. Residues are colored according to the following scheme. Green, carbon; red, oxygen; blue, nitrogen; white, hydrogen. Hydrogen bonds are shown as yellow broken lines. C, best scored arginine docked positions in the Can1 binding site that cluster into two groups: one pointing toward Glu-184 and the other to Glu-301. The two populations are highlighted by yellow circles. Residue numbers are shown in boxes colored according to their TM location as in A.
To refine our insight into amino acid binding, we performed induced fit docking of arginine into the substrate-binding pocket of the best scored Can1 model. Docking was carried out with Glu-184, located in the binding pocket (Fig. 3), in both the charged and protonated forms because pKa calculations suggested the possibility that Glu-184 might exist in either of these two protonation states. All docked poses show that the substrate backbone interactions are remarkably similar to those revealed by the arginine-bound AdiC crystal structure and not influenced by the protonation state of Glu-184 (Fig. 3B and Table 4). The α-amino group of the arginine substrate donates up to three hydrogen bonds to the main chain carbonyl oxygen atoms of Thr-101 in TM1 and Phe-295 and Gln-298 in TM6 (Table 4). The carboxyl terminus of the substrate forms up to two hydrogen bonds with the backbone of Thr-104 and Gly-105 in TM1 and an additional hydrogen bond with the side chain of Thr-104.
TABLE 4.
Interactions (hydrogen bonds (HB), hydrophobic (PHOB), and cation-π) formed between arginine and residues of the binding site of either AdiC or Can1 in the sandwich configuration (see “Results”)
| Arginine ligand | AdiC (PDB code 3L1L) (8) |
Can1 three-dimensional model |
||
|---|---|---|---|---|
| Backbone | Side chain | Backbone | Side chain | |
| Backbone | ||||
| NH3+ | HB Ile-23 (TM1) | HB Thr-101 (TM1) | ||
| HB Trp-202 (TM6) | HB Phe-295 (TM6) | |||
| HB Ile-205 (TM6) | HB Gln-298 (TM6) | |||
| COO− | HB Gly-27 (TM1) | HB Ser-26 (TM1) | HB Gly-103 (TM1) | HB Thr-104 (TM1) |
| HB Thr-104 (TM1) | ||||
| Side chain | ||||
| CH2 | PHOB Trp-202 (TM6) | PHOB Phe-295 (TM6) | ||
| Guanidinium+ | HB Ala-96 (TM3) | HB Asn-101 (TM3) | HB Ser-176 (TM3) | |
| HB Cys-97 CO (TM3) | HB Ser-357 (TM10) | HB Thr-180 (TM3) | ||
| Cation-π Trp-293 (TM8) | HB Glu-301 (TM6) | |||
| HB Thr-456 (TM10) | ||||
| Cation-π Trp-177 (TM3) | ||||
The docking calculations show that the arginine side chain is influenced by the protonation state of Glu-184. With the unprotonated form of Glu-184, the poses roughly cluster into two equal groups, distinguished by the position and orientation of the guanidinium moiety (Fig. 3C); in one group, the arginine side chain forms a salt bridge to Glu-184 (TM3) (with a docking score ranging between −8.4 and −7.7 kcal/mol), and in the other, it points to Ser-176 (TM3), Thr-180 (TM3), Glu-301 (TM6), and Thr-456 (TM10) and forms hydrogen bonds with Ser-176, Thr-180, and Thr-456 (with a docking score ranging between −7.0 and −5.6 kcal/mol) (Table 4 and Fig. 3B). The second group additionally differs from the first by the arginine ligand sandwiched between Trp-177 (TM3) and Phe-295 (TM6) (Fig. 4A), whereas in the first group, both aromatic side chains lie on the same side of the arginine side chain. The OF occluded crystal structure of AdiC (8) also features this aromatic sandwich configuration formed by Trp-202 and Trp-293 (Fig. 4B). Although sequence alignment shows conservation of the aromatic residue Trp-202 (TM6) of AdiC (Phe-295 in Can1), only the three-dimensional modeled structure reveals the correspondence of Trp-293 (TM8) in AdiC with Trp-177 (TM3) in Can1, because the latter protrudes from a different TM. Interestingly, the aromatic sandwich configuration is also found in the binding site of the periplasmic lysine-, arginine-, and ornithine-binding protein (LAO) of S. typhimurium bound to arginine (PDB code 1LAF) (55) (Fig. 4C).
FIGURE 4.

The aromatic sandwich configuration of arginine in Can1 (A), in AdiC (B), and in LAO (C). Arginine is shown as ball-and-stick representations. The surrounding residues are depicted as sticks. Residues are colored according the following scheme. Green, carbon; red, oxygen; blue, nitrogen.
The docking calculations performed with the protonated form of Glu-184 clearly favor one of the two relative orientations of the arginine side chain found in docking with charged Glu-184; in 24 of the 26 generated poses, it points to Ser-176, Thr-456, and Glu-301, forming a salt bridge to Glu-301 in some of these poses, and hydrogen-bonds with Ser-176 and/or Thr-456 in others. All 26 poses feature arginine in the aromatic sandwich configuration.
Arginine Versus Lysine Selectivity of Can1
Can1 is a highly specific arginine permease displaying a low half-saturation constant for arginine (Km ∼10 μm) and a much higher one for lysine (Km ∼200 μm) (14). Lyp1 is a potent lysine permease (Km ∼25 μm) without any measurable arginine transport activity (15). Alignment of the Can1 and Lyp1 sequences shows that they share 61% identity, and this value rises to 70% if the more divergent N- and C-terminal tails are not considered. We identified the residues lining the arginine binding pocket, using one representative pose among the arginine-docked poses featuring the aromatic sandwich configuration (Fig. 3B). This binding favored by Glu-184 protonation was chosen because the sandwich aromatic configuration is found in both AdiC and LAO (Fig. 4). In this binding mode, in addition to the interactions promoted by the sandwich aromatic configuration (i.e. one cation-π interaction with Trp-177 and hydrophobic interactions with Phe-295), the docked arginine side chain forms hydrogen bonds with Glu-301, Thr-180, Ser-176, and Thr-456 (Fig. 3B and Table 4). Interestingly, almost all Can1 residues interacting with arginine are identical in Lyp1 (data not shown). Only two differences were identified: Ser-176 and Thr-456 in Can1 (Asn-198 and Ser-478 in Lyp1).
To further examine the molecular rules of Can1 selectivity, we performed docking calculations for lysine in the Can1 binding pocket, again with Glu-184 in either of the two protonation states. The 18 docked poses for lysine obtained with the charged form of Glu-184 cluster roughly into two groups, as for arginine (Fig. 3C). In one group, including 17 poses with a docking energy binding score ranging from −7.9 to −6.1 kcal/mol, the lysine side chain points to Glu-184, with the Trp-177 and Phe-295 aromatic side chains lying on the same side of the ϵ-amino group. In the other group, containing only one pose, the lysine side chain is sandwiched between the two aromatic residues Trp-177 and Phe-295 and points to Ser-176 and Thr-456, with a docking energy binding score of −6.0 kcal/mol. In this orientation, lysine adopts a position with its ϵ-amino group coinciding with one of the two guanidinium η-nitrogens of arginine (Fig. 3, B and D). Lysine, which has a shorter side chain than arginine, does not form a cation-π interaction with Trp-177, although its amino group is at a distance typical of this type of interaction, ranging roughly between 4 and 6 Å from the aromatic moiety of Trp-177. Moreover, the lysine side chain also deprives the protein-ligand complex of three of the five hydrogen bonds identified in the arginine-Can1 complex, notably the two with Ser-176, but it keeps the hydrogen bond with Thr-456. As in the case of arginine, use of the neutral form of Glu-184 in the docking calculations completely abolishes the orientation of the side chain toward Glu-184; all 26 poses have the side chain oriented toward Ser-176, Glu-301, and Thr-456 and sandwiched between Trp-177 and Phe-295.
The docking binding energy values for arginine and lysine differ little and can thus not provide an explanation for the markedly different arginine and lysine transport activities of Can1 (14). It is well known, however, that it is difficult to accurately predict experimental binding affinities using the scoring functions developed for docking programs and, albeit less difficult, to correlate docking scores with experimental binding affinities (56). A strategy for overcoming this limitation, which has been successfully applied to various targets (34–37, 39), is to rescore the poses using the MM-GBSA method to calculate binding free energies (34). We thus used this function to score for arginine and lysine the representative poses in the aromatic sandwich configuration, with both the charged/unprotonated and the neutral/protonated form of Glu-184. On the basis of these scores, one could predict that arginine should bind Can1 with a much better affinity than lysine, whether Glu-184 is in its unprotonated form (ΔG = −79.1 versus 45.7 kcal/mol) or its protonated form (ΔG = −73.0 versus −45.1 kcal/mol). These data are in agreement with Can1 being a more potent arginine than lysine transporter. The difference between arginine and lysine arises from the hydrogen bond energy term and, more markedly, from the solvation term (Table 5), which, in the MM-GBSA model used here, contains a polarization contribution that differs significantly between the arginine and lysine side chains (57).
TABLE 5.
MM-GBSA binding energies of arginine or lysine and their main contributions in wild-type Can1 and variants taking two different rotamers for each mutated residue
| Total | Coulomb term | Hydrogen term | Solvation term | Van der Waals term | |
|---|---|---|---|---|---|
| kcal/mol | kcal/mol | kcal/mol | kcal/mol | kcal/mol | |
| Arginine binding | |||||
| Wild type | −79.1 | 3.3 | −5.5 | −27.1 | −32.0 |
| S176N | −69.9 | −7.8 | −4.8 | −14.9 | −30.8 |
| S176N | −65.9 | 3.3 | −3.1 | −19.0 | −25.4 |
| T456S | −77.1 | 2.2 | −5.2 | −24.6 | −31.3 |
| T456S | −76.3 | 0.9 | −4.8 | −21.7 | −32.3 |
| S176N/T456S | −61.3 | 7.8 | −2.1 | −25.8 | −32.4 |
| S176N/T456S | −64.9 | −1.7 | −2.2 | −18.5 | −33.9 |
| S176N/T456S | −60.3 | 8.7 | −2.1 | −26.0 | −32.1 |
| S176N/T456S | −61.2 | 1.3 | −2.0 | −17.6 | −34.0 |
| Lysine binding | |||||
| Wild type | −45.7 | −10.8 | −1.8 | 15.1 | −31.1 |
| S176N | −45.6 | −11.3 | −1.9 | 16.3 | −31.7 |
| S176N | −45.0 | −5.4 | −1.8 | 10.5 | −31.1 |
| T456S | −45.2 | −7.9 | −1.8 | 12.8 | −31.4 |
| T456S | −42.7 | −5.1 | −1.6 | 12.7 | −31.8 |
| T456S-wat | −45.1 | −12.9 | −2.0 | 15.9 | −29.3 |
| T456S-wat | −46.1 | −13.4 | −2.0 | 15.2 | −29.2 |
| T456S-wat | −44.4 | −13.4 | −2.0 | 16.5 | −28.8 |
| S176N/T456S | −46.1 | −10.4 | −1.8 | 14.4 | −31.4 |
| S176N/T456S | −44.5 | −5.2 | −1.9 | 10.2 | −30.7 |
| S176N/T456S | −44.8 | −8.4 | −1.7 | 13.8 | −31.7 |
| S176N/T456S | −44.3 | −3.0 | −1.8 | 8.5 | −31.1 |
Mutational Analysis of the Substrate-binding Pocket of Can1
To learn about the molecular determinants of Can1 specificity, we designed residue substitutions in the substrate binding pocket and tested by experiments the influence of these changes on Can1 activity. We chose the residues to be replaced using the above described model of arginine recognition by Can1, with Lyp1 as a guideline, and tried to alter the specificity of Can1 so as to switch it to that of Lyp1. The mutagenized residues were Ser-176 of TM3 and Thr-456 of TM10 (i.e. those predicted to interact with the guanidinium group of arginine (Fig. 3B) and differing between Can1 and Lyp1). The residues were replaced with the corresponding residues of Lyp1, namely Asn and Ser at positions 176 and 456, respectively. They were also replaced with Ala, which features a small side chain that does not provide extreme electrostatic or steric effects. Thus, five mutant genes were isolated, encoding Can1 proteins with one of the following single or double substitutions: S176N, S176A, T456S, T456A, or S176N/T456S. An additional version of each gene, encoding Can1 fused at its extreme C terminus to GFP, was also constructed. The variant genes were expressed in yeast under the control of the natural CAN1 gene promoter (see “Experimental Procedures”). Fluorescence microscopy analysis showed that the native Can1 permease is present at the plasma membrane (Fig. 5A), in keeping with previous observations (58). A plasma membrane location was also observed for the five mutant Can1 proteins (Fig. 5A).
FIGURE 5.

Functional properties of mutant Can1 proteins. A, subcellular locations of the mutant Can1 proteins. Strain 22Δ8AA was transformed with the pKG036 (YCpCAN1-GFP) plasmid expressing the native Can1 protein coupled to GFP or with an equivalent plasmid encoding a mutant Can1 protein. Cells were grown on glucose-ammonium medium and examined by fluorescence microscopy. B, strain 22Δ8AA transformed with the empty vector YCpFL38, the pKG036 (YCp-CAN1) plasmid expressing the native permease (Can1), or one of five derived plasmids encoding Can1 mutants were grown on solid minimal medium with arginine (Arg) or ammonium (Am) as the sole nitrogen source and with canavanine (Can) when indicated. Cells were incubated at 29 °C for 5 days. C, strain 22Δ8AA transformed with pKG036 (CAN1-GFP) plasmid or pKG065 (CAN1-S176N-GFP), pKG046 (CAN1-T456S-GFP), or pKG066 (CAN1-S176N/T456S-GFP) plasmid was grown on glucose-ammonium medium. Crude cell extracts were prepared and immunoblotted with anti-GFP or with anti-Pma1 antibodies.
We next expressed the native and mutant Can1 proteins (not fused to GFP) in a yeast strain suitable for assessing their functionality by means of growth tests and transport assays. This strain, named 22Δ8AA, lacks eight yAAP genes, including CAN1, GAP1, LYP1, and ALP1, which code for the permeases shown to catalyze uptake of arginine and/or lysine (59). This strain is thus unable to grow on a minimal medium containing arginine as the sole nitrogen source. Its transformation with the plasmid expressing the native Can1 permease restored fast growth on this medium, similar to that of the corresponding wild-type strain (Fig. 5B). The mutant strain grew normally on a medium containing ammonium as the sole nitrogen source, and this growth was unaltered by the further addition of canavanine, a toxic arginine analog. In contrast, both the wild-type strain and the 22Δ8AA strain expressing the native Can1 permease were intoxicated by canavanine, as expected (Fig. 5B). The results of the growth test for the five Can1 mutants (Fig. 5B) show that three of these mutants, Can1(S176A), Can1(T456A), and Can1(T456S), behave like the native Can1 permease and can thus be considered at least partially functional, whereas the other two mutants, Can1(S176N) and Can1(S176N/T456S), completely fail to support growth on arginine and to confer sensitivity to canavanine, suggesting that they are non-functional.
The growth test results were confirmed by direct arginine transport assays. The initial rate of [14C]arginine uptake was measured in cells of the 22Δ8AA strain growing on minimal glucose ammonium medium, conditions under which Can1 is present at the plasma membrane and active. The results presented in Table 6 show that the Can1(T456A) and Can1(T456S) transport arginine as efficiently as wild-type Can1 (Table 6 and Fig. 6). The Can1(S176A) mutant, however, shows an 85% loss of activity, arising mainly from a higher Km. The Can1(S176N) and Can1(S176N/T456S) mutants are totally inactive, in keeping with the growth test data. These results demonstrate the importance of Ser-176 of TM3 in arginine transport. In contrast, replacing Thr-456 in TM10 with a smaller residue, able or not to form a hydrogen bond, was found not to affect arginine transport.
TABLE 6.
Arginine and lysine transport activities of wild-type and mutant Can1 proteins
Uptake assays were carried out in the 22Δ8AA strain grown on minimal medium containing 20 mm NH4+ as the sole nitrogen source. For “activity measurements,” 14C-labeled amino acids were added at 10 μm final concentration, and the values represent the average ± S.D. of 2–3 independent experiments. The Vmax and Km values and corresponding S.D. values were calculated for each mutant from the Michaelis-Menten plots shown in Fig. 6. ND, not determined, when the uptake rate was below the detection threshold.
| Permease | Arginine transport |
Lysine transport |
||||
|---|---|---|---|---|---|---|
| Activity | Vmax | Km | Activity | Vmax | Km | |
| nmol·min−1·mg−1 protein | nmol·min−1·mg−1 protein | μm | nmol·min−1·mg−1 protein | nmol·min−1·mg−1 protein | μm | |
| Can1 | 5.5 ± 0.1 | 10.5 ± 0.4 | 10.3 ± 1.3 | 0.2 ± 0.1 | 4.1 ± 0.5 | 148.7 ± 25.5 |
| Can1S176N | ND | ND | ND | ND | ND | ND |
| Can1S176A | 0.7 ± 0.1 | 11.3 ± 0.5 | 78 ± 6.4 | 0.2 ± 0.1 | 3.9 ± 0.2 | 107.5 ± 9 |
| Can1T456S | 9.2 ± 0.2 | 17 ± 0.7 | 4.9 ± 0.8 | 4.8 ± 0.5 | 13.1 ± 0.3 | 13 ± 1 |
| Can1T456A | 5.8 ± 0.1 | 12.3 ± 0.4 | 3 ± 0.5 | 1.1 ± 0.1 | 4.9 ± 0.4 | 25.7 ± 4.6 |
| Can1S176N/T456S | ND | ND | ND | 1.9 ± 0.1 | 3.6 ± 0.2 | 13.2 ± 1.8 |
| Lyp1 | ND | ND | ND | 2.9 ± 0.2 | 4.5 ± 0.1 | 10.4 ± 0.7 |
FIGURE 6.

Concentration-dependent kinetics of [14C]arginine (left) and [14C]lysine (right) uptake by yeast strain 22Δ8AA expressing the native or a mutant form of Can1. Error bars, S.E.; n = 2. The arginine and lysine transport activities of control cells (empty plasmid) were subtracted for each concentration. Curve fitting was carried out by non-linear one-site binding (competition) analysis. When not visible, error bars are smaller than the symbols. Prot, protein.
Turning Can1 into a Lysine-specific Permease
Because in the Can1(S176N), Can1(T456S), and Can1(S176N/T456S) mutants, the residues Ser-176 and Thr-456 of the predicted substrate-binding pocket of Can1 have been replaced with the corresponding amino acid of the Lyp1 permease, we next tested whether these Can1 mutants might be able to transport lysine (Table 6). As expected, the 22Δ8AA strain showed no lysine transport activity (data not shown), and its transformation with a low copy number plasmid containing the LYP1 gene restored high lysine uptake. In contrast, expression of the Can1 permease in the same strain conferred only weak lysine transport activity, as expected from the very high Km of Can1 for lysine. Remarkably, Can1(T456S) restored high lysine uptake activity, showing that this Can1 mutant catalyzes efficient uptake of both arginine and lysine. Its apparent Km of lysine transport (13 μm) was shown to be close to that of Lyp1 (10 μm) and much lower than that of Can1 (153 μm). This mutant also features a higher Vmax value compared with wild-type Can1 for both arginine and lysine transport. This enhanced value is apparently not due to a higher level of protein expression as shown by immunodetection of the Can1 variants in total cell extracts (Fig. 5C).
The Can1(S176N) mutant, devoid of arginine uptake activity, also failed to transport lysine, but the Can1(S176N/T456S) variant, equally unable to transport arginine, was found to confer to the 22Δ8AA strain high lysine uptake activity. Furthermore, this double variant displayed an apparent Km for lysine transport (13 μm) close to that of Lyp1 (10 μm), showing that Can1(S176N/T456S) has the properties of a high affinity specific lysine permease. That Can1(T456S) transports arginine and lysine indicates that adding the S176N substitution to the Can1(T456S) prevents arginine uptake without interfering with lysine uptake.
We wondered if Can1(T456S) and Can1(S176N/T456S) might have acquired the ability to catalyze uptake of other amino acids, in addition to arginine or lysine. To test this possibility, we first isolated a novel yeast mutant that fails to grow on 16 amino acids present in the medium as the sole nitrogen source because of their impaired uptake (data not shown). This mutant was isolated from strain 22Δ8AA by further deletion of the SSY1 gene, which encodes a permease-like sensor required for transcriptional induction of several yAAP genes (e.g. AGP1, GNP1, BAP2, and BAP3) (55). The growth tests showed that the active Can1 mutants restore growth on arginine but not on 15 other amino acids (see “Experimental Procedures”) usable as sole nitrogen source (i.e. they do not seem able to catalyze their efficient uptake). In contrast, expression of the general amino acid permease Gap1 in this yeast mutant restored growth on all tested amino acids (data not shown).
Molecular Analysis of the Specificity Conversion of Can1 Mutants
To get a better grasp of the molecular basis of the specificity changes of the Can1(S176N), Can1(T456S), and Can1(S176N/T456S) mutants, we modeled their arginine- and lysine-bound three-dimensional structures (Fig. 7). As for the wild-type Can1, we examined only the position of the arginine or lysine side chain sandwiched between Trp-177 and Phe-295 and pointing toward Ser-176 and Thr-456. Glu-184 was considered in its unprotonated form. In each of the three mutant models, the guanidinium moiety of arginine thus forms a cation-π interaction with Trp-177, although not always optimal, and will thus not be discussed hereafter. In what follows, we describe only the interactions that differ between the native and mutant Can1 proteins.
FIGURE 7.

The binding mode of arginine and of lysine predicted in the Can1 modeled three-dimensional structure. Arginine bound in Can1(S176N) variant featuring one Asn-176 rotamer (A), Can1(T456S) variant featuring one Ser-456 rotamer (B), and Can1(S176N-T456S) variant featuring one Asn-176 and one Ser-456 rotamer (C). Lysine bound in Can1(S176N) variant featuring one Asn-176 rotamer (D), Can1(T456S) variant featuring one Ser-456 rotamer (E), and Can1(S176N/T456S) variant featuring one Asn-176 and one Ser-456 rotamer (F). Arginine and lysine are depicted as ball-and-stick representations, and surrounding residues are shown as sticks. Residues are colored according the following scheme. Green, carbon; red, oxygen; blue, nitrogen; white, hydrogen. Hydrogen bonds are shown as yellow broken lines.
For Can1(S176N), systematic sampling of the rotameric states of Asn-176 was performed. Steric hindrance between the Asn-176 side chain and the protein and/or ligand was observed to varying extents for all rotamers. This hints at the difficulty of accommodating a bulkier side chain at this position. Two rotamers with a χ1 value similar to that of the original Ser-176 residue and featuring the least steric hindrance were examined in detail. In both cases, the MM-GBSA score predicts arginine to be more weakly bound to the mutant than to wild-type Can1, although one rotameric form shows a significantly higher affinity than the other. The loss of affinity arises mainly from the hydrogen bond and van der Waals energy terms and, to a greater extent, from the solvation energy change (Table 5). The arginine configuration for one rotamer (Fig. 7A) lacks several hydrogen bonds as compared with wild-type Can1. The loss of free energy of binding might also be due to shifts in the orientations of residue side chains in the Can1 binding site, particularly those of Tyr-173 and, to a lesser extent, Glu-301, induced by replacement of serine by the bulkier asparagine residue (data not shown).
For the Can1(S176N/T456S) double mutant, four different conformers were examined: two serine rotamers and two asparagine rotamers. All four conformations feature decreased affinity for arginine. Depending on whether one considers the Asn-176 or the Ser-456 rotamers, this decrease arises to a varying extent from the Coulomb or hydrogen bond energy terms and from the solvation energy change (Table 5). The binding site configuration also features fewer hydrogen bonds than for wild-type Can1 (Fig. 7C). The binding mode of arginine in the Can1(S176N/T456S) double mutant exhibits mainly the same features as in the S176N single mutant, likely to arise from the perturbation caused by the bulkier Asn side chain in the binding pocket.
In contrast to the S176N and S176N/T456S mutants, Can1(T456S) binds arginine in a manner similar to that of wild-type Can1. The binding mode features four or five hydrogen bonds, depending on the rotameric state of the serine side chain (Table 5 and Fig. 7B), and an MM-GBSA score close to that of Can1.
As we had done for the arginine ligand, we then examined the binding mode of lysine in the aromatic sandwich configuration. In what follows, we focus mainly on the interactions that differ between the wild-type and mutant Can1 variants. In wild-type Can1, lysine binds with two hydrogen bonds formed with the Thr-180 and Thr-456 side chains (Fig. 3D).
Binding of lysine to the Can1(S176N) mutant was examined, as for arginine, for two favorable Asn rotamers with a χ1 value similar to that of the original Ser-176 residue (Fig. 7D). The number of hydrogen bonds formed by lysine was found to be similar to that observed in wild-type Can1. The MM-GBSA score of the two rotameric S176N forms predicts an affinity for lysine similar to that of wild-type Can1 (Table 5).
The MM-GBSA score and the hydrogen bond number were similar to those mentioned above for Can1(T456S), suggesting that lysine does not bind more efficiently to Can1(T456S) than to the wild-type protein (Fig. 7E). Interestingly, when the arginine- and lysine-bound LAO protein crystal structures are superimposed, there appears one additional water molecule in the lysine-bound as compared with the arginine-bound structure. Its position coincides approximately with that of one of the two η-nitrogens of arginine in the latter structure. We thus introduced one water molecule into the structure of the Can1(T456S) mutant, close to Ser-456 and Ser-176, filling a void similar to that caused by removal of the methyl group when Thr-456 is replaced with a serine. In some cases, introducing explicit water molecules may be required to improve the accuracy of MM-GBSA score calculations, because the first shell solvation effect is poorly represented by the implicit solvent model (57). Introduction of the molecule generated a configuration where hydrogen bonds mediated by the inserted water molecule are formed between Ser-176 and lysine (data not shown). Its MM-GBSA score is about −46.0 kcal/mol, thus slightly more favorable than that computed in the absence of the water molecule but still close to the wild-type Can1 score (−45.7 kcal/mol) (Table 5).
Last, the lysine-bound Can1(S176N/T456S) model shows two hydrogen bonds between the lysine and residues of the binding pocket (Fig. 7F). The MM-GBSA score of this binding mode varies from −44 to −46 kcal/mol, depending on the rotameric states of Asn-176 and Ser-456. These values are close to those of wild-type Can1 and of the other two mutants (Table 5). In summary, our MM-GBSA calculations predict that in the OF occluded state, lysine should bind to all three Can1 mutants with an affinity similar to that observed for the wild type (see “Discussion”).
Structural and Functional Insights into Proton-coupled Translocation
Our docking calculations hint that the protonation state of Glu-184 might influence the orientation of arginine and lysine substrate side chains in the binding pocket of Can1 (Fig. 3C). Glu-184 is strongly conserved among yAAPs, except in the acidic amino acid transporter Dip5 and the tryptophan and tyrosine transporter Tat1 (Fig. 8A); nor is it conserved in AdiC, which is a not a proton-coupled transporter (Fig. 1). Glu-184 is located in the vicinity of Phe-295, which occupies a position similar to that of Trp-202 in AdiC. Trp-202 is proposed to act as a gate, because its displacement is considerable between the OF open and the OF occluded state. In the latter state, like its counterpart Phe-295 in Can1, as shown by our docking calculations, Trp-202 interacts with the aliphatic portion of arginine, blocking arginine release back to the periplasm (8). This makes it essential to transport activity (60).
FIGURE 8.

Conservation and protonation probability of Glu-184. A, multiple sequence alignments of 15-amino acid permeases of S. cerevisiae showing the conservation degree of Glu-184 (Can1 numbering) using ClustalW (69). These sequences were taken from the YTP database (66). B, protonation probability of Glu-184 in the OF occluded Can1 model. Two docked positions of arginine featuring two different orientations of its side chain pointing either toward Glu-184 (dashed line) or Glu-301 (solid line) were considered (see “Results”).
On the basis of these considerations, we performed, for each of the two Glu-184 protonation states, detailed protonation probability calculations on two representative conformations, one for each of the arginine side chain orientations obtained in the docking calculations (Fig. 8B). The computed Glu-184 titration curves suggest that protonation of this residue is indeed very sensitive to the side chain position in the binding site.
To assess the importance of Glu-184, we replaced this residue with glutamine, a neutral analog of glutamate, and with alanine, to estimate the importance of having a charged or a polar residue at this position. The Can1(E184Q) and Can1(E184A) mutant permeases were found to localize properly to the cell surface, but they were inactive, as judged by the results of arginine uptake assays and growth tests (Fig. 9). The Glu-184 residue is thus crucial for Can1 transport activity. This result, together with the prediction from protonation probability calculations that Glu-184 can exist in different protonation states, suggests that Glu-184 may be a key player in substrate translocation-coupled proton transport.
FIGURE 9.

Functional properties of Can1(E184A) and Can1(E184Q) mutants. A, strain 22Δ8AA transformed with a plasmid expressing either Can1(E184Q) or Can1(E184A) mutant was grown on glucose-ammonium medium and examined by fluorescence microscopy. B, strain 21983c (gap1 can1) was transformed with the empty vector YCpFL38, the pKG001 (YCp-CAN1) plasmid expressing the wild-type Can1, or one of the two derived plasmids encoding either Can1(E184Q) or Can1(E184A) mutants, and grown on solid minimal medium with arginine (Arg) or ammonium (Am) as the sole nitrogen source and with canavanine (Can) when indicated. Cells were incubated at 29 °C for 3 days. In conditions of non-growth, the white streaks on the squares correspond to light reflections on the agar and not to cell growth. C, initial rates of [14C]arginine (10 μm) uptake by wild-type Can1 and Can1(E184Q) or Can1(E184A) mutants expressed in the 22Δ8AA strain grown on minimal ammonium medium. Error bars, S.E.; n = 2. When not visible, error bars are smaller than the symbols. prot, protein.
DISCUSSION
The recent elucidation of several high resolution crystal structures of bacterial transporters featuring the “5 + 5” fold, including the arginine/agmatine antiporter AdiC, has considerably advanced our understanding of the structure and function of APC superfamily proteins (1, 2). Here we have used the AdiC structure (8) as a template to build a three-dimensional structural model of Can1, the yeast H+-driven specific arginine permease, in its OF occluded state. This predicted structure, combined with docking calculations, shows that recognition of the arginine backbone is highly similar in Can1 and AdiC and also very similar to recognition of the leucine backbone by the sodium-dependent transporter LeuT (1, 61). The recognition involves several hydrogen bonds formed by the α-amino and carboxyl groups of the substrate, mainly with the backbones of residues of unwound portions of TM1 and TM6. Interactions with the arginine side chain involve about six of the residues pointing toward the substrate-binding pocket (Table 4). Among these are two aromatic residues (Phe-295 and Trp-177) positioned to either side of the substrate side chain, thus shaping a sandwich configuration similar to those of the arginine-bound AdiC and LAO proteins. Remarkably, whereas one of these two aromatic residues (Trp-202 in AdiC, Phe-295 in Can1) is provided by TM6 in both AdiC and Can1, the other (Trp-293 in AdiC, Trp-177 in Can1) is provided by TM8 in AdiC and by TM3 in Can1. For this reason, its conservation is visible only when the three-dimensional structures of Can1 and AdiC are superimposed.
Structural modeling of Can1 has revealed crucial residues determining its selectivity for arginine versus lysine. Among the six residues mediating specific interactions with the arginine side chain, only two, Ser-176 in TM3 and Thr-456 in TM10, are not strictly conserved in the lysine-specific Lyp1 permease, where their respective counterparts are an Asn and a Ser. Using transport assays and molecular modeling, we have shown here that these two residues of Can1 play a key role in distinguishing arginine from lysine. Our results, summarized in Fig. 10, show that when these positions in TM3 and TM10 are occupied, respectively, by a Ser and a Thr (Ser-Thr configuration), arginine is transported, but lysine translocation is compromised. This is the situation of wild-type Can1. If the residue in TM10 is replaced with a Ser (Ser-Ser configuration), the arginine and lysine substrates are transported with a similar high efficiency (i.e. the permease is unable to distinguish arginine from lysine). This is the situation of Can1(T456S) mutant. If, in addition to this substitution, the position in TM3 is occupied by an Asn (Asn-Ser configuration), arginine transport is abolished, and only lysine is transported, as illustrated by Can1(S176N/T456S) and probably the natural Lyp1 permease. Last, if the residue in TM3 is an Asn, and the residue in TM10 is a Thr (Asn-Thr configuration), the transport of both amino acids is impeded, rendering the permease completely inactive. This is the situation of Can1(S176N). We have further examined 46 sequences of Can1 orthologs of other fungal species (see “Experimental Procedures”). We find that although many display the Ser-Thr configuration, as in Can1, about one-third of them exhibit the Ser-Ser configuration, suggesting that these fungal permeases do not distinguish arginine from lysine (Fig. 10). In almost all configurations of these Can1 orthologs, the fact that the TM3 residue is a Ser supports the view that this residue is important for arginine selectivity.
FIGURE 10.
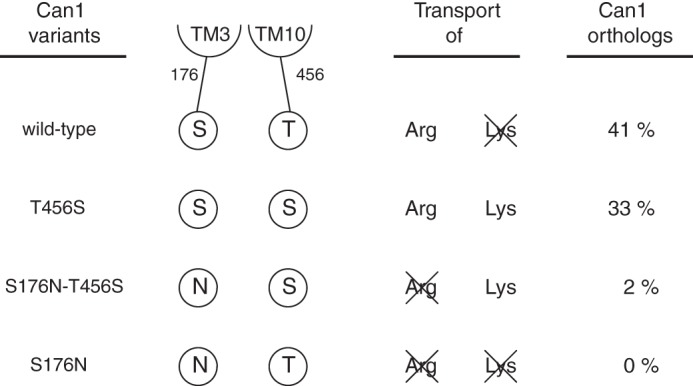
Schematic representation summarizing the arginine and lysine transport activities of wild-type and mutant Can1 proteins at positions 176 and 456. In addition, the probability of finding this residue configuration at equivalent positions in yeast Can1 orthologs is given.
At the molecular level, our data suggest that increasing the residue size at the 176 position of TM3 is detrimental to efficient arginine translocation (transport activity: Asn-176 < Ser-176, Ala-176). Our modeled Can1(S176N) and Can1(S176N/T456S) structures accordingly suggest that in the OF occluded state, Asn at position 176 does not allow an optimal fit of arginine. This should decrease the stored binding energy and thereby hamper the switch to subsequent conformational states.
In contrast, and as shown for Can1(T456S) and Can1(T456A), occupancy of position 456 by a Thr, as in wild-type Can1, does not hamper arginine transport as compared with the presence, at this position, of a slightly smaller Ser or Ala residue. Furthermore, the modeled binding mode and associated free energy of arginine are similar for the Can1(T456S) variant and wild-type Can1. Altogether, these data suggest that a slight change in the size of the residue side chain at position 456 in TM10 does not strongly impact the binding mode of arginine, because it allows as many intimate protein-substrate interactions as in wild-type Can1 (compare Fig. 7B with Fig. 3B). In support of this view, a few orthologs of Can1 (14%) feature a Val or an Ala at this position. As indicated by the MM-GBSA scores, the tight binding of arginine observed in both wild-type Can1 and the Can1 (T456S) variant should thus provide about the same amount of energy, sufficient to facilitate subsequent conformational changes. This could explain why the translocation process is efficient in both proteins (62).
The size of the residue side chain might a priori also account for the inhibitory effect, on lysine transport, of having a Thr at position 456, because replacing this Thr in TM10 with the smaller Ser or Ala establishes efficient translocation of this amino acid. Our modeling data, however, do not support this view; the modeled binding modes of the wild-type and mutant proteins show that lysine does not fit into the binding pocket as tightly as arginine and that it forms fewer specific interactions (see, for instance, Fig. 3, B and D) but that the predicted binding free energy of lysine is similar in Can1(T456S), Can1(S176N-T456S), and wild-type Can1, in contrast to that of arginine. A closer look at the wild-type Can1 model shows that Thr of TM10 and Ser of TM3 are close to each other (the distance between the two hydroxyl oxygens is about 3.1 Å) and that replacing the Thr in TM10 with Ser introduces a void between the two TMs. Furthermore, a comparison of two AdiC crystal structures trapped in the occluded and non-occluded OF states shows that Ser-357, the residue corresponding to Thr-456 in Can1, undergoes a substantial displacement upon occlusion of the transporter (8, 9). One may thus conjecture that the presence of a Ser at position 456 in TM10 does not enhance lysine binding in the OF occluded state but instead facilitates structural transitions that should require less energy. Inefficient lysine transport by wild-type Can1 and the Can1(S176N) mutant could thus arise from the capacity of Thr at this position in TM10 to hamper these conformational changes. In support of the view that the residue at position 456 in TM10 influences structural transitions required for transport, lysine transport by the Can1(T456S) mutant features a higher Vmax compared with that in wild-type Can1. Arginine transport by the Can1(T456S) mutant is also characterized by a higher Vmax but a Km value close to that of wild-type Can1. The results described here thus raise the more general issue of possible different mechanisms for arginine and lysine binding and translocation by wild-type Can1 and its variants.
The above interpretation of the transport properties of wild-type and mutant Can1 suggests that arginine and lysine transport may be facilitated or hampered at different stages of the translocation process. The Km and Vmax values measured in our kinetic analysis, however, do not enable us to distinguish between a model where a conformational change is the rate-limiting step for transport and a model where substrate dissociation is rate-limiting (63, 64). To address this problem, we thus used the MM-GBSA scoring method to predict the relative ranking of affinities of arginine and lysine binding to wild-type and mutant Can1 proteins. The comparison of these estimated relative binding free energy values suggests that arginine transport by, for example, Can1(S176N) would be hindered at the stage of substrate binding, whereas tenuous lysine transport by wild-type Can1 would arise from a flaw in the conformational transition.
Because the Can1 permease requires the proton-motive force to accumulate arginine in the cell (18), it probably catalyzes H+-arginine symport. The mechanism underlying proton translocation is so far unknown. Our protonation probability calculations pave the way toward better understanding the proton influx mechanism coupled to arginine transport. The sensitivity of Glu-184, a residue of the binding site pocket, to protonation seems to depend on the orientation of the amino acid ligand in the binding pocket (see Fig. 8B). This suggests that Glu-184, which is highly conserved among yAAPs, may be a key player in mediating proton symport. The lack of transport activity of the Can1(E184Q) and Can1(E184A) mutants, where deprotonation/protonation of residue 184 cannot occur, supports the notion that Glu-184 may indeed play a role in proton symport.
In conclusion, the present study combining modeling and experimentation demonstrates that subtle selective replacements of residues composing the substrate-binding pocket of yAAPs can fine tune their specificity. It also validates the use of a bacterial APC transporter, such as AdiC, to construct three-dimensional models of yAAPs that can be used to guide experimental analyses and to provide a molecular framework for data interpretation. This approach could be applied to other yAAPs to further analyze the structural code of amino acid recognition by this family of transporters. Furthermore, this knowledge could also help in understanding the translocation mechanism(s) of other amino acid transporters of bacterial, fungal, plant, and mammalian origin. It could also provide an attractive model for studying the mechanism of H+/amino acid symport by APC transporters.
Acknowledgments
We thank Catherine Jauniaux for invaluable technical help and advice, Elie Saliba and Mayuri Sadoine for contributions to isolating plasmids and yeast strains, and Lydia Spedale for technical assistance. We also thank Doris Rentsch and Wolf Frommer for strain 22Δ8AA.
This work was supported by Fonds de la Recherche Scientifique Médicale Grant 3.4.592.08.F and Actions de Recherche Concertées Grant AUWB 2010-15-2 of the Fédération Wallonie-Bruxelles.
- APC
- amino acid-polyamine-organocation
- yAAP
- yeast amino acid permeases
- AdiC
- arginine/agmatine transporter
- GadC
- glutamate/γ-aminobutyric acid
- MM-GBSA
- molecular mechanics/generalized Born surface area
- TM
- transmembrane
- OF
- outward facing
- LAO
- lysine-, arginine-, and ornithine-binding protein
- PDB
- Protein Data Bank.
REFERENCES
- 1. Jeschke G. (2013) A comparative study of structures and structural transitions of secondary transporters with the LeuT fold. Eur. Biophys. J. 42, 181–197 [DOI] [PMC free article] [PubMed] [Google Scholar]
- 2. Wong F. H., Chen J. S., Reddy V., Day J. L., Shlykov M. A., Wakabayashi S. T., Saier M. H., Jr. (2012) The amino acid-polyamine-organocation superfamily. J. Mol. Microbiol. Biotechnol. 22, 105–113 [DOI] [PubMed] [Google Scholar]
- 3. Van Belle D., André B. (2001) A genomic view of yeast membrane transporters. Curr. Opin. Cell Biol. 13, 389–398 [DOI] [PubMed] [Google Scholar]
- 4. Andre B. (1995) An overview of membrane transport proteins in Saccharomyces cerevisiae. Yeast 11, 1575–1611 [DOI] [PubMed] [Google Scholar]
- 5. Ljungdahl P. O., Daignan-Fornier B. (2012) Regulation of amino acid, nucleotide, and phosphate metabolism in Saccharomyces cerevisiae. Genetics 190, 885–929 [DOI] [PMC free article] [PubMed] [Google Scholar]
- 6. Lauwers E., Erpapazoglou Z., Haguenauer-Tsapis R., André B. (2010) The ubiquitin code of yeast permease trafficking. Trends Cell Biol. 20, 196–204 [DOI] [PubMed] [Google Scholar]
- 7. Gao X., Lu F., Zhou L., Dang S., Sun L., Li X., Wang J., Shi Y. (2009) Structure and mechanism of an amino acid antiporter. Science 324, 1565–1568 [DOI] [PubMed] [Google Scholar]
- 8. Gao X., Zhou L., Jiao X., Lu F., Yan C., Zeng X., Wang J., Shi Y. (2010) Mechanism of substrate recognition and transport by an amino acid antiporter. Nature 463, 828–832 [DOI] [PubMed] [Google Scholar]
- 9. Kowalczyk L., Ratera M., Paladino A., Bartoccioni P., Errasti-Murugarren E., Valencia E., Portella G., Bial S., Zorzano A., Fita I., Orozco M., Carpena X., Vázquez-Ibar J. L., Palacín M. (2011) Molecular basis of substrate-induced permeation by an amino acid antiporter. Proc. Natl. Acad. Sci. U.S.A. 108, 3935–3940 [DOI] [PMC free article] [PubMed] [Google Scholar]
- 10. Shaffer P. L., Goehring A., Shankaranarayanan A., Gouaux E. (2009) Structure and mechanism of a Na+-independent amino acid transporter. Science 325, 1010–1014 [DOI] [PMC free article] [PubMed] [Google Scholar]
- 11. Ma D., Lu P., Yan C., Fan C., Yin P., Wang J., Shi Y. (2012) Structure and mechanism of a glutamate-GABA antiporter. Nature 483, 632–636 [DOI] [PubMed] [Google Scholar]
- 12. Krishnamurthy H., Piscitelli C. L., Gouaux E. (2009) Unlocking the molecular secrets of sodium-coupled transporters. Nature 459, 347–355 [DOI] [PMC free article] [PubMed] [Google Scholar]
- 13. Khafizov K., Staritzbichler R., Stamm M., Forrest L. R. (2010) A study of the evolution of inverted-topology repeats from LeuT-fold transporters using AlignMe. Biochemistry 49, 10702–10713 [DOI] [PubMed] [Google Scholar]
- 14. Grenson M., Mousset M., Wiame J. M., Bechet J. (1966) Multiplicity of the amino acid permeases in Saccharomyces cerevisiae. I. Evidence for a specific arginine-transporting system. Biochim. Biophys. Acta 127, 325–338 [DOI] [PubMed] [Google Scholar]
- 15. Grenson M. (1966) Multiplicity of the amino acid permeases in Saccharomyces cerevisiae. II. Evidence for a specific lysine-transporting system. Biochim. Biophys. Acta 127, 339–346 [DOI] [PubMed] [Google Scholar]
- 16. Hoffmann W. (1985) Molecular characterization of the CAN1 locus in Saccharomyces cerevisiae. A transmembrane protein without N-terminal hydrophobic signal sequence. J. Biol. Chem. 260, 11831–11837 [PubMed] [Google Scholar]
- 17. Sychrova H., Chevallier M. R. (1993) Cloning and sequencing of the Saccharomyces cerevisiae gene LYP1 coding for a lysine-specific permease. Yeast 9, 771–782 [DOI] [PubMed] [Google Scholar]
- 18. Opekarová M., Caspari T., Tanner W. (1993) Unidirectional arginine transport in reconstituted plasma-membrane vesicles from yeast overexpressing CAN1. Eur. J. Biochem. 211, 683–688 [DOI] [PubMed] [Google Scholar]
- 19. Malinsky J., Opekarová M., Tanner W. (2010) The lateral compartmentation of the yeast plasma membrane. Yeast 27, 473–478 [DOI] [PubMed] [Google Scholar]
- 20. Spira F., Mueller N. S., Beck G., von Olshausen P., Beig J., Wedlich-Söldner R. (2012) Patchwork organization of the yeast plasma membrane into numerous coexisting domains. Nat. Cell Biol. 14, 640–648 [DOI] [PubMed] [Google Scholar]
- 21. MacGurn J. A., Hsu P. C., Smolka M. B., Emr S. D. (2011) TORC1 regulates endocytosis via Npr1-mediated phosphoinhibition of a ubiquitin ligase adaptor. Cell 147, 1104–1117 [DOI] [PubMed] [Google Scholar]
- 22. Opekarová M., Robl I., Tanner W. (2002) Phosphatidyl ethanolamine is essential for targeting the arginine transporter Can1p to the plasma membrane of yeast. Biochim. Biophys. Acta 1564, 9–13 [DOI] [PubMed] [Google Scholar]
- 23. Altschul S. F., Madden T. L., Schäffer A. A., Zhang J., Zhang Z., Miller W., Lipman D. J. (1997) Gapped BLAST and PSI-BLAST. A new generation of protein database search programs. Nucleic Acids Res. 25, 3389–3402 [DOI] [PMC free article] [PubMed] [Google Scholar]
- 24. Berman H. M., Westbrook J., Feng Z., Gilliland G., Bhat T. N., Weissig H., Shindyalov I. N., Bourne P. E. (2000) The Protein Data Bank. Nucleic Acids Res. 28, 235–242 [DOI] [PMC free article] [PubMed] [Google Scholar]
- 25. UniProt Consortium (2012) Reorganizing the protein space at the Universal Protein Resource (UniProt). Nucleic Acids Res. 40, D71–D75 [DOI] [PMC free article] [PubMed] [Google Scholar]
- 26. Pei J., Kim B. H., Grishin N. V. (2008) PROMALS3D. A tool for multiple protein sequence and structure alignments. Nucleic Acids Res. 36, 2295–2300 [DOI] [PMC free article] [PubMed] [Google Scholar]
- 27. Huang X., Miller W. (1991) A time-efficient, linear-space local similarity algorithm. Adv. Appl. Math. 12, 337–357 [Google Scholar]
- 28. Tusnády G. E., Simon I. (2001) The HMMTOP transmembrane topology prediction server. Bioinformatics. 17, 849–850 [DOI] [PubMed] [Google Scholar]
- 29. Hofmann K., Stoffel W. (1993) TMbase. A database of membrane spanning protein segments. Biol. Chem. Hoppe-Seyler 374, 166 [Google Scholar]
- 30. Fiser A., Sali A. (2003) Modeller. Generation and refinement of homology-based protein structure models. Methods Enzymol. 374, 461–491 [DOI] [PubMed] [Google Scholar]
- 31. Laskowski R. A., MacArthur M. W., Moss D. S., Thornton J. M. (1993) PROCHECK. A program to check the stereochemical quality of protein structures. J. Appl. Crystallogr. 26, 283–291 [Google Scholar]
- 32. Li H., Robertson A. D., Jensen J. H. (2005) Very fast empirical prediction and rationalization of protein pKa values. Proteins 61, 704–721 [DOI] [PubMed] [Google Scholar]
- 33. Friesner R. A., Murphy R. B., Repasky M. P., Frye L. L., Greenwood J. R., Halgren T. A., Sanschagrin P. C., Mainz D. T. (2006) Extra precision glide. Docking and scoring incorporating a model of hydrophobic enclosure for protein-ligand complexes. J. Med. Chem. 49, 6177–6196 [DOI] [PubMed] [Google Scholar]
- 34. Lyne P. D., Lamb M. L., Saeh J. C. (2006) Accurate prediction of the relative potencies of members of a series of kinase inhibitors using molecular docking and MM-GBSA scoring. J. Med. Chem. 49, 4805–4808 [DOI] [PubMed] [Google Scholar]
- 35. Graves A. P., Shivakumar D. M., Boyce S. E., Jacobson M. P., Case D. A., Shoichet B. K. (2008) Rescoring docking hit lists for model cavity sites. Predictions and experimental testing. J. Mol. Biol. 377, 914–934 [DOI] [PMC free article] [PubMed] [Google Scholar]
- 36. Hou T., Wang J., Li Y., Wang W. (2011) Assessing the performance of the molecular mechanics/Poisson Boltzmann surface area and molecular mechanics/generalized Born surface area methods. II. The accuracy of ranking poses generated from docking. J. Comput. Chem. 32, 866–877 [DOI] [PMC free article] [PubMed] [Google Scholar]
- 37. Du J., Sun H., Xi L., Li J., Yang Y., Liu H., Yao X. (2011) Molecular modeling study of checkpoint kinase 1 inhibitors by multiple docking strategies and prime/MM-GBSA calculation. J. Comput. Chem. 32, 2800–2809 [DOI] [PubMed] [Google Scholar]
- 38. Hayes J. M., Archontis G. (2012) MM-GB(PB)SA calculations of protein-ligand binding free energies. in Molecular Dynamics: Studies of Synthetic and Biological Macromolecules (Wang L., ed) InTech, Rijeka, Croatia [Google Scholar]
- 39. Hou T., Wang J., Li Y., Wang W. (2011) Assessing the performance of the MM/PBSA and MM/GBSA methods. 1. The accuracy of binding free energy calculations based on molecular dynamics simulations. J. Chem. Inf. Model. 51, 69–82 [DOI] [PMC free article] [PubMed] [Google Scholar]
- 40. Greenidge P. A., Kramer C., Mozziconacci J. C., Wolf R. M. (2013) MM/GBSA binding energy prediction on the PDBbind data set. Successes, failures, and directions for further improvement. J. Chem. Inf. Model. 53, 201–209 [DOI] [PubMed] [Google Scholar]
- 41. Ullmann R. T., Ullmann G. M. (2011) Coupling of protonation, reduction, and conformational change in azurin from Pseudomonas aeruginosa investigated with free energy measures of cooperativity. J. Phys. Chem. B 115, 10346–10359 [DOI] [PubMed] [Google Scholar]
- 42. Ullmann R. T., Andrade S. L., Ullmann G. M. (2012) Thermodynamics of transport through the ammonium transporter Amt-1 investigated with free energy calculations. J. Phys. Chem. B 116, 9690–9703 [DOI] [PubMed] [Google Scholar]
- 43. Ullmann R. T., Ullmann G. M. (2012) GMCT. A Monte Carlo simulation package for macromolecular receptors. J. Comput. Chem. 33, 887–900 [DOI] [PubMed] [Google Scholar]
- 44. Brohée S., Janky R., Abdel-Sater F., Vanderstocken G., André B., van Helden J. (2011) Unraveling networks of co-regulated genes on the sole basis of genome sequences. Nucleic Acids Res. 39, 6340–6358 [DOI] [PMC free article] [PubMed] [Google Scholar]
- 45. Bechet J., Greenson M., Wiame J. M. (1970) Mutations affecting the repressibility of arginine biosynthetic enzymes in Saccharomyces cerevisiae. Eur. J. Biochem. 12, 31–39 [DOI] [PubMed] [Google Scholar]
- 46. Jacobs P., Jauniaux J. C., Grenson M. (1980) A cis-dominant regulatory mutation linked to the argB-argC gene cluster in Saccharomyces cerevisiae. J. Mol. Biol. 139, 691–704 [DOI] [PubMed] [Google Scholar]
- 47. Godard P., Urrestarazu A., Vissers S., Kontos K., Bontempi G., van Helden J., André B. (2007) Effect of 21 different nitrogen sources on global gene expression in the yeast Saccharomyces cerevisiae. Mol. Cell. Biol. 27, 3065–3086 [DOI] [PMC free article] [PubMed] [Google Scholar]
- 48. Bonneaud N., Ozier-Kalogeropoulos O., Li G. Y., Labouesse M., Minvielle-Sebastia L., Lacroute F. (1991) A family of low and high copy replicative, integrative and single-stranded S. cerevisiae/E. coli shuttle vectors. Yeast 7, 609–615 [DOI] [PubMed] [Google Scholar]
- 49. Hein C., Springael J. Y., Volland C., Haguenauer-Tsapis R., André B. (1995) NPl1, an essential yeast gene involved in induced degradation of Gap1 and Fur4 permeases, encodes the Rsp5 ubiquitin-protein ligase. Mol. Microbiol. 18, 77–87 [DOI] [PubMed] [Google Scholar]
- 50. De Craene J. O., Soetens O., Andre B. (2001) The Npr1 kinase controls biosynthetic and endocytic sorting of the yeast Gap1 permease. J. Biol. Chem. 276, 43939–43948 [DOI] [PubMed] [Google Scholar]
- 51. Liang J., Naveed H., Jimenez-Morales D., Adamian L., Lin M. (2012) Computational studies of membrane proteins. Models and predictions for biological understanding. Biochim. Biophys. Acta 1818, 927–941 [DOI] [PMC free article] [PubMed] [Google Scholar]
- 52. Kozma D., Simon I., Tusnády G. E. (2013) PDBTM. Protein Data Bank of transmembrane proteins after 8 years. Nucleic Acids Res. 41, D524-D529 [DOI] [PMC free article] [PubMed] [Google Scholar]
- 53. Nilsson J., Persson B., von Heijne G. (2005) Comparative analysis of amino acid distributions in integral membrane proteins from 107 genomes. Proteins 60, 606–616 [DOI] [PubMed] [Google Scholar]
- 54. Killian J. A., von Heijne G. (2000) How proteins adapt to a membrane-water interface. Trends Biochem. Sci. 25, 429–434 [DOI] [PubMed] [Google Scholar]
- 55. Oh B. H., Ames G. F., Kim S. H. (1994) Structural basis for multiple ligand specificity of the periplasmic lysine-, arginine-, ornithine-binding protein. J. Biol. Chem. 269, 26323–26330 [PubMed] [Google Scholar]
- 56. Cheng T., Li X., Li Y., Liu Z., Wang R. (2009) Comparative assessment of scoring functions on a diverse test set. J. Chem. Inf. Model. 49, 1079–1093 [DOI] [PubMed] [Google Scholar]
- 57. Li J., Abel R., Zhu K., Cao Y., Zhao S., Friesner R. A. (2011) The VSGB 2.0 model. A next generation energy model for high resolution protein structure modeling. Proteins 79, 2794–2812 [DOI] [PMC free article] [PubMed] [Google Scholar]
- 58. Malinská K., Malinský J., Opekarová M., Tanner W. (2003) Visualization of protein compartmentation within the plasma membrane of living yeast cells. Mol. Biol. Cell 14, 4427–4436 [DOI] [PMC free article] [PubMed] [Google Scholar]
- 59. Fischer W. N., Loo D. D., Koch W., Ludewig U., Boorer K. J., Tegeder M., Rentsch D., Wright E. M., Frommer W. B. (2002) Low and high affinity amino acid H+-cotransporters for cellular import of neutral and charged amino acids. Plant J. 29, 717–731 [DOI] [PubMed] [Google Scholar]
- 60. Fang Y., Jayaram H., Shane T., Kolmakova-Partensky L., Wu F., Williams C., Xiong Y., Miller C. (2009) Structure of a prokaryotic virtual proton pump at 3.2 Å resolution. Nature 460, 1040–1043 [DOI] [PMC free article] [PubMed] [Google Scholar]
- 61. Yamashita A., Singh S. K., Kawate T., Jin Y., Gouaux E. (2005) Crystal structure of a bacterial homologue of Na+/Cl−-dependent neurotransmitter transporters. Nature 437, 215–223 [DOI] [PubMed] [Google Scholar]
- 62. Forrest L. R., Krämer R., Ziegler C. (2011) The structural basis of secondary active transport mechanisms. Biochim. Biophys. Acta 1807, 167–188 [DOI] [PubMed] [Google Scholar]
- 63. Law C. J., Maloney P. C., Wang D. N. (2008) Ins and outs of major facilitator superfamily antiporters. Annu. Rev. Microbiol. 62, 289–305 [DOI] [PMC free article] [PubMed] [Google Scholar]
- 64. Law C. J., Yang Q., Soudant C., Maloney P. C., Wang D. N. (2007) Kinetic evidence is consistent with the rocker-switch mechanism of membrane transport by GlpT. Biochemistry 46, 12190–12197 [DOI] [PMC free article] [PubMed] [Google Scholar]
- 65. Hein C., André B. (1997) A C-terminal di-leucine motif and nearby sequences are required for NH4(+)-induced inactivation and degradation of the general amino acid permease, Gap1p, of Saccharomyces cerevisiae. Mol. Microbiol. 24, 607–616 [DOI] [PubMed] [Google Scholar]
- 66. Brohée S., Barriot R., Moreau Y., André B. (2010) YTPdb. A wiki database of yeast membrane transporters. Biochim. Biophys. Acta 1798, 1908–1912 [DOI] [PubMed] [Google Scholar]
- 67. Frishman D., Argos P. (1995) Knowledge-based protein secondary structure assignment. Proteins 23, 566–579 [DOI] [PubMed] [Google Scholar]
- 68. Humphrey W., Dalke A., Schulten K. (1996) VMD. Visual molecular dynamics. J. Mol. Graph. 14, 33–38, 27–28 [DOI] [PubMed] [Google Scholar]
- 69. Larkin M. A., Blackshields G., Brown N. P., Chenna R., McGettigan P. A., McWilliam H., Valentin F., Wallace I. M., Wilm A., Lopez R., Thompson J. D., Gibson T. J., Higgins D. G. (2007) ClustalW and ClustalX version 2.0. Bioinformatics 23, 2947–2948 [DOI] [PubMed] [Google Scholar]