Abstract
Objective:
To establish cerebral metabolic features associated with the A3243G mitochondrial DNA mutation with proton magnetic resonance spectroscopic imaging (1H MRSI) and to assess their potential as prognostic biomarkers.
Methods:
In this prospective cohort study, we investigated 135 clinically heterogeneous A3243G mutation carriers and 30 healthy volunteers (HVs) with 1H MRSI. Mutation carriers included 45 patients with mitochondrial encephalomyopathy, lactic acidosis, and stroke-like episodes (MELAS); 11 participants who would develop the MELAS syndrome during follow-up (converters); and 79 participants who would not develop the MELAS syndrome during follow-up (nonconverters). The groups were compared with respect to MRSI metabolic indices of 1) anaerobic energy metabolism (lactate), 2) neuronal integrity (N-acetyl-l-aspartate [NAA]), 3) mitochondrial function (NAA; lactate), 4) cell energetics (total creatine), and 5) membrane biosynthesis and turnover (total choline [tCho]).
Results:
Consistent with prior studies, the patients with MELAS had higher lactate (p < 0.001) and lower NAA levels (p = 0.01) than HVs. Unexpectedly, converters showed higher NAA (p = 0.042), tCho (p = 0.004), and total creatine (p = 0.002), in addition to higher lactate levels (p = 0.032), compared with HVs. Compared with nonconverters, converters had higher tCho (p = 0.015). Clinically, converters and nonconverters did not differ at baseline. Lactate and tCho levels were reliable biomarkers for predicting the risk of individual mutation carriers to develop the MELAS phenotype.
Conclusions:
1H MRSI assessment of cerebral metabolism in A3243G mutation carriers shows promise in identifying disease biomarkers as well as individuals at risk of developing the MELAS phenotype.
Mitochondrial encephalomyopathies are a clinically heterogeneous group of disorders caused by impairment of the mitochondrial respiratory chain. These disorders often present as discrete clinical syndromes such as mitochondrial encephalomyopathy, lactic acidosis, and stroke-like episodes (MELAS). Most patients with MELAS harbor an A to G transition at nucleotide 3243 (A3243G) in the mitochondrial tRNALeu(UUR) gene.1,2 Heteroplasmy and mitotic segregation lead to different mutational burden between and within tissues and to diverse clinical phenotypes, ranging from asymptomatic carriers to fully symptomatic patients with MELAS.3,4 For key organs, such as the brain, the mutational burden cannot be quantified in vivo. Surrogate biomarkers, therefore, are needed to anticipate the potential of presymptomatic or prodromal individual A3243G mutation carriers to convert to the full MELAS syndrome. These at-risk carriers, then, would be good candidates for available proactive symptomatic and future disease-modifying treatments.
Our group is continuing a multiyear longitudinal study to assess the utility of noninvasive proton magnetic resonance spectroscopic imaging (1H MRSI) in evaluating mitochondrial disorders. Previously, we5 and others6–10 had reported elevated cerebral lactate levels in patients with MELAS and their mutation carrier relatives. In the present study, we compared clinically heterogeneous subgroups of A3243G mutation carriers and evaluated the utility of magnetic resonance spectroscopy (MRS)-derived metabolite levels as biomarkers for predicting whether an asymptomatic or prodromal mutation carrier would convert to MELAS. We hypothesized that metabolic abnormalities detected by 1H MRSI would reflect compensatory processes in the brain associated with the A3243G mutation and thus be indicative of overall disease activity or burden and, possibly, prognosis.
METHODS
Standard protocol approvals, registrations, and patient consents.
After providing written informed consent, participants were enrolled in the study between September 1995 and September 2007 as part of an ongoing longitudinal study approved by the Institutional Review Boards of Columbia University Medical Center and Weill Cornell Medical College.
Study sample and subgrouping.
The results presented in this study were obtained from an extended retrospective analysis of previously reported neurometabolic and clinical data5 and from additional data obtained since that initial publication. All neuroimaging, clinical, and laboratory assessments were conducted at Columbia University Medical Center, and processing and analysis of the neuroimaging data took place at Weill Cornell Medical College. Evaluation and neuroimaging of MELAS probands took place when they were clinically stable and more than 3 months after any stroke-like episodes.
This study includes data from 135 subjects harboring the A3243G mutation, and from 30 healthy volunteers (HVs) who were mostly paternal relatives and had no family history of primary mitochondrial disease. Of the 135 mutation carriers, 45 fulfilled the diagnostic criteria for the MELAS phenotype at baseline and 11 ultimately fulfilled criteria for MELAS during the follow-up period (converters). The MELAS phenotype was defined as lactic acidosis in addition to evidence for stroke-like episodes, seizures, or both.
Seventy-nine mutation carriers did not fulfill these criteria either at baseline or during follow-up and were therefore categorized as nonconverters. Nearly half of the MELAS group (22/45) and two-thirds (63/90) of the carrier relatives were female. The groups differed in mean age (p < 0.001): 29 ± 15 years for the MELAS group, 36 ± 16 years for converters, 36 ± 18 years for nonconverters, and 49 ± 14 years for controls.
Proton magnetic resonance neuroimaging and clinical data.
Multislice 1H MRSI scans11 were conducted in all participants using the same 1.5T GE MRI system as previously described.5 The MRSI data were recorded from two 15-mm axial-oblique brain slices with the lower encompassing the lateral ventricles, using the following parameters: echo time/repetition time 280/2,300 milliseconds, field of view 240 mm, 32 × 32 phase-encoding steps with circular k-space sampling, and 256 sample points. The undesired pericranial lipid resonances were suppressed using octagonally tailored outer volume presaturation pulses.11 Spectral resonances were quantitated by integration and then the associated metabolite levels were expressed in institutional units as peak area ratios relative to the root mean square of the background noise in each voxel, as previously described.5 To minimize the contribution of the disproportionately abnormal metabolite changes due to prior stroke-like episodes in participants with MELAS, voxels in visible focal lesions were explicitly avoided during selection of the regions of interest for this group. In aggregate, complete MRSI data were available for 130 subjects (37 MELAS, 10 converters, 62 nonconverters, and 20 controls).
In addition, all subjects underwent standardized neurologic and neuropsychological examinations, namely, the Columbia Neurological Score (CNS) and the Global Neuropsychological (GNP) score. The CNS is a well-established neurologic history and examination metric yielding summary scores ranging from 0 to 76, with 76 representing normal.5,12,13 For the GNP score, individual age-appropriate neuropsychological test scores were expressed as percentiles of normative data and transformed into 1 z score. Thus, the CNS and GNP score reflect the magnitude, not the specificity, of involvement. They were available, respectively, for 45 and 41 patients with MELAS, 11 and 9 converters, 78 and 48 nonconverters, and for 30 and 17 controls.
To estimate the A3243G mutation load in the carriers, PCR amplification and restriction fragment length polymorphism analysis of total DNA extracted from leukocytes were performed as previously reported.14
Statistical analysis.
Statistical analyses were conducted using IBM SPSS Statistics, version 18 (SPSS Inc., Chicago, IL). The normality of the data for each group was assessed with Shapiro-Wilk tests. Mean regional brain metabolite levels derived by MRSI, clinical scores, and mutation loads were compared among patients with MELAS, converters, nonconverters, and HVs using analysis of covariance at the significance level α < 0.05, taking into account the possible influence of age and the interaction with age. In the absence of main effects of age or its interactions, 1-way analysis of variance with group as the factor of main interest was performed and the results were confirmed by Welch tests as warranted. Pairwise group comparisons for unequal sample sizes were conducted with Games-Howell tests. For N-acetyl-l-aspartate (NAA), total choline (tCho), and total creatine (tCr), gray matter concentrations were the primary outcome measures, while for lactate, ventricular levels were the primary outcome. The analyses for all other regions were secondary and, thus, exploratory.
Follow-up time and age at the time of the last study visit for converters and nonconverters were compared using independent sample t tests. Associations among metabolite levels, mutation loads in different tissues, and main indices of clinical status (CNS, GNP) were assessed using Spearman correlation coefficients with Bonferroni correction for multiple comparisons.
To assess the potential prognostic value of MRSI-derived regional metabolite levels, we conducted binary logistic regression analyses with conversion to MELAS among the mutation carriers without MELAS as the dependent variable, and regional metabolites and clinical scores as predictors.
RESULTS
Regional brain metabolite levels.
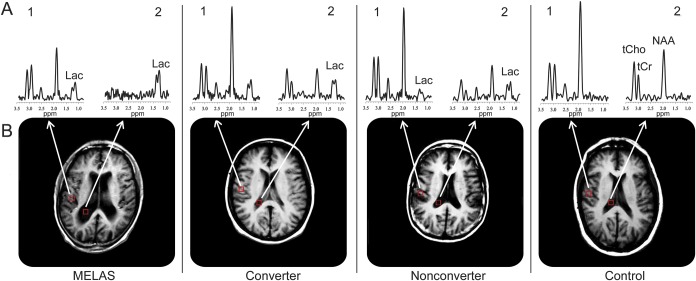
In this study, we compared the cerebral metabolic features of clinically heterogeneous MELAS A3243G mutation carriers and those in healthy control subjects (figure 1), and found regional differences, primarily in gray matter (figure 2).
Figure 1. Representative spectra from 2 voxels of interest in the 4 diagnostic groups.
Representative spectra (A) of T1-weighted brain MRIs (B) for voxels (1) in the right parietal gray matter and (2) in the lateral ventricle of, left to right, a patient with mitochondrial encephalomyopathy, lactic acidosis, and stroke-like episodes (MELAS); a converter; a nonconverter; and a healthy control subject. To achieve a smooth representation and drawing of the ventricular region of interest, the magnetic resonance spectroscopic imaging (MRSI) data matrix was zero-filled to 64 × 64 points along the spatial domains, which effectively halved the voxel size without increasing or decreasing information content—current information is simply replicated in twice as many voxels. Spectral resonances identified are those for total choline-containing compounds (tCho at 3.24 ppm), total creatine (tCr at 3.03 ppm), N-acetyl-l-aspartate (NAA at 2.02 ppm), and lactate (Lac at 1.33 ppm). Note a clearly visible Lac peak in the spectra from all the carrier groups but not in the spectrum from the healthy control subject. All of the spectra are plotted using the same vertical-axis scale.
Figure 2. Comparison of brain metabolite levels as measured by proton magnetic resonance spectroscopic imaging.
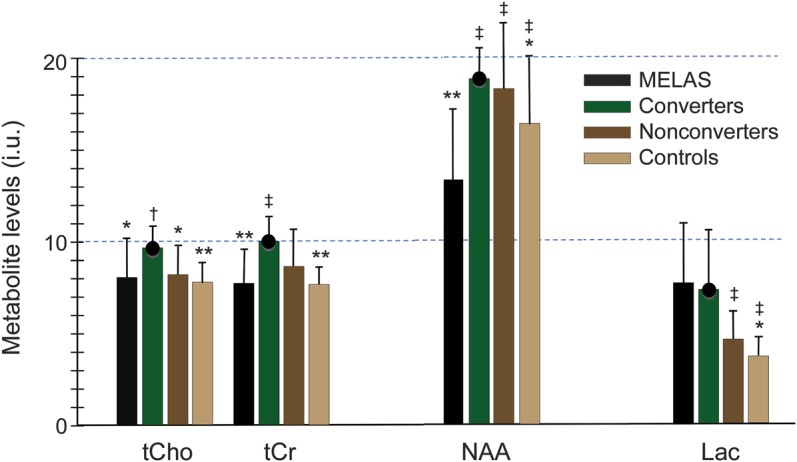
Mean metabolite levels in institutional units (i.u.) and SDs for N-acetyl-l-aspartate (NAA), lactate (Lac), total creatine (tCr), and total choline (tCho) in the 4 diagnostic groups. Significant differences relative to the converters are marked by asterisks (*p < 0.05, **p < 0.01) and relative to the mitochondrial encephalomyopathy, lactic acidosis, and stroke-like episodes (MELAS) group by daggers (†p < 0.05, ‡p < 0.01). The black circle atop the bar for the converters emphasizes the concerted and unanticipated increases in all metabolite levels in this group.
Ventricular lactate.
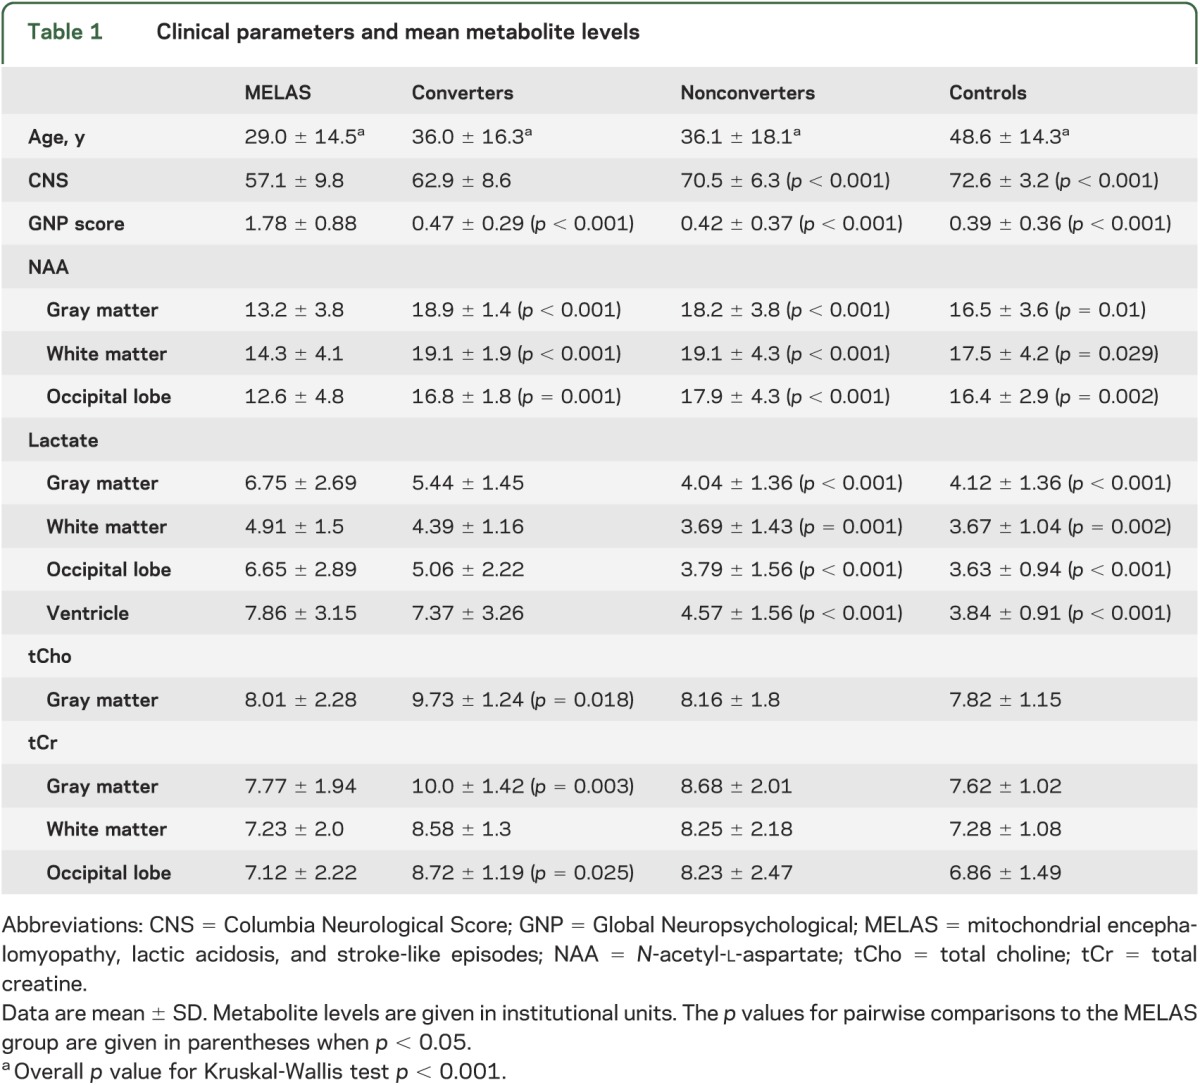
Lactate levels increased in the order HVs < nonconverters < converters < patients with MELAS (figure 2, table 1), in which values for the patients with MELAS were higher than those for the nonconverters (p < 0.001) and for the controls (p < 0.001). Both converters (p = 0.032) and nonconverters (p = 0.048) had higher lactate levels than the control group.
Table 1.
Clinical parameters and mean metabolite levels
Gray matter NAA.
Pairwise group comparisons revealed decreased NAA levels in the MELAS group relative to every other group (figure 2, table 1). In the converters, we found that NAA levels were higher than in HVs (p = 0.042).
Total gray matter creatine.
The tCr levels were higher in the converter than in the MELAS (p = 0.003) and healthy control (p = 0.002) groups (figure 2, table 1). Nonconverters had higher tCr than controls (p = 0.014).
Total gray matter choline.
The tCho levels were comparable among MELAS, nonconverter, and control groups (figure 2, table 1), but were higher in converters than in patients with MELAS (p = 0.018), healthy controls (p = 0.004), and nonconverters (p = 0.015).
Predictive value of neurometabolite levels.
Logistic regression analyses identified ventricular lactate and gray matter tCho levels as reliable predictors of individual risk to become fully symptomatic in mutation carriers without MELAS (Wald, p = 0.008 and p = 0.049, respectively). Overall prediction success rate was 87.3% (40% for converters and 95.1% for nonconverters). The odds ratio for ventricular lactate indicates that with all other factors, including tCho levels, held constant, decreasing its value by 1 unit nearly halves the likelihood of a mutation carrier to convert to MELAS. Similarly, decreasing the gray matter tCho value by 1 unit decreases the likelihood of a mutation carrier to become fully symptomatic. The other metabolites and clinical indices were not significant predictors and were thus removed from the model.
Clinical characterization.
Converters and nonconverters with MRS at baseline were followed up for 5.6 ± 3.1 years and 3.5 ± 3.8 years, respectively, without a difference between the groups (p = 0.09, t72 = 1.70). Also, the age at the final study visit did not differ between converters (42.8 ± 17.9) and nonconverters (41.4 ± 19.0) (p = 0.83, t72 = 0.21). Twenty-seven of 64 nonconverters with initial MRS scans were lost to follow-up within 1 year. The diagnosis of the MELAS syndrome in converters was confirmed at a mean age of 39.8 ± 19.0 years. Details on the clinical circumstances or potential triggers were not analyzed.
One-way analysis of variance revealed a main group effect on CNS (F3,160 = 41.97, p < 0.001) and on GNP score (F3,111 = 45.47, p < 0.001). However, there were no differences in CNS or GNP scores between converters and nonconverters. Pairwise comparisons showed declining CNS in the order MELAS < converters < nonconverters < healthy controls, with significant differences between MELAS, nonconverters, and controls (table 1), and between converters and controls (p = 0.016). The MELAS group had higher neuropsychological dysfunction than any other group (GNP, p < 0.001). The mutational load was higher in the skin (42.8 ± 27.4 vs 22.3 ± 27.5) and in the blood (24.1 ± 16.6 vs 11.3 ± 15.6) of converters than nonconverters (p = 0.02 and p = 0.03, respectively).
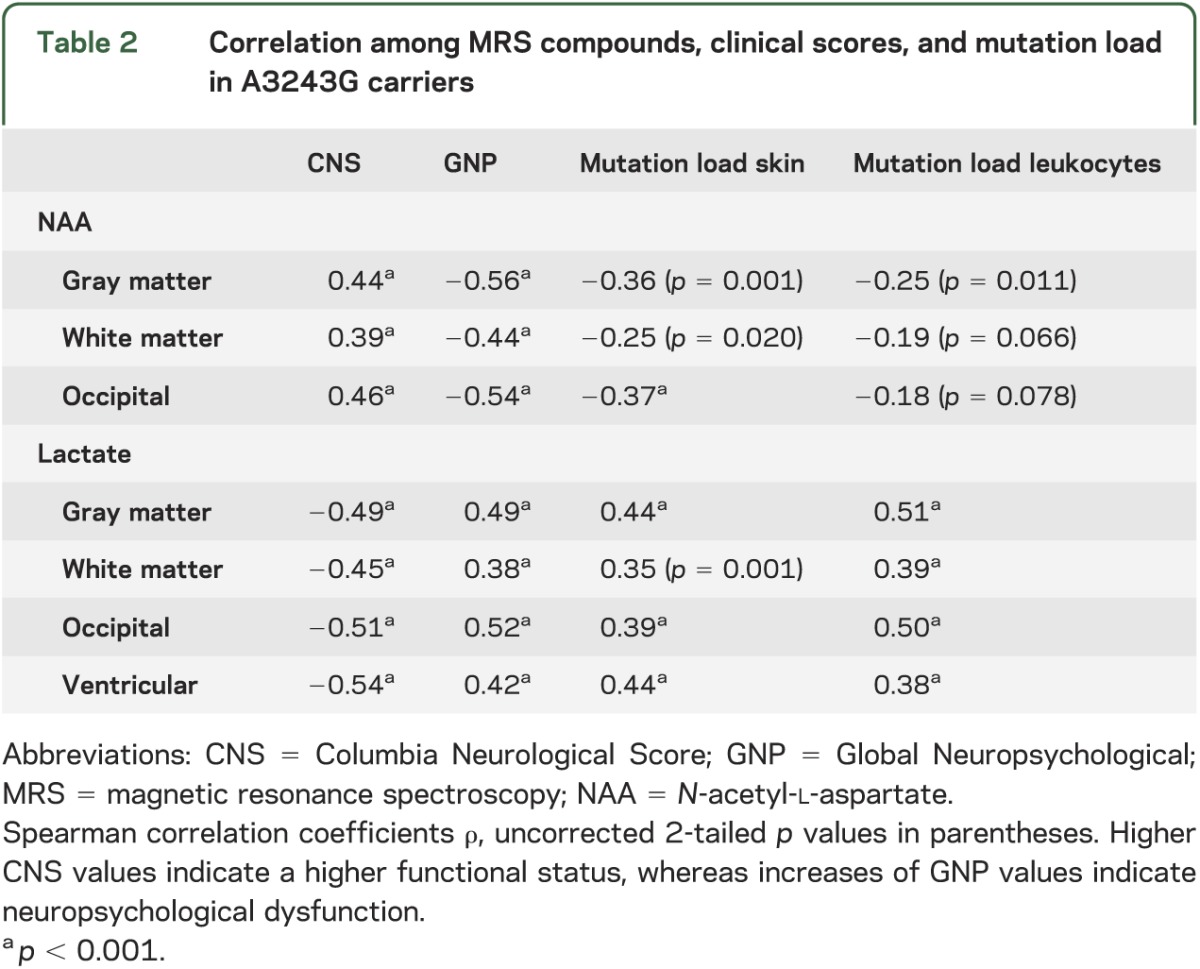
Levels of NAA decreased and lactate concentrations increased with clinical impairment as assessed by the GNP score and the CNS (figure 3, table 2). In addition, levels of NAA decreased and levels of lactate increased with higher mutation load in skin and leukocytes.
Figure 3. Associations between magnetic resonance spectroscopy metabolites and clinical indices in mutation carriers.
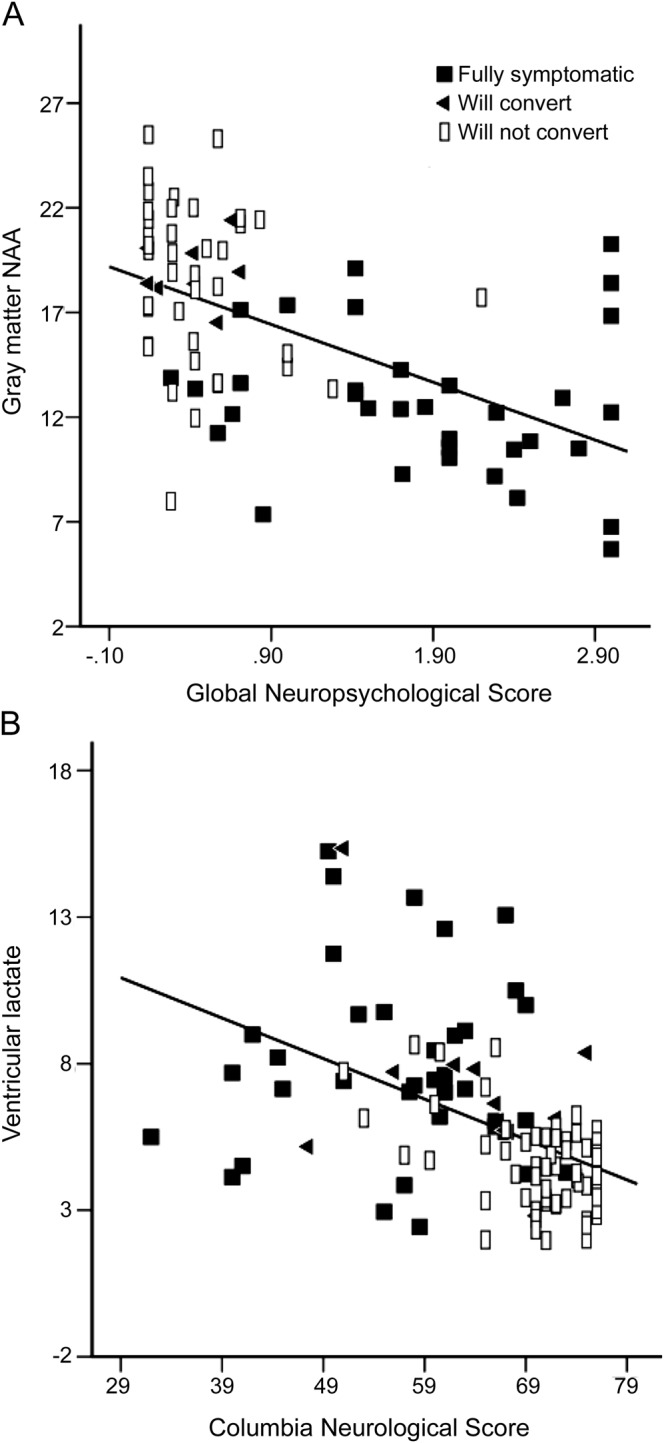
(A) Negative linear relationship between gray matter N-acetyl-l-aspartate (NAA) and the Global Neuropsychological score, indicating lower NAA concentrations in those individuals with higher neuropsychological dysfunction. (B) Inverse relationship between lactate levels and the neurologic status, indicating higher lactate in those with pronounced neurologic impairment.
Table 2.
Correlation among MRS compounds, clinical scores, and mutation load in A3243G carriers
DISCUSSION
In this study, we characterized the cerebral metabolic features in clinically heterogeneous subjects harboring the MELAS A3243G mutation and identified extensive abnormalities, not only in fully symptomatic patients, but also in carriers who would ultimately progress to develop the MELAS syndrome (i.e., converters). In addition, we report an unanticipated finding in the latter group of participants, which suggests that conversion to the full MELAS syndrome may be preceded by cellular attempts to compensate for declining bioenergetics. Lastly, we provide preliminary evidence of the utility of cerebral metabolic biomarkers as potential predictors of the conversion to MELAS in clinically silent or prodromal A3243G mutation carriers. Distinct strengths of this study include the comparatively large sample size of genetically homogeneous carriers of the MELAS mutation, the high level of standardization regarding the clinical evaluations, and use of state-of-the-art multislice 1H MRSI data acquisition and analysis techniques. Direct comparison of follow-up times and age at the last study visit showed that nonconverters were followed up for a sufficiently long time to detect late manifestation of the MELAS syndrome.
Elevations of brain lactate are generally indicative of increased anaerobic glycolytic rates to compensate for insufficient energy production through oxidative phosphorylation under conditions of ischemia, hypoxia, or mitochondrial dysfunction.15,16 Therefore, it is not surprising that we found increased lactate levels in all A3243G mutation carriers, consistent with prior studies.5–10,12,17–19
Also consistent with prior studies,7,9 we found NAA reductions in patients with MELAS compared with all other groups. Because it is found almost exclusively in neurons and synthesized in neuronal mitochondria, NAA reductions generally reflect neuronal injury, dysfunction, or loss, and/or impaired mitochondrial function.20 Viewed in this context, our observation of higher NAA levels in converters than in the HV group (figure 2) was not only unanticipated, but also seemed paradoxical. However, because our observation of lactate elevations in converters (figure 2) strongly supports impaired mitochondrial energy metabolism in this group,5,10,21 we postulate that these seemingly paradoxical elevations of NAA are a consequence of a compensatory mechanism, commonly known as mitochondrial proliferation,22–24 which has not been previously documented in the brain, but is the well-established “ragged red fibers” feature that has been consistently found in the skeletal muscle of patients with mitochondrial myopathies,25–27 including MELAS. Although primarily recognized in skeletal muscle, mitochondrial proliferation has also been documented as a compensatory mechanism in other high energy-consuming tissues, including in kidney after unilateral nephrectomy,28 in pathologic hypertrophic heart,29,30 or in normal heart after endurance exercise,31 as well as in experimental hearts subjected to chronic energy deprivation.24,32
There is strong evidence that mitochondrial proliferation as a compensatory mechanism across tissues or conditions occurs in response to signaling for a perceived or actual cellular energy challenge, because increased induction of energy metabolism-associated gene expression, manifest in the upregulation of both nuclear and mitochondrial transcripts, is a consistently reported and replicated finding.14,24,29–34 Thus, mitochondrial proliferation and the “hypermetabolic state” that would very likely be associated could explain, not only our finding of higher NAA levels in converters than in HVs, but also our equally unanticipated findings of higher tCr and tCho in converters than in the HV group. First, because NAA is synthesized in neuronal mitochondria,20 it is plausible that our observation of higher NAA in the converters than in the HV group could be the result of an increase in the metabolic activity associated with mitochondrial proliferation in the carrier group. Second, mitochondrial proliferation and the associated hypermetabolic state could similarly lead to increases of tCr—an energy metabolite whose synthesis and availability is likely to be increased in response to an increase in energy demand, as in our demonstration of clear elevations of tCr in rapidly proliferating human brain glial tumors in vivo.35 Lastly, there is evidence that mitochondrial proliferation involves upregulation of membrane phospholipid turnover and biosynthesis, with concomitant increases of total free choline. Cell membrane phospholipid incorporation of 14C-labeled choline has been documented to be increased by as much as 68% of basal rates during compensatory kidney growth after unilateral nephrectomy36—a process established to involve mitochondrial proliferation.28 Moreover, elevations of tCho levels are a common metabolic feature of proton magnetic resonance spectra in rapid neoplastic proliferation.37 However, because mitochondrial proliferation in MELAS involves defective or mutated mitochondria, the postulated compensatory mechanism may be ultimately maladaptive or futile,24,30 because it also increases the population of deficient mitochondria, which, with time, would lead to energy insufficiency. Therefore, upon conversion to the full MELAS syndrome, the postulated hypermetabolic state would likely not be sustained and levels of NAA, tCr, and tCho would decrease, in agreement with the results of this and prior studies in MELAS.7,9,17,38,39
Logistic regression analyses identified ventricular lactate and gray matter tCho as predictors of conversion to the MELAS phenotype. The other metabolites and clinical indices were not predictors. Based on a model including lactate and tCho as the sole predictors, a decrease by 1 unit of either metabolite in a mutation carrier without MELAS almost halved an individual's odds of developing the MELAS phenotype in the future (as defined by the duration of our follow-up study). However, while nonconverters could be classified correctly in almost all cases, the false-negative rate in converters was very high. This is likely attributable to the relatively small size of the converter group relative to the nonconverters, as well as to the inherent clinical heterogeneity of the carrier sample. For instance, the time to conversion was not considered in the present study. Repeated examination of individual mutation carriers over time might be more informative and reliable than the present cross-sectional evaluation. Nevertheless, the present results seem to support MRS-derived lactate and tCho levels as promising predictors of future clinical phenotypes. This predictive power also would justify more aggressive management proactively, particularly when more effective disease-modifying therapies become available.
Significantly, the clinical scores (CNS, GNP) neither differed between the converters and the nonconverters nor contributed to the prediction model, further underscoring the need for objective disease biomarkers. The patients with MELAS and the converters had comparable CNS, indicating that detectable neurologic deficits were already present in the latter group before their conversion to the MELAS phenotype. It is thus likely that a progressive encephalopathy develops early in the disease process before the onset of the defining focal brain injury.1,5 The observed metabolic abnormalities in carrier relatives support this view of an active progressive disease process, which is also consistent with previous reports of protean clinical and laboratory abnormalities in A3243G mutation carriers who do not fulfill the criteria for MELAS.4
This study has several limitations. First, we did not perform brain tissue segmentation to correct the derived metabolite levels for gray matter, white matter, or CSF content of each region of interest. This might have resulted in underestimation of metabolite levels in participants with significant brain atrophy,40 thereby masking potentially larger group differences between converters and nonconverters. Second, our regions-of-interest definition was less than optimal because of the need to avoid selecting voxels in brain regions with visible focal lesions. Third, the sample of participants, including the healthy controls, was relatively small and fixed, suggesting caution in interpreting the present results until they are replicated. Lastly, the healthy control group was recruited mainly from family members, so that it quite likely did not represent a random sampling of the general population. However, the similarity in socioeconomic background between controls and mutation carriers, in fact, might have increased the appropriateness of this comparison by minimizing the heterogeneity in lifestyle factors that can influence the targeted metabolic markers.
This study using 1H MRSI detected metabolic abnormalities in a heterogeneous group of A3243G mutation carriers that warrant further longitudinal studies to investigate their potential clinical value as biomarkers of conversion risk, disease progression, and therapeutic response. A key finding of this study is that ventricular lactate and gray matter tCho levels may be promising predictors of conversion to the full MELAS syndrome. However, these biomarkers first need to be validated before their clinical deployment can be contemplated.
ACKNOWLEDGMENT
The authors thank Vanessa Battista and Mary Sano for their earlier contributions to this study.
GLOSSARY
- CNS
Columbia Neurological Score
- GNP
Global Neuropsychological
- 1H MRSI
proton magnetic resonance spectroscopic imaging
- HV
healthy volunteer
- MELAS
mitochondrial encephalomyopathy, lactic acidosis, and stroke-like episodes
- MRS
magnetic resonance spectroscopy
- NAA
N-acetyl-l-aspartate
- tCho
total choline
- tCr
total creatine
AUTHOR CONTRIBUTIONS
N. Weiduschat: drafting/revising the manuscript, study concept or design, analysis or interpretation of data, statistical analysis. P. Kaufmann: drafting/revising the manuscript, study concept or design, acquisition of data, study supervision or coordination. X. Mao: study concept or design, analysis or interpretation of data. K. Engelstad: drafting/revising the manuscript, acquisition of data. V. Hinton: analysis or interpretation of data, acquisition of data. S. DiMauro: drafting/revising the manuscript, study concept or design. D. De Vivo: drafting/revising the manuscript, study concept or design, study supervision or coordination. D. Shungu: drafting/revising the manuscript, study concept or design, analysis or interpretation of data, study supervision or coordination.
STUDY FUNDING
Supported by NIH grants PO1HD032062 and R01MH075895, and by the Colleen Giblin Foundation.
DISCLOSURE
The authors report no disclosures relevant to the manuscript. Go to Neurology.org for full disclosures.
REFERENCES
- 1.Hirano M, Pavlakis SG. Mitochondrial myopathy, encephalopathy, lactic acidosis, and strokelike episodes (MELAS): current concepts. J Child Neurol 1994;9:4–13 [DOI] [PubMed] [Google Scholar]
- 2.Goto Y, Nonaka I, Horai S. A mutation in the tRNA(Leu)(UUR) gene associated with the MELAS subgroup of mitochondrial encephalomyopathies. Nature 1990;348:651–653 [DOI] [PubMed] [Google Scholar]
- 3.Graham BH. Diagnostic challenges of mitochondrial disorders: complexities of two genomes. Methods Mol Biol 2012;837:35–46 [DOI] [PubMed] [Google Scholar]
- 4.Kaufmann P, Engelstad K, Wei Y, et al. Protean phenotypic features of the A3243G mitochondrial DNA mutation. Arch Neurol 2009;66:85–91 [DOI] [PMC free article] [PubMed] [Google Scholar]
- 5.Kaufmann P, Shungu DC, Sano MC, et al. Cerebral lactic acidosis correlates with neurological impairment in MELAS. Neurology 2004;62:1297–1302 [DOI] [PubMed] [Google Scholar]
- 6.Dubeau F, De Stefano N, Zifkin BG, et al. Oxidative phosphorylation defects in the brains of carriers of the tRNAleu(UUR) A3243G mutation in a MELAS pedigree. Ann Neurol 2000;47:179–185 [PubMed] [Google Scholar]
- 7.Ito H, Mori K, Harada M, et al. Serial brain imaging analysis of stroke-like episodes in MELAS. Brain Dev 2008;30:483–488 [DOI] [PubMed] [Google Scholar]
- 8.Feng F, You H, Gao J, et al. Evaluation of mitochondrial encephalomyopathy with lactic acidosis and stroke-like episodes with magnetic resonance imaging and proton magnetic resonance spectroscopy. Chin Med Sci J 2006;21:234–238 [PubMed] [Google Scholar]
- 9.Chen C, Xiong N, Wang Y, et al. A study of familial MELAS: evaluation of A3243G mutation, clinical phenotype, and magnetic resonance spectroscopy-monitored progression. Neurol India 2012;60:86–89 [DOI] [PubMed] [Google Scholar]
- 10.Lin DD, Crawford TO, Barker PB. Proton MR spectroscopy in the diagnostic evaluation of suspected mitochondrial disease. AJNR Am J Neuroradiol 2003;24:33–41 [PMC free article] [PubMed] [Google Scholar]
- 11.Duyn JH, Gillen J, Sobering G, van Zijl PC, Moonen CT. Multisection proton MR spectroscopic imaging of the brain. Radiology 1993;188:277–282 [DOI] [PubMed] [Google Scholar]
- 12.Kaufmann P, Engelstad K, Wei Y, et al. Natural history of MELAS associated with mitochondrial DNA m.3243A>G genotype. Neurology 2011;77:1965–1971 [DOI] [PMC free article] [PubMed] [Google Scholar]
- 13.Pearson TS, Akman C, Hinton VJ, Engelstad K, De Vivo DC. Phenotypic spectrum of glucose transporter type 1 deficiency syndrome (Glut1 DS). Curr Neurol Neurosci Rep 2013;13:342. [DOI] [PubMed] [Google Scholar]
- 14.Kaufmann P, Koga Y, Shanske S, et al. Mitochondrial DNA and RNA processing in MELAS. Ann Neurol 1996;40:172–180 [DOI] [PubMed] [Google Scholar]
- 15.Buck LT, Pamenter ME. Adaptive responses of vertebrate neurons to anoxia: matching supply to demand. Respir Physiol Neurobiol 2006;154:226–240 [DOI] [PubMed] [Google Scholar]
- 16.Möller HE, Kurlemann G, Pützler M, Wiedermann D, Hilbich T, Fiedler B. Magnetic resonance spectroscopy in patients with MELAS. J Neurol Sci 2005;229–230:131–139 [DOI] [PubMed] [Google Scholar]
- 17.Wilichowski E, Pouwels PJ, Frahm J, Hanefeld F. Quantitative proton magnetic resonance spectroscopy of cerebral metabolic disturbances in patients with MELAS. Neuropediatrics 1999;30:256–263 [DOI] [PubMed] [Google Scholar]
- 18.Mathews PM, Andermann F, Silver K, Karpati G, Arnold DL. Proton MR spectroscopic characterization of differences in regional brain metabolic abnormalities in mitochondrial encephalomyopathies. Neurology 1993;43:2484–2490 [DOI] [PubMed] [Google Scholar]
- 19.Tsujikawa T, Yoneda M, Shimizu Y, et al. Pathophysiologic evaluation of MELAS strokes by serially quantified MRS and CASL perfusion images. Brain Dev 2010;32:143–149 [DOI] [PubMed] [Google Scholar]
- 20.Birken DL, Oldendorf WH. N-acetyl-L-aspartic acid: a literature review of a compound prominent in 1H-NMR spectroscopic studies of brain. Neurosci Biobehav Rev 1989;13:23–31 [DOI] [PubMed] [Google Scholar]
- 21.Saneto RP, Friedman SD, Shaw DW. Neuroimaging of mitochondrial disease. Mitochondrion 2008;8:396–413 [DOI] [PMC free article] [PubMed] [Google Scholar]
- 22.Wiesner RJ. Adaptation of mitochondrial gene expression to changing cellular energy demands. News Physiol Sci 1997;12:178–184 [Google Scholar]
- 23.Wredenberg A, Wibom R, Wilhelmsson H, et al. Increased mitochondrial mass in mitochondrial myopathy mice. Proc Natl Acad Sci USA 2002;99:15066–15071 [DOI] [PMC free article] [PubMed] [Google Scholar]
- 24.Wiesner RJ, Hornung TV, Garman JD, Clayton DA, O'Gorman E, Wallimann T. Stimulation of mitochondrial gene expression and proliferation of mitochondria following impairment of cellular energy transfer by inhibition of the phosphocreatine circuit in rat hearts. J Bioenerg Biomembr 1999;31:559–567 [DOI] [PubMed] [Google Scholar]
- 25.Rollins S, Prayson RA, McMahon JT, Cohen BH. Diagnostic yield of muscle biopsy in patients with clinical evidence of mitochondrial cytopathy. Am J Clin Pathol 2001;116:326–330 [DOI] [PubMed] [Google Scholar]
- 26.DiMauro S, Bonilla E, Zeviani M, et al. Mitochondrial myopathies. Ann Neurol 1985;17:521–538 [DOI] [PubMed] [Google Scholar]
- 27.De Vivo DC, DiMauro S. Mitochondrial defects in brain and muscle. Biol Neonate 1990;58(suppl 1):54–69 [DOI] [PubMed] [Google Scholar]
- 28.Johnson HA, Amendola F. Mitochondrial proliferation in compensatory growth of the kidney. Am J Pathol 1969;54:35–45 [PMC free article] [PubMed] [Google Scholar]
- 29.Goffart S, von Kleist-Retzow JC, Wiesner RJ. Regulation of mitochondrial proliferation in the heart: power-plant failure contributes to cardiac failure in hypertrophy. Cardiovasc Res 2004;64:198–207 [DOI] [PubMed] [Google Scholar]
- 30.Sebastiani M, Giordano C, Nediani C, et al. Induction of mitochondrial biogenesis is a maladaptive mechanism in mitochondrial cardiomyopathies. J Am Coll Cardiol 2007;50:1362–1369 [DOI] [PubMed] [Google Scholar]
- 31.Irrcher I, Adhihetty PJ, Joseph AM, Ljubicic V, Hood DA Regulation of mitochondrial biogenesis in muscle by endurance exercise. Sports Med 2003;33:783–793 [DOI] [PubMed] [Google Scholar]
- 32.Zong H, Ren JM, Young LH, et al. AMP kinase is required for mitochondrial biogenesis in skeletal muscle in response to chronic energy deprivation. Proc Natl Acad Sci USA 2002;99:15983–15987 [DOI] [PMC free article] [PubMed] [Google Scholar]
- 33.Tokunaga M, Mita S, Sakuta R, Nonaka I, Araki S. Increased mitochondrial DNA in blood vessels and ragged-red fibers in mitochondrial myopathy, encephalopathy, lactic acidosis, and stroke-like episodes (MELAS). Ann Neurol 1993;33:275–280 [DOI] [PubMed] [Google Scholar]
- 34.Heddi A, Stepien G, Benke PJ, Wallace DC. Coordinate induction of energy gene expression in tissues of mitochondrial disease patients. J Biol Chem 1999;274:22968–22976 [DOI] [PubMed] [Google Scholar]
- 35.Shungu DC, Mao X, Johnson CE, et al. 1H MRSI detection of elevated total creatine in brain cancer: a cautionary tale. Proc Soc Magn Reson Med 2009;17:1008 [Google Scholar]
- 36.Toback FG, Smith PD, Lowenstein LM. Phospholipid metabolism in the initiation of renal compensatory growth after acute reduction of renal mass. J Clin Invest 1974;54:91–97 [DOI] [PMC free article] [PubMed] [Google Scholar]
- 37.Herminghaus S, Pilatus U, Möller-Hartmann W, et al. Increased choline levels coincide with enhanced proliferative activity of human neuroepithelial brain tumors. NMR Biomed 2002;15:385–392 [DOI] [PubMed] [Google Scholar]
- 38.Bianchi MC, Tosetti M, Battini R, et al. Proton MR spectroscopy of mitochondrial diseases: analysis of brain metabolic abnormalities and their possible diagnostic relevance. AJNR Am J Neuroradiol 2003;24:1958–1966 [PMC free article] [PubMed] [Google Scholar]
- 39.Takahashi S, Oki J, Miyamoto A, Okuno A. Proton magnetic resonance spectroscopy to study the metabolic changes in the brain of a patient with Leigh syndrome. Brain Dev 1999;21:200–204 [DOI] [PubMed] [Google Scholar]
- 40.Friedman SD, Shaw DW, Ishak G, Gropman AL, Saneto RP. The use of neuroimaging in the diagnosis of mitochondrial disease. Dev Disabil Res Rev 2010;16:129–135 [DOI] [PubMed] [Google Scholar]


