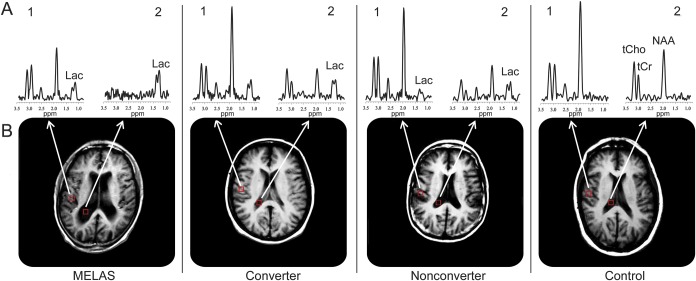
Figure 1. Representative spectra from 2 voxels of interest in the 4 diagnostic groups.
Representative spectra (A) of T1-weighted brain MRIs (B) for voxels (1) in the right parietal gray matter and (2) in the lateral ventricle of, left to right, a patient with mitochondrial encephalomyopathy, lactic acidosis, and stroke-like episodes (MELAS); a converter; a nonconverter; and a healthy control subject. To achieve a smooth representation and drawing of the ventricular region of interest, the magnetic resonance spectroscopic imaging (MRSI) data matrix was zero-filled to 64 × 64 points along the spatial domains, which effectively halved the voxel size without increasing or decreasing information content—current information is simply replicated in twice as many voxels. Spectral resonances identified are those for total choline-containing compounds (tCho at 3.24 ppm), total creatine (tCr at 3.03 ppm), N-acetyl-l-aspartate (NAA at 2.02 ppm), and lactate (Lac at 1.33 ppm). Note a clearly visible Lac peak in the spectra from all the carrier groups but not in the spectrum from the healthy control subject. All of the spectra are plotted using the same vertical-axis scale.

