

Abstract
T-type Ca2+ channels are known as important participants of nociception and their remodeling contributes to diabetes-induced alterations of pain sensation. In this work we have established that about 30% of rat nonpeptidergic thermal C-type nociceptive (NTCN) neurons of segments L4–L6 express a slow T-type Ca2+ current (T-current) while a fast T-current is expressed in the other 70% of these neurons. Streptozotocin-induced diabetes in young rats resulted in thermal hyperalgesia, hypoalgesia, or normalgesia 5-6 weeks after the induction. Our results show that NTCN neurons obtained from hyperalgesic animals do not express the slow T-current. Meanwhile, the fraction of neurons expressing the slow T-current did not significantly change in the hypo- and normalgesic diabetic groups. Moreover, the peak current density of fast T-current was significantly increased only in the neurons of hyperalgesic group. In contrast, the peak current density of slow T-current was significantly decreased in the hypo- and normalgesic groups. Experimental diabetes also resulted in a depolarizing shift of steady-state inactivation of fast T-current in the hyperalgesic group and slow T-current in the hypo- and normalgesic groups. We suggest that the observed changes may contribute to expression of different types of peripheral diabetic neuropathy occurring during the development of diabetes mellitus.
1. Introduction
Peripheral diabetic neuropathy (PDN), being one of the most frequent and troublesome complications of diabetes mellitus [1], is often accompanied with various pain syndromes [2–5]. Impairment of Ca2+ homeostasis [6–9] and remodeling of voltage- and ligand-gated ion channels [10–12] in nociceptive neurons under PDN have been implicated in altered nociception. Low voltage activated (LVA) T-type calcium channels (T-channels) [13], directly participating in cellular excitability as well as in intracellular calcium signaling, are crucially involved in both acute [14–19] and neuropathic pain [20–24]. It has been established that primary sensory neurons mainly express T-channels of the Cav3.2 subtype [17, 25, 26]. This subtype mediates a major part of LVA Ca2+ current (T-current) although other T-channel subtypes are also present in these neurons and may potentially contribute to the LVA current [17, 20, 25, 27]. Moreover, C-fiber nociceptors seem to be heterogeneous regarding amplitudes, pharmacology, and biophysical properties of T-current [28–30] and might be divided into two subclasses correspondingly expressing fast or slow T-current [28]. Despite these findings, a lot of studies proving the importance of T-channels for nociception do not distinguish between C-fiber nociceptors expressing fast and slow T-currents within populations of small and medium size nociceptive neurons. Differential remodeling of fast and slow T-currents in IB4-positive capsaicin-sensitive small-sized DRG neurons [31], which are considered nonpeptidergic thermal C-type nociceptors (NTCN) [32], is of particular interest because of the strong involvement of these neurons in thermal pain sensitivity [33] and neuropathic pain [34, 35]. Recently it has been shown that in rats with streptozotocin- (STZ-) induced diabetes, the classical model of diabetes type 1 [4, 5], remodeling of T-channels in the NTCN neurons, was PDN type specific with substantial differences in a case of the thermal hyperalgesia versus norm- or hypoalgesia [27].
Here we have used rats with thermal hyper-, hypo-, and normalgesia at the same age and duration of STZ-induced diabetes to determine PDN-type-specific remodeling of T-channels underlying fast and slow LVA Ca2+ currents in NTCN neurons.
2. Materials and Methods
2.1. Experimental Animals
All experimental protocols were approved by the Animal Care and Use Committee of the Bogomoletz Institute of Physiology (Kyiv, Ukraine) and were in accordance with the National Institutes of Health Guide for the Care and Use of Laboratory Animals. Every effort was made to minimize animal suffering and the number of animals used.
2.2. Induction of Experimental Diabetes
We used a well-established model of streptozotocin (STZ) injections to induce diabetic neuropathy in young male Wistar rats (30–50 g, 21–23 days old) [5, 27]. Experimental diabetes was induced in rats by a single i.p. injection of STZ solution (80 mg/kg, i.p.). Blood glucose levels were checked on the third day after injection (to verify diabetes onset) and just before electrophysiological experiments (6-7 weeks after injections), using a blood glucometer (Accu-Chek Active; Roche Diagnostics, Indianapolis, IN, USA). Rats with values of >270 mg/dL (15 mM) were considered hyperglycemic.
2.3. Assessment of Thermal Nociception (Behavioral Experiments)
Nociceptive responses to thermal stimulation were measured by the Hargreaves' method [27, 36] using a paw thermal stimulation system (Plantar Test, Ugo Basile, Italy) for the measurement of paw withdrawal latency (PWL). PWL was recorded for each tested rat as a mean of 10 measurements with 5 min interval alternating left and right hind paws.
2.4. Preparation of Dorsal Root Ganglia (DRG) Neurons
We prepared dissociated DRG cells and used them within 6–8 h for whole-cell recordings as described previously [27]. In brief, L4 and L5 DRGs were incubated in a Tyrode's solution containing 140 mM NaCl, 4 mM KCl, 2 mM MgCl2, 2 mM CaCl2, 10 mM glucose, and 10 mM HEPES, adjusted to pH 7.4 with NaOH and supplemented with 1 mg/mL protease Type XIV (Sigma) and 0.5 mg/mL collagenase Type I (Worthington Biochemical Corporation) for 18–20 min at 35°C. Following incubation, ganglia were rinsed and dissociated by trituration with glass pipettes. Isolated neurons were plated onto an uncoated glass coverslip. All following experiments were done at room temperature.
2.5. IB4 Labeling and Imaging
Cells were incubated in Tyrode's solution supplemented with 10 μg/mL isolectin B4 (IB4) conjugated to Alexa Fluor 568 dye (Invitrogen) in the dark for 10–12 min [27]. Cells were visualized using a standard Rhodamine Filter Set (Chroma Technology, USA) installed in TILL Photonics wide-field imaging system (TILL Photonics, Gräfelfing, Germany) based on an inverted microscope (IX71, Olympus) and containing a monochromator Polychrome V and Imago CCD camera both controlled by TILLvision software (TILL Photonics). Fluorescent images were captured via an oil immersion objective (40x UV, NA 1.35; Olympus) under standardized settings from 15 to 20 randomly selected small DRG cells on each dish before any electrophysiological recordings during the first 15 min of each experiment. The mean intensity of halo of IB4 staining around the neuronal plasma membrane was determined for each neuron. The relative intensity was calculated separately for neurons of each coverslip. The 0 and 100% intensity values for a particular coverslip were calculated by averaging the halo intensity of the two least intensely (0%) and two most intensely stained cell profiles (100%). Neurons were considered IB4 positive (IB4+) if their relative intensities exceeded 20%.
2.6. Electrophysiology
Electrophysiological recordings were performed using a standard whole-cell technique [27]. Electrodes were pulled from borosilicate glass microcapillaries with a filament (Sutter Instrument, Novato, CA) and had a resistance of 3 to 4 MΩ when filled with an internal solution containing (in mM) 146 CsCl, 2 MgATP, 2 MgCl2, 0.5 GTP-Na, 1 EGTA, 5 2Na-phosphocreatine, and 10 HEPES, adjusted to pH 7.3 with CsOH. The external solution for calcium currents recording contained (in mM) 2 CaCl2, 2 MgCl2, 158 tetraethylammonium- (TEA-) Cl, 10 glucose, and 10 HEPES adjusted to pH 7.4 with TEA-OH. Electrophysiological recordings were performed using an EPC-10/2 amplifier controlled by PatchMaster software (HEKA, Freiburg, Germany). FitMaster software (HEKA, Freiburg, Germany) was used for offline data analysis. Currents were low-pass filtered at 2–5 kHz. A T-type calcium current was evoked by step pulse to −45 mV for 500 ms after preconditioning at potential of −95 mV for 3 s. Bath application of Tyrode's solution supplemented with capsaicin (2 μM) was used to test capsaicin sensitivity at the end of experimental procedure. Multiple independently controlled glass syringes served as reservoirs for a gravity-driven local perfusion system. All drugs were prepared as stock solutions: capsaicin (10 mM) in DMSO, Ni2+ (100 mM), and mibefradil (5 mM) in H2O. Drugs were freshly diluted to the appropriate concentrations at the time of experiments. All chemicals were obtained from Sigma (St. Louis, MO) unless otherwise noted.
2.7. Analysis
Statistical comparisons were performed using unpaired Student's t-test, one-way ANOVA, and Fisher's exact test. All quantitative data are expressed as means of multiple experiments ± SEM. The amplitude of T-type current was measured as a difference between the current peak value and the current value at the end of a depolarizing command pulse in order to avoid a residual HVA current. Activation and inactivation kinetics were estimated for each recorded T-type current as time constants of two-exponential fit from 10% of amplitude at rising part to the end of an evoking step. Voltage dependencies of activation and steady-state inactivation were described in a standard way [27] using single Boltzmann distributions of the following forms:
| (1) |
where conductance (G(V)) was defined as PCD/(V − E r) (PCD is a peak current density defined as I peak/C m and (V − E r) is an electrodriving force for a membrane potential (V) and a reversal potential (E r) obtained from interpolation of I(V) dependence); G max is the maximal conductance and I max is the maximal peak current amplitude; V 1/2 is a voltage at which half of the current is activated or inactivated, and k represents the slope factor of voltage dependence. The fitted values for V 1/2 and k are reported with 95% linear confidence limits.
3. Results
3.1. Different Types of PDN Induced by STZ Diabetes
Three days after diabetic induction by an injection of STZ, most (70%) rats developed strong hyperglycemia (mean glucose concentration 29 ± 2 mM) and were considered diabetic. As reported previously [27], within 6-7 weeks after injection of STZ, hyper-, hypo-, and normalgesic types of PDN were present in the population of STZ diabetic rats that was determined based on changes in a paw withdrawal latency (PWL). The animals were considered as thermally hyperalgesic if their PWL was less than 8.9 s, hypoalgesic if it was longer than 15.5 s, and normalgesic in any other cases (unchanged response, PWL within 8.9 ÷ 15.5 s) [27]. Animals with thermal hyperalgesia (n = 12), normalgesia (n = 8), and hypoalgesia (n = 9) were selected from the population of rats with 6-7 weeks of STZ-induced diabetes. The averaged PWLs for hyper-, hypo-, and normalgesic groups were 7.7 ± 0.3 s, 17.4 ± 0.5 s, and 12.4 ± 0.7 s, correspondingly, while the averaged PWL in control was 12.0 ± 0.7 s (n = 10). In agreement with the previous study [27], the blood glucose level of diabetic animals was significantly different from that of the control rats. However, no significant differences in the blood glucose level and body weight were observed between experimental rats of different diabetic groups (data not shown).
Thus, simultaneous presence of hyper-, norm-, and hypoalgesic animals was confirmed within the population of rats with 6-7 weeks of STZ-induced diabetes. These three animal groups together with control animals were further used to analyze whether there were thermal C-fiber nociceptive neurons specifically expressing fast or slow T-currents and whether there are some changes in expression of these currents associated with the different types of PDN induced by type 1 diabetes.
3.2. NTCN Neurons Expressing Fast or Slow T-Type Ca2+ Currents
T-current was recorded in nonpeptidergic thermal C-type nociceptors (NTCN) [32] that are strongly involved in thermal pain sensitivity [33] and neuropathic pain [34, 35]. To separate these neurons from other types of small-size DRG neurons, a population of freshly isolated cells was stained with isolectin B4 (IB4) [37] for in vitro labeling of nonpeptidergic neurons [32]. IB4-positive small-size neurons (Figure 1(a) (A)) were held in a voltage clamp mode at −60 mV and challenged with TRPV1 channels agonist, capsaicin. Neurons which responded to capsaicin application (2 μM, 15 s) with an inward current (Figure 1(a) (B)) were considered as NTCN neurons.
Figure 1.

NTCN neurons express both fast and slow T-currents. (a) Identification of NTCN neurons. (A) A typical fluorescent image of an IB4-positive small-size DRG neuron. Note the intensive fluorescent ring associated with the neuronal plasma membrane. Scale bar, 20 μm. (B) A typical trace of transmembrane current induced by application of capsaicin (2 μM) in IB4-positive small-sized DRG neuron. IB4-positive capsaicin-sensitive small size DRG neurons were further considered as nonpeptidergic thermal C-type nociceptive (NTCN) neurons. (b) Representative current traces illustrate expression of T-currents with fast and slow kinetics of inactivation in different NTCN neurons. Currents were elicited using a 0.5 s voltage step to −45 mV after preconditioning at −95 mV for 3 s. A grey inset shows the same currents normalized by amplitude to underline a difference in kinetics of current inactivation. (c) A histogram demonstrates a pooled distribution of inactivation time constants of T-currents recorded from 85 neurons of control and PDN groups. The time constants were calculated from a single-exponential fit of current decay. A smooth curve is a fit of the distribution by a sum of two Gaussians. According to this fit T-currents were divided into fast (τ in < 50 ms; white bars) and slow (τ in > 50 ms; black bars) subtypes. (d) Kinetics of inactivation of fast and slow T-currents in control and PDN groups. Each column is the mean and SEM from the number of neurons specified in Figure 2(a). No significant difference compared to control was revealed under PDN conditions in kinetics of inactivation for both fast and slow T-currents. (e) Peak current density (PCD) of fast and slow T-currents under the control conditions. The columns are the mean and SEM calculated from 31 fast and 12 slow T-currents. ***P < 0.001. (f) PCD plotted versus inactivation time constant for fast and slow T-currents recorded under the control conditions. No significant correlations were found for both current types indicating that the difference in inactivation between fast and slow T-currents was not due to voltage clamp problems. Lines were liner fits of the dependencies; R 2 as a measure of correlation is shown in the plot.
T-current was recorded in these neurons using a voltage step to −45 mV after preconditioning at −95 mV. Its kinetics of inactivation (τ in) was calculated as a time constant of a single-exponential fit of decay. A strong variability of time constant values was observed within the population of neurons under study allowing suggesting that fast and slow T-current could be specifically expressed in different neurons (Figure 1(b)). A pooled distribution of τ in values was built for T-currents recorded in neurons taken from control (n = 43), hyper- (n = 15), hypo- (n = 14), and normalgesic (n = 14) animals (Figure 1(c)) to statistically test whether different T-currents were expressed in the NTCN neurons. The distribution of τ in values was strongly right-skewed. A Shapiro-Wilk normality test also indicated that it was not Gaussian (P < 2 · 10−6). At the same time, the distribution was reasonably fitted by two Gaussians (Figure 1(c)) suggesting the division the T-current into fast (τ in < 50 ms) and slow (τ in > 50 ms) subtypes. The average τ in of the slow T-current was almost three times larger than the one of the fast T-current (Figure 1(d); Table 1). Surprisingly, in the control group a peak current density (PCD) of the slow T-current was almost twice as large as the fast one (Figure 1(e); Table 1; P < 0.001). Since slower decay kinetics was observed in neurons having larger PCD, this slower decay could be due to a voltage clamp problem rather than due to a difference in T-type channel gating. If this were the case, positive correlation between the T-current amplitude and kinetics of inactivation should be observed within neuronal populations expressing both fast and slow T-currents. However, no significant correlation was found between PCD and τ in of fast and slow T-currents in the control group (Figure 1(f)), suggesting that the difference in τ in between fast and slow T-currents was not an artifact of poor voltage clamp. Moreover, there was no significant difference in macroscopic activation kinetics between fast and slow T-currents (Table 1) which also confirmed that it is a difference in T-type channel gating that underlies fast and slow kinetics of the T-current. Thus, two groups of neurons were identified among the whole population of NTCN neurons based on their difference in T-current inactivation. It is also interesting to note that capacitance of cells expressing the slow T-current was significantly smaller (about 30%) than those expressing the fast T-current (Table 1; P < 0.01). This also suggests that two different neuronal groups express different T-currents.
Table 1.
Parameters of fast and slow T-currents in NTCN neurons.
| Control | C, pF | T-current parameters at −45 mV | |||||||
|---|---|---|---|---|---|---|---|---|---|
|
Peak current density, pA/pF |
Time constant of activation, ms |
Time constant of inactivation, ms |
|||||||
| Fast | Slow | Fast | Slow | Fast | Slow | Fast | Slow | ||
| 18.8 ± 1.0 | 12.8 ± 1.5 | 2.8 ± 0.3 | 5.2 ± 0.5 | 6.6 ± 0.6 | 7.2 ± 0.8 | 26 ± 2 | 76 ± 5 | ||
| Diabetes | Hyperalgesia | 15.5 ± 1.4 | 4.4 ± 0.4 | 5.0 ± 0.9 | 27 ± 4 | ||||
| Hypoalgesia | 17.9 ± 1.0 | 17.7 ± 1.0 | 2.6 ± 0.4 | 2.0 ± 0.6 | 7.7 ± 1.6 | 6 ± 1 | 27 ± 3 | 66 ± 4 | |
| Normalgesia | 2.6 ± 2.2 | 13.3 ± 1.0 | 2.5 ± 0.5 | 1.9 ± 0.5 | 6.1 ± 0.7 | 3.2 ± 0.3 | 23 ± 2 | 66 ± 8 | |
3.3. Cav3.2 (α1H) Isoform of T-Type Channels Differently Contributes to Fast and Slow T-Type Ca2+ Currents Expressed in NTCN Neurons
Cav3.2 isoform of T-type channels is the most abundantly expressed in DRG neurons [26] and mediates the most part of T-current in NTCN neurons [27]. However, it has been reported recently that Cav3.3 can also perceptibly contribute to the T-current in a subpopulation of small DRG neurons resulting in slower inactivation of the T-current these neurons express [28]. In order to examine a functional contribution of Cav3.2 channels to the fast and slow T-currents in NTCN neurons of naive animals we used low micromolar concentrations of Ni2+ known to be a specific blocker of Cav3.2 isoform with no significant effect on Cav3.1 and Cav3.3 T-type channel subtypes [13, 38]. A specific T-type channel blocker mibefradil [13], which is not subunit specific, was additionally used to confirm that an electrophysiologically isolated LVA current is mediated by T-type channels.
As expected, Ni2+ at low micromolar concentration (50 μM) significantly and reversibly blocked both fast and slow T-currents (P < 0.001, Figure 2(a)). At the same time the fast T-current was significantly more sensitive to Ni2+ than the slow one (18 ± 3% (n = 6) compared to 28 ± 1% (n = 3) of initial current persisted for the fast and slow T-currents, resp.) (P < 0.02, Figure 2(c)). This finding points to a significantly larger contribution of Cav3.2 isoform to the fast than to the slow T-current. There was no significant difference in kinetics of inactivation between Ni2+-sensitive (27 ± 2 ms) and Ni2+-insensitive (30 ± 2 ms) components of fast T-current as well as the fast T-current itself (26 ± 2 ms; ANOVA, P = 0.6; insets in Figures 2(a) and 2(b)). It is interesting to note that kinetics of inactivation of Ni2+-sensitive component of slow T-current (32 ± 2 ms) was not significantly different from those of Ni2+-sensitive component of fast T-current and the fast T-current itself (ANOVA, P > 0.3; Figures 2(b) and 2(e)), suggesting that this component is also mediated by Cav3.2 isoform. In contrast, kinetics of inactivation of Ni2+-insensitive component of slow T-current (Figure 2(a), right inset) was 1.78 ± 0.03-fold slower than one of the total slow T-current. This ratio was significantly different compared to the respective ratio calculated for the fast T-current (1.15 ± 0.10; P < 0.01; Figure 2(d)). In addition, for the slow T-current, Ni2+-insensitive component was substantially and significantly slower (2.69 ± 0.12 times) than the Ni2+-sensitive one (P < 0.001; Figure 2(b), right inset), suggesting that these components are mediated by different T-channel isoforms. Altogether these results confirm our earlier suggestion about a significantly larger contribution of Cav3.2 isoform to the fast than to the slow T-current. Finally, mibefradil (10 μM) blocked 93 ± 3% and 93 ± 1% of fast and slow T-currents, respectively. The effect was significant (P < 0.001) with no significant difference between the fast and slow T-currents (P = 0.95), thus providing additional pharmacological confirmation that recorded fast and slow currents were mediated by T-channels.
Figure 2.
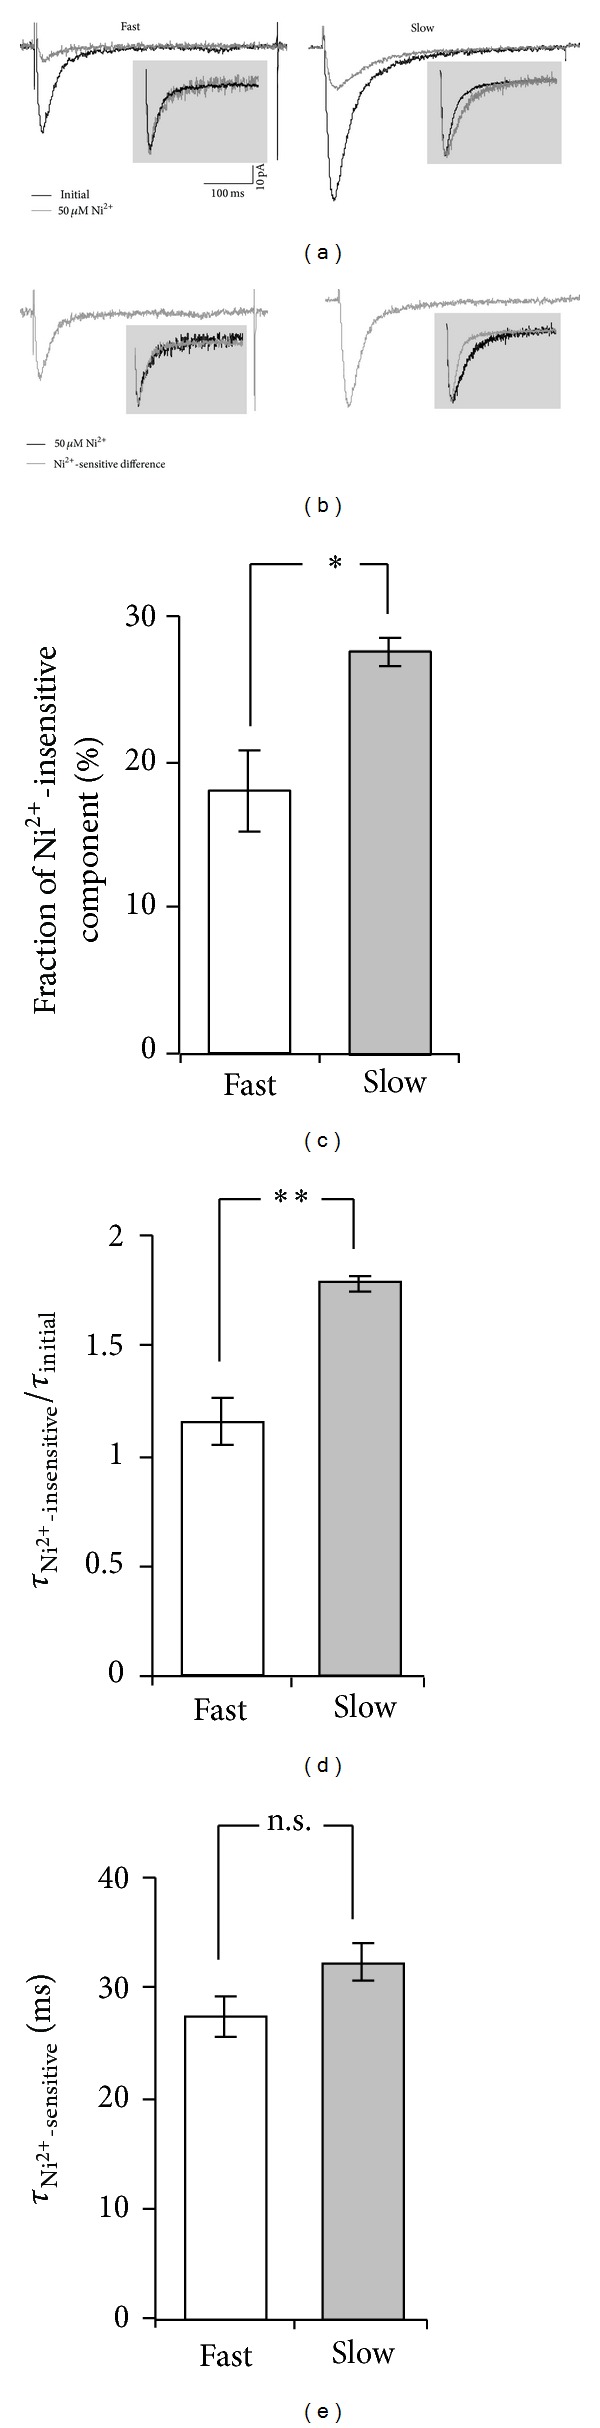
Fast and slow T-currents expressed by NTCN neurons reveal different sensitivity to low Ni2+ concentration. (a) Representative current traces illustrate effect of Ni2+ application to NTCN neurons of naive rats expressing fast (left) and slow (right) T-currents. Initial (total) T-current traces are shown in black while grey traces represent a residual Ni2+-insensitive component of T-current persisted during Ni2+ application. Note the considerably larger blocking effect of Ni2+ application on the fast compared to slow T-currents. Insets show the total and Ni2+-insensitive currents normalized by their amplitudes in order to directly compare their inactivation kinetics further shown in (c). Note the slower inactivation of Ni2+-insensitive component compared to the total current for the case of slow T-current. Scale bars shown in (a) are applicable to all current traces in (a) and (b). (b) Representative traces for a Ni2+-sensitive component of fast (left) and slow (right) T-currents were obtained by digital subtraction of the Ni2+-insensitive component from the total T-current for traces shown in (a). Insets demonstrate normalized Ni2+-sensitive (gray) and Ni2+-insensitive (black) components. Note the absence of visible difference in kinetics of inactivation between these components of the fast T-current and a substantially slower Ni2+-insensitive component as compared to the Ni2+-sensitive one for the case of slow T-current. (c) Fractions of Ni2+-insensitive component in the fast and slow T-currents were significantly different. *-P < 0.05. (d) A ratio of inactivation kinetics of Ni2+-insensitive component and the total T-current for NTCN neurons expressing the fast and slow T-currents. There were no significant changes observed in the case of fast T-current (P > 0.4), while the inactivation kinetics of Ni2+-insensitive component of slow T-current was significantly slower compared to the inactivation kinetics of the total current. **-P < 0.01. (e) Inactivation kinetics of Ni2+-sensitive components of fast and slow T-currents. n.s.: no significant difference was revealed between the inactivation kinetics of Ni2+-sensitive components of the fast and slow T-currents (P > 0.3). Each column in (c), (d), and (e) is the mean and SEM from 6 fast and 3 slow T-currents.
Taken together these findings demonstrate significantly different pharmacological properties of T-channels mediating the fast and slow T-currents in NTCN neurons. While the major part of both the fast and slow T-currents seems to be mediated by Cav3.2 T-type channel isoform, a considerable contribution of the other T-channel isoforms was established for the case of slow T-current.
3.4. PDN-Specific Functional Expression of Fast and Slow T-Currents in NTCN Neurons
In the next phase of our research, we determined whether the NTCN neurons with the slow T-current were present under diabetic conditions and whether their percentage was differentially changed in animals with different types of PDN. We demonstrated that NTCN neurons of hypo- and normalgesic animals expressed either slow or fast T-currents, as was observed in control conditions (Figure 3(a)). The slow T-current was found in about 30% of the neurons in each of these diabetic groups with no significant differences in their fraction between both these groups and control (P > 0.05, Fisher's exact test). This suggests that the distribution of slow and fast T-currents among NTCN neurons was not affected in hypo- and normalgesic PDN. In contrast, the NTCN neurons of hyperalgesic rats only expressed the fast T-current (15 of 15 tested cells; Figure 3(a)). The percentage of NTCN neurons expressing the slow T-current differed significantly between hyperalgesic and control groups (P < 0.05, Fisher's exact test), suggesting specific abolishment of the slow T-current or elimination of the respective NTCN neurons under hyperalgesic PDN. Under diabetic conditions we did not observe a difference in capacitance between NTCN neurons expressing the slow and fast T-currents in the hypoalgesic group. However, a significant difference in capacitance was preserved in normalgesic group (Table 1; P < 0.01) as was initially established for the neurons of the control group.
Figure 3.
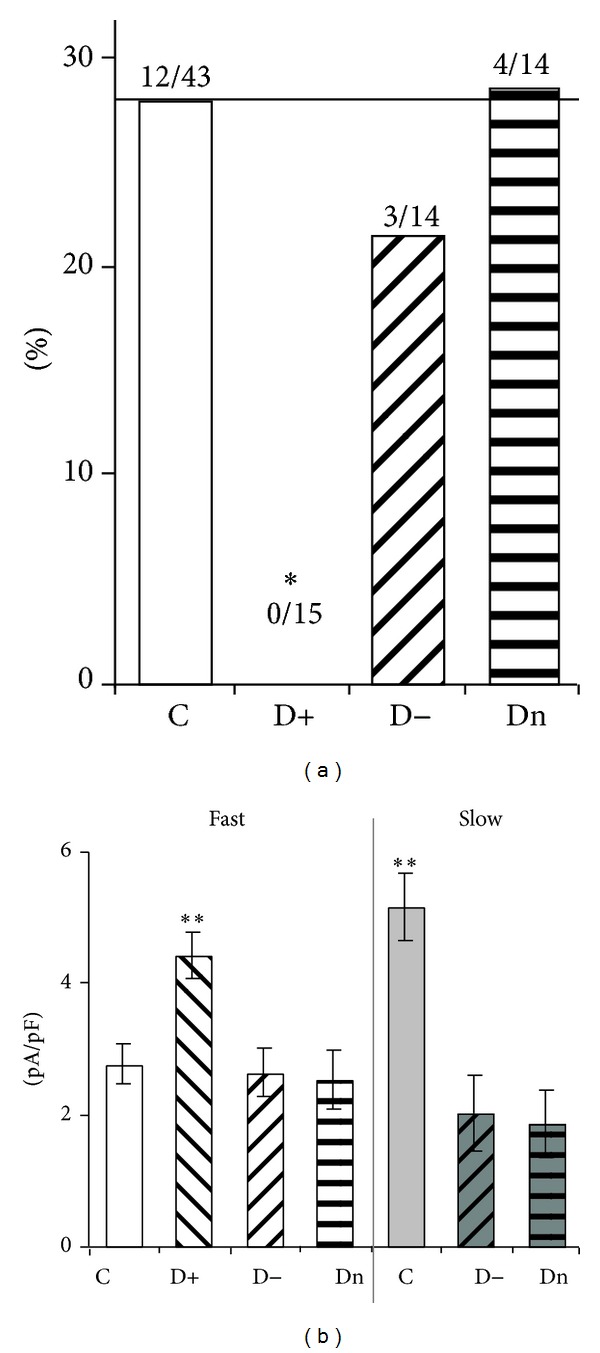
Functional expression of fast and slow T-currents in NTCN neurons under different PDN conditions. (a) Percentage of NTCN neurons revealing the slow T-current in control (C), hyper- (D+), hypo- (D−), and normalgesic (Dn) groups. The slow T-current was not observed under hyperalgesic conditions, *P < 0.05 (Fisher's exact test). The numbers above the columns indicate the number of NTCN neurons expressing the slow T-current of the total number of tested neurons in the respective group. (b) PCD of fast and slow T-currents under the control and PDN conditions. It is interesting to note that the fast T-current was upregulated in hyperalgesic conditions while the slow T-current was strongly downregulated in norm- and hypoalgesia. Each column was the mean and SEM from number of neurons specified in (a). **P < 0.01 (ANOVA). n.s.: not significant (ANOVA).
In addition, we analyzed possible effects of differential diabetes development under different PDN on functional expression of fast and slow T-currents. We calculated the PCD of fast and slow T-currents and compared these pairwise between control, hyper-, hypo-, and normalgesic animal groups. It was found that PCD of fast T-current was substantially and significantly increased only in the hyperalgesic group (by 60 ± 20%) compared with the control group, while no significant changes were observed in hypo- and normalgesic diabetic groups (Figure 3(b); Table 1). At the same time, the slow T-current, absent in the NTCN neurons under hyperalgesia, was significantly decreased in the hypo- (by 61 ± 12%) and normalgesic (by 64 ± 10%) groups compared with the control group (Figure 3(b); Table 1). It is interesting to note that the PCD of slow and fast T-currents, which were significantly different in the control group, did not differ in the neurons of hypo- and normalgesic diabetic groups (Figure 3(b); Table 1) indicating an increased relative contribution of the fast T-current in neuronal Ca2+ signaling.
3.5. PDN Alters Biophysical Properties of Fast and Slow T-Currents in NTCN Neurons
Changes in biophysical properties of T-channels may substantially influence the neuronal excitability [39]. Moreover, changes in voltage-dependent activation and steady-state inactivation (SSI) of T-channels have been recently reported for different types of PDN [27]. Therefore, the biophysical properties of fast and slow T-currents were also examined in NTCN neurons under different types of PDN (Table 2). We found that the voltage-dependent activation and SSI of fast and slow T-currents were not significantly different in control conditions (ANOVA, P > 0.2) (Table 2). We also determined that macroscopic activation and inactivation kinetics of the fast T-current were not significantly different between NTCN neurons of control, hyper-, hypo-, and normalgesic groups (Table 2; ANOVA, P > 0.3). Analogous results were obtained for the slow T-current recorded in control, hypo-, and normalgesic groups of rats (Table 2; ANOVA, P > 0.05). Our results suggest that activation and inactivation kinetics of fast and slow T-currents were not significantly affected under different types of PDN compared to control. No significant differences were also found in the half-activation potentials and slope factors of T-current activation and inactivation between any of the groups (control and all PDN) and in the current type (fast or slow) T-currents (Table 2; ANOVA, P > 0.5). At the same time, the voltage-dependence of SSI revealed a significant depolarizing shift (about 8 mV) in the half-inactivation potential of the fast T-current under hyperalgesia and of the slow T-current under hypo- and normalgesia (Figure 4) (ANOVA, P < 0.02), compared with the control group, Thus, activation properties of T-type channels seemed to be unaffected under PDN conditions. In contrast, SSI of slow and fast T-type currents was found to be specifically shifted in a similar way in NTCN neurons expressing slow T-current under hypo- and normalgesic PDN and fast T-current under hyperalgesic PDN.
Table 2.
Parameters of T-current activation and steady-state inactivation.
| Control | Steady-state inactivation | Activation | |||||||
|---|---|---|---|---|---|---|---|---|---|
| V 1/2, mV | k, mV | V 1/2, mV | k, mV | ||||||
| Fast | Slow | Fast | Slow | Fast | Slow | Fast | Slow | ||
| −90 ± 2 | −88 ± 4 | 5.9 ± 0.6 | 5.7 ± 0.7 | −49.3 ± 1.3 | −46 ± 2 | 5.1 ± 0.7 | 5.7 ± 1.2 | ||
| Diabetes | Hyperalgesia | −81.3 ± 1.7 | 6.0 ± 0.2 | −48.9 ± 1.6 | 5.2 ± 0.3 | ||||
| Hypoalgesia | −96 ± 4 | −82 ± 2 | 4.3 ± 1.6 | 5.3 ± 0.5 | −50 ± 4 | −49.9 ± 1.7 | 7 ± 3 | 4.1 ± 0.8 | |
| Normalgesia | −85 ± 2 | −80.1 ± 1.0 | 5.6 ± 0.4 | 6.4 ± 0.2 | −51.7 ± 1.4 | −49 ± 2 | 6.3 ± 0.9 | 5.9 ± 0.8 | |
Figure 4.

PDN-specific changes in steady-state inactivation of T-currents in NTCN neurons. Each column demonstrates the mean and SEM of half-inactivation potential of steady-state inactivation (SSI) calculated for 13 “fast” and 7 “slow” neurons of control group (C), 7 neurons of hyperalgesic group (D+), 5 “fast” and 3 “slow” neurons of hypoalgesic group (D−), and 8 “fast” and 4 “slow” neurons of normalgesic group (Dn). The results demonstrate that a depolarization shift in SSI was observed for the fast T-current in a case of hyperalgesia and for the slow T-current in norm- and hypoalgesia. ANOVA between all columns produced P < 0.02. ***P < 0.001 (t-test for merged “C, fast,” “C, slow,” and “D−, fast,” “Dn, fast” versus merged “D+, fast,” “D−, slow,” and “Dn, slow”). n.s.: not significant (ANOVA).
Accordingly, we have found that two different subtypes of T-type currents distinguished by their inactivation were specifically altered under hyper-, hypo-, and normalgesic STZ-diabetic neuropathy with a prominent difference between patterns of changes observed in hyperalgesia versus hypo- and normalgesia.
4. Discussion
Recently it has been demonstrated that differences in thermal pain sensitivity between hyperalgesic, hypoalgesic, and normalgesic diabetic rats are likely due to differential changes in the functioning of TRPV1 and T-channels within a pool of NTCN neurons [27], a subclass of nonpeptidergic primary nociceptors terminating in lamina II and playing an important role in neuropathic pain [32]. In this study, functioning of T-channels in NTCN neurons was further investigated using the same experimental model of STZ-induced diabetic neuropathy. To our knowledge, this is the first study demonstrating that T-channels underlying fast and slow LVA Ca2+ currents are heterogeneously expressed in NTCN neurons and are specifically modulated under thermal hyper-, hypo-, and normalgesia accompanying STZ diabetes. Our results provide better understanding of potential molecular mechanisms involved in the expression of different types of PDN.
As in humans, development of PDN in rats is accompanied with various alterations in pain sensation (hyper- and, hypoalgesia, and allodynia) or leaves pain sensation unchanged (normalgesia) [2–5]. These alterations can be considered as a manifestation of different types of PDN [27]. In the current study, STZ-diabetic rats revealing different modalities of thermal nociception and simultaneously having the same age and terms of diabetes development were used as a model for the investigation of PDN-type-specific remodeling of T-type Ca2+ channels involved in nociception. No difference was observed in blood glucose levels and weight between rats with different modalities of thermal nociception, which suggests that the PDN-type-specific remodeling of T-type Ca2+ channels found in this work is unlikely due to a different metabolic state of the experimental animals and is probably directly related to a particular type of PDN.
4.1. NTCN Neurons Expressing Fast and Slow T-Currents
Small DRG neurons differ in the biophysical properties of expressed T-currents. About 65% of small DRG neurons express a fast inactivating T-current having biophysical and pharmacological properties resembling those of a current mediated by the T-channels of Cav3.2 subtype [28, 30]. At the same time the other 35% of the neurons express a slowly inactivating T-current consisting of two pharmacologically separable components. This has been attributed to a different Cav3 subunits composition expressed by these neurons [28]. Therefore, a heterogeneous population of small DRG neurons can be divided into two classes [28] that can be in particular distinguished by a rate of T-current inactivation. Differences in sensitivity to capsaicin and mechanical stimulation between these two classes of small DRG neurons [28] allowed assuming that these neurons might also be functionally different. According to our results, NTCN neurons may be also divided into two classes characterized by the expression of either a fast or slow T-current, correspondingly. The fraction of “slow” neurons (~30%) observed in our experiments is also close to the reported one for the whole population of small DRG neurons [28]. The “slow” neurons were slightly (~30%) but significantly smaller and exhibited significantly lager (~2-fold) T-currents than “fast” ones, which is also in good agreement with previous findings [28].
4.2. T-Type Ca2+ Channels Mediating Fast and Slow T-Currents
A difference in kinetics of inactivation between the fast and slow T-currents observed in this research could arise from differential expression of various isoforms of T-type channels. Indeed, two isoforms of T-type channels, Cav3.2 and Cav3.3, have found to be expressed in DRG neurons [26, 40]. Cav3.2 is the most abundant isoform [26] both within the soma and peripheral axons of small and medium DRG neurons [41] and it mainly underlies the T-type current in small [20] (including NTCN [27]) and medium [25] DRG neurons, classically considered as nociceptive. Coste et al. have recently suggested that a proportion of small DRG neurons functionally express the Cav3.3 isoform [28]. The T-currents mediated by the Cav3.2 channels are known to have fast inactivation (τ inact ~ 20 ms) while the Cav3.3-mediated current exhibits substantially slower kinetics of inactivation (τ inact ~ 70 ms) [13, 38]. These data are in a good agreement with our results in respect of inactivation time constants of fast and slow T-currents and suggest that the fast T-current might be mediated by Cav3.2 channels, whereas Cav3.3 channels may contribute to the slow T-current.
Previous findings indicate that blockers of Cav3.2 channels substantially suppress T-currents in the whole population of small DRG neurons, including the NTCN ones [20, 27]. In this study Ni2+ at a low micromolar concentration also significantly blocked both fast and slow T-currents (Figure 2(a)), suggesting high contribution of Cav3.2 to both of them. At the same time the fast T-current was found to be significantly more sensitive to Ni2+ than the slow one (Figure 2(c)). Together with the slower kinetics of inactivation of Ni2+-insensitive compared to Ni2+-sensitive component of the slow T-current (Figure 2(b), right inset) this finding additionally confirms a contribution of Cav3.3 channel isoform to the slow T-current.
It was found in this study that 82% of fast T-current was blocked by 50 μM of Ni2+. This value is close to 81% calculated for Ni2+-induced block of Cav3.2-mediated current based upon IC50 = 10.3 μM and n = 0.9 reported in [25]. It allows us to assume that the fast T-current is solely mediated by Cav3.2 channel isoform (including 18% of the residual current observed in the presence of 50 μM of Ni2+). This assumption is strongly supported by the fact that the kinetics of inactivation of the fast T-current itself as well as its Ni2+-sensitive and Ni2+-insensitive components seems to be the same (insets in Figures 2(a) and 2(b)). If the same extent of Ni2+-induced block of Cav3.2-mediated current is present in the slow T-current then one can estimate from Figure 2(c) that Cav3.3 channel isoform contributes about 12% to an amplitude of the slow T-current. This value is close to 15% observed by Coste et al. for Cav3.3-mediated current in a proportion of small DRG neurons [28]. It is interesting to note that, despite a relatively low contribution to the amplitude, Cav3.3 isoform accounts for about 30% of charge transferred by the slow current since kinetics of inactivation of Cav3.3-mediated current is at least 2.69 times slower (Figure 2(b)). Thus, it seems very likely that coexpression of Cav3.2 and Cav3.3 isoforms of T-channels underlies the slow T-current in a subpopulation of NTCN neurons. At the same time, according to our and others' results [28], the NTCN neurons may hardly express the Cav3.3 channel isoform alone.
A difference in kinetics of inactivation between the fast and slow T-currents could be also explained by expression of Cav3.2 splice variants having slower inactivation kinetics. It might be a promising hypothesis since a high contribution of Cav3.2 to both fast and slow T-currents is found in this study (Figures 2(a) and 2(c)). However, the expected difference in inactivation kinetics between the Cav3.2 splice variants [42] is less than found between fast and slow T-currents in this work and, therefore, could not completely account for the experimental observations. At the same time, expression of splice variants may partially contribute to the variations of kinetics observed within the fast and slow types of T-currents.
Thus, expression of various T-type channel isoforms possibly in concert with their different splice variants may account for the difference in inactivation kinetics between the fast and slow T-currents found in this work. Most probably, a population of NTCN neurons consists of two different classes. One of them solely expresses Cav3.2 channels mediating the fast T-current while the other one expresses a mixture of Cav3.2 and Cav3.3 isoforms thus far producing the slow T-current.
4.3. Fast and Slow T-Currents in NTCN Neurons under Different Types of PDN
Differences in functioning of T-channels in NTCN neurons have been recently proposed as an important factor resulting in different modalities of thermal nociception under STZ-induced diabetic neuropathy [27]. The importance of Cav3.2 channels in peripheral nociceptive signaling was established previously, including a key role of their upregulation in hyperalgesia under STZ diabetes and chronic constrictive injury [16–25, 43–48]. Although changes in Cav3.3 functional expression have not been documented under PDN, upregulation of Cav3.3 was recently implicated in the sensitization of small DRG neurons, which possibly underlies hyperalgesia in the model of spinal nerve injury [40].
Absence of “slow” NTCN neurons, most probably expressing both Cav3.2 and Cav3.3 channels, under hyperalgesic PDN seems to be the very interesting finding of this work. It is hardly related to diabetes-induced death of these neurons since, to the best of our knowledge, no substantial damage of small DRG neurons has been reported at 6-7 weeks of STZ-induced diabetes. At the same time, diabetes-induced upregulation of Cav3.2 channels simultaneously with downregulation of Cav3.3 channels may substantially accelerate inactivation of the total T-current. In this case, NTCN neurons still expressing a mixed set of Cav3 channels could be classified as “fast.” This seems to be a quite realistic scenario since significant upregulation of the Cav3.2 channels is a common feature of hyperalgesic PDN [20, 25, 27, 45]. Our findings of a significant increase of T-current in “fast” (presumably Cav3.2 expressing) NTCN neurons under hyperalgesic conditions and a significant decrease of T-current in “slow” NTCN neurons under norm- and hypoalgesic conditions also support this explanation. Cav3.3 downregulation could be, in general, a common feature of all types of PDN observed in this study. This is supported by our findings of the absence of slow T-current in hyperalgesic animals and its significant decrease in hypo- and normalgesic rats. It is interesting to note that unchanged kinetics of slow T-current inactivation together with its decrease in hypo- and normalgesic rats suggests downregulation of both Cav3.3 and Cav3.2 channels in the neurons expressing the slow T-current without changes in a ratio between Cav3.2 and Cav3.3 channels. At the same time, no significant changes in the T-current were observed in “fast” NTCN neurons of hypo- and normalgesic rats, suggesting different sensitivity of T-channel modulation in “fast” and “slow” NTCN neurons during the progress of STZ diabetes.
Another interesting finding of the current study is a depolarizing shift in voltage dependence of inactivation under STZ-induced diabetes. A similar shift in a half-inactivation potential was also reported in our previous study [27]. The novel finding of the current study is that the shift was observed only in the “fast” NTCN neurons of hyperalgesic rats and “slow” NTCN neurons of hypo- and normalgesic rats. The shift may contribute to an increase in neuronal excitability [39] of NTCN neurons possibly underlying thermal hyperalgesia under STZ diabetes [27].
Functional expression of different Cav3 channels may influence Ca2+ signaling associated with different neuronal activities due to specific biophysical properties of these channels. Cav3.2 channels were shown to be underlying after depolarization potentials and participating in rebound discharge in medium [25] and T-rich [49] DRG neurons. However, relatively fast inactivation and slow recovery from inactivation limit the ability of Cav3.2 channels to respond to high frequency stimulation (>20 Hz). The role of Cav3.3 channels was not profoundly studied in peripheral sensory neurons. At the same time it was shown that slowly inactivating Cav3.3 channels can still contribute to Ca2+ entry during high frequency bursts (100 Hz) and slow, prolonged, or repetitive stimulations [50, 51] when Cav3.2 channels already became inactive. It seems reasonable to assume that, in “slow” NTCN neurons, Cav3.3 channels play similar role, being a sensor of high frequency bursting and slow, prolonged, or repetitive nociceptive input, thus mediating Ca2+ entry in response to such activities. Taken together, these considerations allow us to suggest the following functional consequences of observed changes in T-channels functioning. An almost 2-fold increase in T-channel PCD together with the shift of its half-inactivation potential in the NTCN neurons of hyperalgesic animals may result in a considerable functional upregulation of Cav3.2 channels, especially at the resting membrane potential [27]. As a consequence, Ca2+ entry in response to each action potential and a probability of rebound discharges are increased, thus far sensitizing the NTCN neurons and contributing to the thermal hyperalgesia. In contrast, decreased functional expression of both Cav3.2 and Cav3.3 channels in the “slow” NTCN neurons of hypo- and normalgesic animals reduces neuronal excitability and Ca2+ entry contributing to the diminished pain sensation.
5. Conclusions
Our results demonstrate that diabetes-induced alterations in functioning of T-channels are different in the NTCN neurons expressing fast and slow T-currents and are specifically associated with different types of PDN that may underlie the variety of pain syndromes induced by type 1 diabetes.
Acknowledgments
This work was supported by NASU Biotechnology and Functional Genomics and Metabolomics Grants and DFFD F46.2/001 and F47/066 Grants.
Conflict of Interests
The authors declare that there is no conflict of interests regarding the publication of this paper.
References
- 1.Gooch C, Podwall D. The diabetic neuropathies. Neurologist. 2004;10(6):311–322. doi: 10.1097/01.nrl.0000144733.61110.25. [DOI] [PubMed] [Google Scholar]
- 2.Calcutt NA, Freshwater JD, Mizisin AP. Prevention of sensory disorders in diabetic Sprague-Dawley rats by aldose reductase inhibition or treatment with ciliary neurotrophic factor. Diabetologia. 2004;47(4):718–724. doi: 10.1007/s00125-004-1354-2. [DOI] [PubMed] [Google Scholar]
- 3.Beiswenger KK, Calcutt NA, Mizisin AP. Dissociation of thermal hypoalgesia and epidermal denervation in streptozotocin-diabetic mice. Neuroscience Letters. 2008;442(3):267–272. doi: 10.1016/j.neulet.2008.06.079. [DOI] [PMC free article] [PubMed] [Google Scholar]
- 4.Obrosova IG. Diabetic painful and insensate neuropathy: pathogenesis and potential treatments. Neurotherapeutics. 2009;6(4):638–647. doi: 10.1016/j.nurt.2009.07.004. [DOI] [PMC free article] [PubMed] [Google Scholar]
- 5.Dobretsov M, Backonja MM, Romanovsky D, Stimers JR. Animal models of diabetic neuropathic pain. Neuromethods. 2011;49:147–169. [Google Scholar]
- 6.Huang T-J, Sayers NM, Fernyhough P, Verkhratsky A. Diabetes-induced alterations in calcium homeostasis in sensory neurones of streptozotocin-diabetic rats are restricted to lumbar ganglia and are prevented by neurotrophin-3. Diabetologia. 2002;45(4):560–570. doi: 10.1007/s00125-002-0785-x. [DOI] [PubMed] [Google Scholar]
- 7.Kostyuk E, Voitenko N, Kruglikov I, et al. Diabetes-induced changes in calcium homeostasis and the effects of calcium channel blockers in rat and mice nociceptive neurons. Diabetologia. 2001;44(10):1302–1309. doi: 10.1007/s001250100642. [DOI] [PubMed] [Google Scholar]
- 8.Kruglikov I, Gryshchenko O, Shutov L, Kostyuk E, Kostyuk P, Voitenko N. Diabetes-induced abnormalities in ER calcium mobilization in primary and secondary nociceptive neurons. Pflugers Archiv European Journal of Physiology. 2004;448(4):395–401. doi: 10.1007/s00424-004-1263-8. [DOI] [PubMed] [Google Scholar]
- 9.Shutov L, Kruglikov I, Gryshchenko O, et al. The effect of nimodipine on calcium homeostasis and pain sensitivity in diabetic rats. Cellular and Molecular Neurobiology. 2006;26(7-8):1541–1557. doi: 10.1007/s10571-006-9107-z. [DOI] [PMC free article] [PubMed] [Google Scholar]
- 10.Campbell JN, Meyer RA. Mechanisms of neuropathic pain. Neuron. 2006;52(1):77–92. doi: 10.1016/j.neuron.2006.09.021. [DOI] [PMC free article] [PubMed] [Google Scholar]
- 11.Veves A, Backonja M, Malik RA. Painful diabetic neuropathy: epidemiology, natural history, early diagnosis, and treatment options. Pain Medicine. 2008;9(6):660–674. doi: 10.1111/j.1526-4637.2007.00347.x. [DOI] [PubMed] [Google Scholar]
- 12.Basbaum AI, Bautista DM, Scherrer G, Julius D. Cellular and molecular mechanisms of pain. Cell. 2009;139(2):267–284. doi: 10.1016/j.cell.2009.09.028. [DOI] [PMC free article] [PubMed] [Google Scholar]
- 13.Perez-Reyes E. Molecular physiology of low-voltage-activated T-type calcium channels. Physiological Reviews. 2003;83(1):117–161. doi: 10.1152/physrev.00018.2002. [DOI] [PubMed] [Google Scholar]
- 14.Pathirathna S, Brimelow BC, Jagodic MM, et al. New evidence that both T-type calcium channels and GABAA channels are responsible for the potent peripheral analgesic effects of 5α-reduced neuroactive steroids. Pain. 2005;114(3):429–443. doi: 10.1016/j.pain.2005.01.009. [DOI] [PubMed] [Google Scholar]
- 15.Todorovic SM, Jevtovic-Todorovic V, Meyenburg A, et al. Redox modulation of T-Type calcium channels in rat peripheral nociceptors. Neuron. 2001;31(1):75–85. doi: 10.1016/s0896-6273(01)00338-5. [DOI] [PubMed] [Google Scholar]
- 16.Todorovic SM, Meyenburg A, Jevtovic-Todorovic V. Mechanical and thermal antinociception in rats following systemic administration of mibefradil, a T-type calcium channel blocker. Brain Research. 2002;951(2):336–340. doi: 10.1016/s0006-8993(02)03350-4. [DOI] [PubMed] [Google Scholar]
- 17.Bourinet E, Alloui A, Monteil A, et al. Silencing of the Cav3.2 T-type calcium channel gene in sensory neurons demonstrates its major role in nociception. The EMBO Journal. 2005;24(2):315–324. doi: 10.1038/sj.emboj.7600515. [DOI] [PMC free article] [PubMed] [Google Scholar]
- 18.Choi S, Na HS, Kim J, et al. Attenuated pain responses in mice lacking CaV3.2 T-type channels. Genes, Brain and Behavior. 2007;6(5):425–431. doi: 10.1111/j.1601-183X.2006.00268.x. [DOI] [PubMed] [Google Scholar]
- 19.Todorovic SM, Jevtovic-Todorovic V. T-type voltage-gated calcium channels as targets for the development of novel pain therapies. British Journal of Pharmacology. 2011;163(3):484–495. doi: 10.1111/j.1476-5381.2011.01256.x. [DOI] [PMC free article] [PubMed] [Google Scholar]
- 20.Messinger RB, Naik AK, Jagodic MM, et al. In vivo silencing of the CaV3.2 T-type calcium channels in sensory neurons alleviates hyperalgesia in rats with streptozocin-induced diabetic neuropathy. Pain. 2009;145(1-2):184–195. doi: 10.1016/j.pain.2009.06.012. [DOI] [PMC free article] [PubMed] [Google Scholar]
- 21.Dogrul A, Gardell LR, Ossipov MH, Tulunay FC, Lai J, Porreca F. Reversal of experimental neuropathic pain by T-type calcium channel blockers. Pain. 2003;105(1-2):159–168. doi: 10.1016/s0304-3959(03)00177-5. [DOI] [PubMed] [Google Scholar]
- 22.Hildebrand ME, Snutch TP. Contributions of T-type calcium channels to the pathophysiology of pain signaling. Drug Discovery Today. 2006;3(3):335–341. [Google Scholar]
- 23.Snutch TP, David LS. T-type calcium channels: an emerging therapeutic target for the treatment of pain. Drug Development Research. 2006;67(4):404–415. [Google Scholar]
- 24.Todorovic SM, Jevtovic-Todorovic V. Regulation of T-type calcium channels in the peripheral pain pathway. Channels. 2007;1(4):238–245. doi: 10.4161/chan.4953. [DOI] [PubMed] [Google Scholar]
- 25.Jagodic MM, Pathirathna S, Nelson MT, et al. Cell-specific alterations of T-type calcium current in painful diabetic neuropathy enhance excitability of sensory neurons. Journal of Neuroscience. 2007;27(12):3305–3316. doi: 10.1523/JNEUROSCI.4866-06.2007. [DOI] [PMC free article] [PubMed] [Google Scholar]
- 26.Talley EM, Cribbs LL, Lee J-H, Daud A, Perez-Reyes E, Bayliss DA. Differential distribution of three members of a gene family encoding low voltage-activated (T-type) calcium channels. Journal of Neuroscience. 1999;19(6):1895–1911. doi: 10.1523/JNEUROSCI.19-06-01895.1999. [DOI] [PMC free article] [PubMed] [Google Scholar]
- 27.Khomula EV, Viatchenko-Karpinski VY, Borisyuk AL, et al. Specific functioning of Cav3.2 T-type calcium and TRPV1 channels under different types of STZ-diabetic neuropathy. Biochimica et Biophysica Acta. 2013;(5):636–649. doi: 10.1016/j.bbadis.2013.01.017. [DOI] [PubMed] [Google Scholar]
- 28.Coste B, Crest M, Delmas P. Pharmacological dissection and distribution of NaN/Nav1.9, T-type Ca2+ currents, and mechanically activated cation currents in different populations of DRG neurons. Journal of General Physiology. 2007;129(1):57–77. doi: 10.1085/jgp.200609665. [DOI] [PMC free article] [PubMed] [Google Scholar]
- 29.Cardenas CG, del Mar LP, Scroggs RS. Variation in serotonergic inhibition of calcium channel currents in four types of rat sensory neurons differentiated by membrane properties. Journal of Neurophysiology. 1995;74(5):1870–1879. doi: 10.1152/jn.1995.74.5.1870. [DOI] [PubMed] [Google Scholar]
- 30.Scroggs RS, Fox AP. Calcium current variation between acutely isolated adult rat dorsal root ganglion neurons of different size. Journal of Physiology. 1992;445:639–658. doi: 10.1113/jphysiol.1992.sp018944. [DOI] [PMC free article] [PubMed] [Google Scholar]
- 31.Stucky CL, Lewin GR. Isolectin B4-positive and -negative nociceptors are functionally distinct. Journal of Neuroscience. 1999;19(15):6497–6505. doi: 10.1523/JNEUROSCI.19-15-06497.1999. [DOI] [PMC free article] [PubMed] [Google Scholar]
- 32.Woolf CJ, Ma Q. Nociceptors-noxious stimulus detectors. Neuron. 2007;55(3):353–364. doi: 10.1016/j.neuron.2007.07.016. [DOI] [PubMed] [Google Scholar]
- 33.Vulchanova L, Olson TH, Stone LS, Riedl MS, Elde R, Honda CN. Cytotoxic targeting of isolectin IB4-binding sensory neurons. Neuroscience. 2001;108(1):143–155. doi: 10.1016/s0306-4522(01)00377-3. [DOI] [PubMed] [Google Scholar]
- 34.Snider WD, McMahon SB. Tackling pain at the source: new ideas about nociceptors. Neuron. 1998;20(4):629–632. doi: 10.1016/s0896-6273(00)81003-x. [DOI] [PubMed] [Google Scholar]
- 35.Chen C-L, Broom DC, Liu Y, et al. Runx1 determines nociceptive sensory neuron phenotype and is required for thermal and neuropathic pain. Neuron. 2006;49(3):365–377. doi: 10.1016/j.neuron.2005.10.036. [DOI] [PubMed] [Google Scholar]
- 36.Hargreaves K, Dubner R, Brown F, Flores C, Joris J. A new and sensitive method for measuring thermal nociception in cutaneous hyperalgesia. Pain. 1988;32(1):77–88. doi: 10.1016/0304-3959(88)90026-7. [DOI] [PubMed] [Google Scholar]
- 37.Gerke MB, Plenderleith MB. Binding sites for the plant lectin Bandeiraea simplicifolia I-isolectin B4 are expressed by nociceptive primary sensory neurones. Brain Research. 2001;911(1):101–104. doi: 10.1016/s0006-8993(01)02750-0. [DOI] [PubMed] [Google Scholar]
- 38.Lee J-H, Gomora JC, Cribbs LL, Perez-Reyes E. Nickel block of three cloned T-type calcium channels: low concentrations selectively block α1H. Biophysical Journal. 1999;77(6):3034–3042. doi: 10.1016/S0006-3495(99)77134-1. [DOI] [PMC free article] [PubMed] [Google Scholar]
- 39.Tscherter A, David F, Ivanova T, et al. Minimal alterations in T-type calcium channel gating markedly modify physiological firing dynamics. Journal of Physiology. 2011;589(7):1707–1724. doi: 10.1113/jphysiol.2010.203836. [DOI] [PMC free article] [PubMed] [Google Scholar]
- 40.Yue J, Liu L, Liu Z, Shu B, Zhang Y. Upregulation of T-type Ca2+ channels in primary sensory neurons in spinal nerve injury. Spine. 2013;38(6):463–470. doi: 10.1097/BRS.0b013e318272fbf8. [DOI] [PubMed] [Google Scholar]
- 41.Rose KE, Lunardi N, Boscolo A, et al. Immunohistological demonstration of CaV3.2 T-type voltage-gated calcium channel expression in soma of dorsal root ganglion neurons and peripheral axons of rat and mouse. Neuroscience. 2013;250:263–274. doi: 10.1016/j.neuroscience.2013.07.005. [DOI] [PMC free article] [PubMed] [Google Scholar]
- 42.Zhong X, Liu JR, Kyle JW, Hanck DA, Agnew WS. A profile of alternative RNA splicing and transcript variation of CACNA1H, a human T-channel gene candidate for idiopathic generalized epilepsies. Human Molecular Genetics. 2006;15(9):1497–1512. doi: 10.1093/hmg/ddl068. [DOI] [PubMed] [Google Scholar]
- 43.Hall KE, Anders AAF, Wiley JW. Voltage-dependent calcium currents are enhanced in dorsal root ganglion neurones from the Bio Bred/Worchester diabetic rat. Journal of Physiology. 1995;486(2):313–322. doi: 10.1113/jphysiol.1995.sp020814. [DOI] [PMC free article] [PubMed] [Google Scholar]
- 44.Hall KE, Liu J, Sima AAF, Wiley JW. Impaired inhibitory G-protein function contributes to increased calcium currents in rats with diabetic neuropathy. Journal of Neurophysiology. 2001;86(2):760–770. doi: 10.1152/jn.2001.86.2.760. [DOI] [PubMed] [Google Scholar]
- 45.Latham JR, Pathirathna S, Jagodic MM, et al. Selective T-type calcium channel blockade alleviates hyperalgesia in ob/ob mice. Diabetes. 2009;58(11):2656–2665. doi: 10.2337/db08-1763. [DOI] [PMC free article] [PubMed] [Google Scholar]
- 46.Choe W, Messinger RB, Leach E, et al. TTA-P2 is a potent and selective blocker of T-type calcium channels in rat sensory neurons and a novel antinociceptive agent. Molecular Pharmacology. 2011;80(5):900–910. doi: 10.1124/mol.111.073205. [DOI] [PMC free article] [PubMed] [Google Scholar]
- 47.Jagodic MM, Pathirathna S, Joksovic PM, et al. Upregulation of the T-type calcium current in small rat sensory neurons after chronic constrictive injury of the sciatic nerve. Journal of Neurophysiology. 2008;99(6):3151–3156. doi: 10.1152/jn.01031.2007. [DOI] [PMC free article] [PubMed] [Google Scholar]
- 48.Swayne LA, Bourinet E. Voltage-gated calcium channels in chronic pain: emerging role of alternative splicing. Pflugers Archiv European Journal of Physiology. 2008;456(3):459–466. doi: 10.1007/s00424-007-0390-4. [DOI] [PubMed] [Google Scholar]
- 49.Nelson MT, Joksovic PM, Perez-Reyes E, Todorovic SM. The endogenous redox agent L-cysteine induces T-type Ca2+ channel-dependent sensitization of a novel subpopulation of rat peripheral nociceptors. Journal of Neuroscience. 2005;25(38):8766–8775. doi: 10.1523/JNEUROSCI.2527-05.2005. [DOI] [PMC free article] [PubMed] [Google Scholar]
- 50.Kozlov AS, McKenna F, Lee J-H, et al. Distinct kinetics of cloned T-type Ca2+ channels lead to differential Ca2+ entry and frequency-dependence during mock action potentials. European Journal of Neuroscience. 1999;11(12):4149–4158. doi: 10.1046/j.1460-9568.1999.00841.x. [DOI] [PubMed] [Google Scholar]
- 51.Warre RCH, McNaughton NCL, Randall AD. Differential discrimination of fast and slow synaptic waveforms by two low-voltage-activated calcium channels. Neuroscience. 2002;110(2):375–388. doi: 10.1016/s0306-4522(01)00576-0. [DOI] [PubMed] [Google Scholar]