

Abstract
Bottom-up proteomics studies traditionally involve proteome digestion with a single protease, trypsin. However, trypsin alone does not generate peptides that encompass the entire proteome. Alternative proteases have been explored, but most have specificity for charged amino acid side chains. Therefore, additional proteases that improve proteome coverage through cleavage at sequences complementary to trypsin's may increase proteome coverage. We demonstrate the novel application of two proteases for bottom-up proteomics: wild type α-lytic protease (WaLP) and an active site mutant of WaLP, M190A α-lytic protease (MaLP). We assess several relevant factors, including MS/MS fragmentation, peptide length, peptide yield, and protease specificity. When data from separate digestions with trypsin, LysC, WaLP, and MaLP were combined, proteome coverage was increased by 101% relative to that achieved with trypsin digestion alone. To demonstrate how the gained sequence coverage can yield additional post-translational modification information, we show the identification of a number of novel phosphorylation sites in the Schizosaccharomyces pombe proteome and include an illustrative example from the protein MPD2 wherein two novel sites are identified, one in a tryptic peptide too short to identify and the other in a sequence devoid of tryptic sites. The specificity of WaLP and MaLP for aliphatic amino acid side chains was particularly valuable for coverage of membrane protein sequences, which increased 350% when the data from trypsin, LysC, WaLP, and MaLP were combined.
The most powerful technique for system-scale protein measurement, or proteomics, is mass-spectrometry-based proteomics (1). Although great progress has enabled the quantification of nearly all proteins expressed in yeast (2, 3), sequence coverage is often dismal, with some proteins being identified by a single peptide sequence. Complete amino acid coverage is valuable for comprehensive profiling of post-translational modifications (e.g. phosphorylation) and for quantification of splice variants. Low observed proteome coverage can be caused by several factors, including the wide dynamic range of protein concentrations in biological samples, splice variants, and unanticipated or unconsidered post-translational modifications (PTMs).1 Improvements to every step of the bottom-up proteomics workflow continue to increase the observable proteome.
Because of length constraints that limit observable peptides, proteome coverage is ultimately limited by proteome digestion. Typically, identifiable peptides are between 7 and 35 amino acids in length, with the lower limit being determined by sequence uniqueness and the upper limit being determined by the instrument's resolving power (4). In silico proteome digestions predict that nearly one-quarter of peptides generated from tryptic digestion of the Saccharomyces cerevisiae proteome will be only a single amino acid long. Sequences lost due to length overall result in a theoretical upper proteome coverage limit of 68.8% according to in silico predictions (supplemental Fig. S1).
Recently, several groups have demonstrated that combining data from separate protease digestions improves proteome coverage (4–7). Improved peptide yield was also shown, allowing proteome analysis of small-quantity samples from laser-capture microdissection (8, 9). Swaney et al. used trypsin, Lys-C, Arg-C, Glu-C, and Asp-N to double the observed S. cerevisiae nonredundant amino acid coverage from 11.9% to 25.5% (4).
Other proteases that are used in proteomics to complement trypsin mainly cleave at ionic amino acid side chains, and it would be useful to have proteases with additional, complementary specificities. Here we demonstrate the application of wild-type α-lytic protease (WaLP) (10) and an active site mutant of WaLP, M190A α-lytic protease (MaLP) (11), to proteome digestion for shotgun proteomics. Both were reported to have specificity for cleaving after aliphatic side chains, which are more common amino acids. WaLP is a serine protease secreted from the soil bacteria Lysobacter enzymogenesis (10, 12) and has been studied extensively via mutagenesis and biophysical methods (11). WaLP has been found to exhibit remarkable stability (13, 14).
Non-tryptic peptides are more difficult to identify than tryptic peptides, especially when lacking defined termini (i.e. from semi-specific protease digestion or endogenous peptides) due to increased database search space and less predictable ionization and fragmentation. A lack of defined termini drastically increases database search space because more possible peptides fall within the precursor tolerance and drive up false positive rates (15). The majority of tryptic peptides have one positive charge localized at each terminus in a +2 precursor charge state upon electrospray ionization, which results in well-characterized fragmentation by collision-induced dissociation (CID) (16, 17). Non-tryptic peptides, in contrast, may lack positively charged side chains (i.e. Arg, Lys, His) altogether, making it unlikely that multiple charges will be obtained upon electrospray ionization. Those that do contain positive charges away from the C terminus produce less predictable fragmentation upon CID. Recently, additional peptide fragmentation methods have become accessible, such as electron-transfer dissociation (ETD) (18), which produces fragment ion series that are less dependent on peptide sequence, and higher-energy collisional dissociation (HCD) (19). An in-depth comparison of activation methods for non-tryptic peptide identification has been published recently by Smith's lab. In that report the authors evaluated FT-CID, FT- ETD, and FT-HCD for sequencing peptides isolated from blood plasma (20).
To enable application of the α-lytic proteases with specificity for aliphatic amino acid side chains to shotgun proteomics, we address the above issues by comparing multiple fragmentation modes in combination with the peptide identification algorithm MS-GFDB, which easily learns scoring parameters from an initial set of annotated peptide-spectrum matches for arbitrary fragmentation methods and proteases (21). We analyzed standard protein mixtures and complex Schizosaccharomyces pombe proteomes digested with trypsin, LysC, WaLP, and MaLP. Specifically, we assessed ion activation methods, observed peptide character, and biological gains due to additional digestions. The results present the pros and cons of using orthogonal proteases in proteomics.
EXPERIMENTAL PROCEDURES
Samples and Chemicals
Acetonitrile (ACN) optima, tri-carboxyethyl phosphine (Bond-Breaker), and HPLC-grade ethyl-acetate were purchased from Thermo Fisher Scientific (Waltham, MA). N-ethyl maleimide (NEM), formic acid (FA), sodium deoxycholate (SDC), sodium dodecyl sulfate (SDS), and Trizma-brand Tris buffer were obtained from Sigma-Aldrich (St. Louis, MO). All chemicals were the highest grade available and were used without further purification. Sequencing-grade modified trypsin was purchased from Promega (Madison, WI). A mixture of standard proteins was prepared containing bovine aprotinin (6.5 kDa, P00974), murine leptin (16 kDa, P41160), horseradish peroxidase (39 kDa, P00433), E. coli GroEL (57 kDa, P0A6F5), bovine serum albumin (69 kDa, P02769), cytochrome c (12.4 kDa, P00004), and hemoglobin α (15.3 kDa, P69905) and β chains (16 kDa, P68871). This mixture was prepared as described and compared with recently published results (22).
Protease Expression and Purification
WaLP was expressed from Lysobacter enzymogenesis type 495 using Bachovichin's media supplemented with minimum Eagle's medium vitamins and 60 g/l sucrose. L. enzymogenesis was grown at 30 °C with shaking at 100 rpm for 3 days. MaLP was expressed as described previously (23) in D1210 E. coli using the pALP12-ΔM190A plasmid, which was the generous gift of Dr. Dave Agard. Both proteases were purified from the culture supernatant as described previously (24). Briefly, the protease is captured from the supernatant by means of batch binding on SP-Sepharose, which is washed extensively and then eluted with high-pH glycine buffer. After buffer exchange to pH 7.2, the enzyme was loaded by superloop onto an FPLC monoS column using a gradient of 10 mm NaHPO4, pH 7.2, to the same buffer containing 250 mm NaOAc over 1 h.
Protease Activity Assays
Enzyme activity was assessed with a chromogenic assay using N-succinyl-Ala-Ala-Ala-p-nitroanalide (Sigma-Aldrich, St. Louis, MO) for WaLP, N-succinyl-Ala-Ala-Pro-Leu-p-nitroanilide (Bachem Americas, Torrance, CA) for MaLP, N-succinyl-Ala-Ala-Pro-Phe-p-nitroanilide (Sigma-Aldrich, St. Louis, MO) for chymotrypsin, or N-p-tosyl-Gly-Pro-Lys-p-nitroanilide (Sigma-Aldrich, St. Louis, MO) for trypsin and LysC. The specific activity of WaLP was 5 × 10⁻⁴ mmols N-succinyl-Ala-Ala-Ala-p-nitroanalide hydrolyzed per minute per milligram of WaLP, and the specific activity of MaLP was 3 × 10⁻² mmols N-succinyl-Ala-Ala-Pro-Phe-p-nitroanilide hydrolyzed per minute per milligram of MaLP. The WaLP and MaLP proteases are both being made available from Sigma-Aldrich. All protease assays were carried out under identical buffer conditions, except that SDC assays were done in HEPES because Tris-buffered SDC without dissolved protein is very viscous.
In-gel Digestion
To test the suitability of WaLP and MaLP for in-gel digests, we obtained a sample of glucose transporter-5 (UniProt accession number P22732) that was expressed in Pichia pastoris and then deglycosylated with PNGase F. After SDS-PAGE, the band was excised and subjected to in-gel digestion separately with trypsin, WaLP, or MaLP according to established protocols. The resulting peptides were analyzed with a 5600 TripleTof (AB Sciex, Framingham, MA) interfaced with a NanoAcquity UPLC (Waters, Inc., Milford, MA). Peptides were separated with a 1-h linear gradient from 5% to 80% mobile phase B at a flow rate of 250 μl/min using a charged-surface hybrid C18 column (75-μm inner diameter by 20-cm length, 2.5-μm particles; Waters). Mobile phase A was 98% water, 2% ACN, 0.1% FA, and 0.005% TFA, and mobile phase B was100% ACN, 0.1% FA, and 0.005% TFA. Precursor spectra (400–1250 m/z) were collected for 0.25 s, and then MS/MS (50–2000 m/z) of up to 50 of the most intense charge +2, +3, and +4 precursors was conducted for 2.4 s. The minimum intensity for MS/MS selection was 150 counts. Precursors were dynamically excluded for 4 s. The data were analyzed with Protein Prospector as described below.
Proteome Preparation and Digestion
S. pombe cell lysates were a generous gift from Dr. Paul Russell. S. pombe cells were lysed using a bead mill in 50 mm Tris-HCl pH 8.0, 150 mm NaCl, 5 mm EDTA, 10% glycerol, 50 mm NaF, 0.1 mm Na3VO4, 0.2% Nonidet P-40. Lysates were clarified at 15,700 × g for 10 min and the supernatant was removed. Insoluble material from the lysate was re-extracted according to a non-SDS compatible protocol, combined with the soluble material, and precipitated via chloroform/methanol extraction as described previously (25). Protein precipitates were resuspended in 100 mm Tris pH 7.2 containing 1.0% SDC, reduced with 5 mm tri-carboxyethyl phosphine at 60 °C for 30 min, and alkylated with 10 mm NEM at room temperature for 1 h. Tri-carboxyethyl phosphine and NEM were then removed via ultrafiltration with a 10-kDa-cutoff Amicon-4 (EMD Millipore, Billerica, MA) with three 10-fold buffer exchanges into 100 mm Tris pH 7.2 containing 0.1% SDC. The alkylated S. pombe proteome concentration was determined using a BCA assay (Pierce Chemicals, from Thermo Scientific). Samples (150 μg) of S. pombe proteome were separately digested with trypsin, LysC, WaLP, or MaLP at a ratio of 1:100 for 24 h at a total protein concentration of 0.5 mg/ml, and SDC was removed by acidification with 5% FA, extracted with ethyl acetate, and purified by SepPak C18 (Waters) purification as described previously (26, 27).
MS Activation Comparisons
A series of analyses of mixtures of known proteins and of unseparated proteome digests were performed in order to determine the best activation parameters for the MS/MS runs. For these experiments, 0.65-μg samples of S. pombe proteome digest were resuspended in 5 μl of 0.1% FA and injected onto a trap column (Waters Symmetry, 180-μm inner diameter by 20-mm length, 5-μm C18 particles) equilibrated in 0.2% TFA using a Waters NanoAcquity autosampler and binary solvent manager. A 100-μm inner diameter by 15 cm column (packed in-house) containing 3-μm Magic C18 AQ particles was used for peptide separation using a 2.5-h gradient of 2% to 30% B (0.2% TFA in 90% ACN) at a flow rate of 0.6 μl/min. The total run time was 1.5 h for the standard protein mix and 3 h for the S. pombe digests, including column flush and re-equilibration. Eluting peptides were electrosprayed at 2.7 kV using a Proxeon Nanospray Flex Ion Source interfaced to LTQ-Orbitrap Velos hybrid mass spectrometer (Thermo Fisher, Waltham, MA) using a precursor scan from 350–1400 m/z and a target resolution of 30,000 in profile mode. Unassigned and +1 precursor charge states were excluded, and dynamic exclusion was enabled for 45 s allowing one repeat and using sequential activation of the top five precursors using CID, then ETD, then HCD with the FT mass analyzer. The scan rate for this experiment was 1.2 spectra per second. Additional experiments were performed in which the top 10 precursors were sequentially targeted with CID and then ETD using the ion trap as the mass analyzer and in which the top 10 precursors were targeted using a data-dependent decision tree (ddDT) approach (28) to activate all +2 precursor charge states with CID and all +3 or greater precursor charge states with ETD. As expected, the faster scan rate of the ion trap yielded more peptide identifications than data from the higher resolution FT mass analyzer. The results from these experiments demonstrated the utility of the ddDT approach, which was then used to analyze the fully separated S. pombe proteome digests.
High-pH Fractionation of Proteome Samples
Peptide fractionation via high-pH reverse-phase (HPRP) was performed as described previously (29). Briefly, lyophilized peptides were resuspended in 1.15 ml of 20 mm ammonium formate (NH4HCO2), pH 10 (HPRP mobile phase A). HPRP buffer B was 80% ACN with 20% 20 mm NH4HCO2, pH 10. Peptides were separated over a 100 × 2.1 mm Waters C18 BEH column (5-μm particles) maintained at 40 °C. Samples (1.05 ml) were loaded at a flow rate of 0.5 ml/min over 7 min in 98% A, and peptides were eluted with a gradient from 2% to 100% B over 27 min. Fifty-four 0.5-ml fractions were collected into 100 μl of 10% FA, and fractions were pooled according to the method of Smith's lab to yield 18 final pooled fractions that were lyophilized and stored at −80 °C until nano-LC-MS/MS analysis (29).
Nano-LC Electrospray Ionization MS/MS of HPRP-fractionated Digests
Each pooled HPRP fraction was resuspended in 75 μl of 0.1% FA. Five microliters (∼0.5 μg/fraction) were injected into the LTQ-Orbitrap Velos hybrid mass spectrometer as described above, but with a 60-min gradient from 2% to 30% B followed by column re-equilibration, for a total of 90 minutes per run. For these experiments, a ddDT (28) was used to activate all +2 precursor charge states with CID and all +3 or greater precursor charge states with ETD. The total nano-LC-MS/MS acquisition time was 27 hours per protease, or 4.5 days total. Supplemental Table S1 contains a list of all of the experiments.
Database Searches
Files (.RAW) were converted to .mzXML files using the default parameters in msconvert.exe except for the option to centroid all spectra (version 3.0.4323, February 5, 2013) within Trans-Proteomic Pipeline (version 4.6.2) (30, 31). The standard protein mix data (CID/HCD/ETD triples, high resolution) were searched with Protein Prospector against the E. coli subset of Swiss-Prot (March 21, 2012 version) with the sequences for each standard mix protein and protease added because the number of spectra was insufficient to properly train MS-GFDB. The database contained a total of 22,934 real and 22,934 randomized sequences comprising all E. coli strain sequences (45,868 total protein sequences) to allow estimation of the false discovery rate (FDR). Data from the unseparated S. pombe digests (CID/HCD/ETD triples, high resolution) were searched with Protein Prospector against the S. pombe subset of Swiss-Prot (March 21, 2012 version) with accessions for each protease added (4990 real, 4990 randomized, 10,980 total). An initial search was carried out with a 10-ppm precursor tolerance and 15-ppm fragment-ion tolerance to calibrate the precursor masses, and this was followed by another search with a 5-ppm precursor tolerance and 15-ppm fragment-ion tolerance. Searches with trypsin and Lys-C data allowed up to three missed cleavages and one non-enzymatic terminus. Searches of WaLP and MaLP data used “no enzyme” specificity. Default variable modifications were used. Searches required the fixed modification of cysteine with NEM. The data on unseparated S. pombe proteome collected as CID/HCD/ETD triples were also searched with MS-GFDB version 7780 (21) against common contaminants and the S. pombe complete proteome containing a total of 5099 real and 5099 reversed sequences (downloaded from UniProt on June 20, 2012) using the merge search for comparison of the amount of internal ions. The comparison between Protein Prospector and MS-GFDB searches revealed that for WaLP and MaLP, Protein Prospector gave similar numbers of unique peptides (supplemental Table S2).
Data from the fully separated proteome analyses were converted to .mzXML and merged using mzXMLmerge to make database searching and downstream analysis more manageable. The merged .mzXML files were searched with MSGFplus.jar version 9352 (released on February 4, 2013).2 MS-GFDB is a database search engine that reports rigorous p values (spectral probabilities) for spectral interpretations based on all possible peptide match scores (21). The key advantages of the MS-GF algorithm are that it is highly effective in utilizing spectral evidence, the spectral interpretations are rigorously scored, and the scoring algorithm can be re-trained using large datasets of annotated spectra (32). MS-GFDB extends MS-GF to automatically derive scoring parameters from a set of annotated MS/MS spectra of any type (e.g. CID, ETD, etc.). This aspect was particularly important for efficient spectral interpretation of data from nontryptic digests. MSGF+ is a successor of MS-GFDB that additionally allows input of mzml data and produces mzIdentML output files.2 Database searches used default parameters, except the number of tolerable enzymatic termini was set to 1 and searches of MaLP and WaLP used “no enzyme” specificity. Searches required fixed modification of cysteine by NEM and variable modification at peptide N-terminal Q to pyro-glutamate, protein N-terminal methionine loss plus acetylation, and methionine oxidation. Precursor masses containing between 0 and 2 13C were considered. For all MS-GFDB searches and all MS-GF+ searches, the precursor mass tolerance was set to 5 ppm. After initial searches of each activation method alone, the scoring parameters were trained and the data were re-searched with the new scoring model. Only the MS-GFDB search engine was used for the large datasets because it was faster than Protein Prospector.
In order to quantitatively compare internal ions produced from peptide activation by HCD, we first used sequences identified by merged searches with MS-GFDB of S. pombe CID/ETD/HCD triples. The merged searches afforded HCD spectra that were insufficient in themselves for peptide identification. To identify internal ions in the HCD spectra, all possible internal ions from the identified peptide sequence were predicted using an in-house program created in [R]. The raw HCD spectrum corresponding to the matched peptide was then searched for the presence of each internal ion. A similar analysis was done on the ddDT spectra to determine the presence of internal ion peaks in the CID spectra from this larger dataset. All peptide-spectrum matches from ddDT spectra were analyzed for the intensity and presence of b-, y-, c-, z-, and internal ions. The b-ion count included b-H2O and b-NH3 if the peptide sequence contained serine/threonine or asparagine/glutamine, and similarly losses were included in the y-ion and internal ion counts. Intact precursor ions and neutral losses from the precursors were removed from ETD spectra using the msconvert.exe ETD filter before computing c- and z- ions and c-1 and z+1 ions were included in the c- and z-ion values. The ions were quantified both as a percentage of the total ion current (TIC) and as a percentage of all MS/MS peaks in the spectrum. The fraction of peptide backbone breaks, defined by the presence of a b or y fragment ion corresponding to a break in the peptide backbone, was calculated according to Ref. 33.
Data Analysis
MS-GFDB search output from the activation comparison experiments was filtered to <1% peptide-level FDR. Proteome coverage was calculated using the Proteome Coverage Summarizer from PNNL using only peptides with a <1% peptide-level FDR as calculated by PeptideProphet (34). Protein identifications were by ProteinProphet with the default parameters (35). Proteome coverage was calculated using the Proteome Coverage Summarizer from PNNL using only peptides with a <1% peptide-level FDR as calculated by PeptideProphet. Euler diagrams were generated using eulerAPI. Additional analyses were carried out using in-house scripts written in [R] (36); these have been made available online at GitHub as “PepsuM.” Protease specificity heatmaps were generated using only unique peptide sequences from PeptideProphet output. Trans-membrane proteins were predicted from all identified proteins using TMHMM (37). The peptide sequences were analyzed using iceLogos (38).
RESULTS
Protease Activity in SDC, SDS, and Guanidine Hydrochloride
Previous studies on WaLP indicated that it possessed remarkable stability (39). As this property may provide advantages for the digestion of proteome samples under various solution conditions, we performed protease activity assays in various proteomic digestion conditions to assess the versatility of WaLP and MaLP compared with trypsin, LysC, and chymotrypsin. In every condition, the activity of WaLP and MaLP was similar to or greater that of trypsin; however, chymotrypsin showed higher activity than WaLP in urea and guanidine (Table IA). Strikingly, however, chymotrypsin activity decreased markedly over time under typical proteomic digestion conditions, whereas the activity of WaLP and MaLP remained high (Table IB). These results suggest that for the digestion of complex proteomes requiring several hours of digestion, WaLP and MaLP may be superior to chymotrpysin and may provide a reason for our inability to find reports of complex proteome digestions utilizing chymotrypsin.
Table I. Relative activity of various proteases under proteomic digestion conditions.
| Condition | Trypsin | Lys C | Chymotrypsin | WaLP | MaLP |
|---|---|---|---|---|---|
| A. Relative activity (as a percentage of the control) in various conditions relative to no denaturant control | |||||
| No denaturant | 100 | 100 | 100 | 100 | 100 |
| 0.1% SDC | 59 | 48 | 89 | 186 | 132 |
| 1.0% SDC | 55 | 62 | 130 | 78 | 62 |
| 0.1% SDS | 10 | 96 | 19 | 54 | 39 |
| 1.0% SDS | 0 | 71 | 0 | 42 | 31 |
| 1 m GdnCl | 16 | 113 | 83 | 22 | 19 |
| 4 m GdnCl | 2 | 14 | 16 | 1 | 1 |
| 1 m urea | 87 | 116 | 82 | 26 | 58 |
| 4 m urea | 57 | 149 | 57 | 12 | 30 |
| B. Relative activity (as a percentage compared to time 0) after incubation for 20 h | |||||
| No denaturant | 64 | 103 | 1 | 28 | 11 |
| 0.1% SDC | 87 | 60 | 6 | 96 | 96 |
| 1.0% SDC | 85 | 92 | 22 | 99 | 109 |
GdnCl, guanidine hydrochloride.
Coverage of Standard Protein Mixture
A standard protein mixture digested by various proteases was analyzed via FT-CID/ETD/HCD to determine proteome coverage for comparisons to recently published results (22). Digestion of these simple standard protein mixtures gave relatively high protein sequence coverage regardless of the protease (trypsin, LysC, chymotrypsin, elastase, WaLP, or MaLP) (Table II). Relative to all others, chymotrypsin yielded slightly longer peptides on average, whereas elastase yielded slightly shorter peptides. The average lengths of peptides generated by WaLP and MaLP were similar to those generated by trypsin. Similarly high protein sequence coverage was obtained when WaLP and MaLP digest data were combined with trypsin and Lys-C as compared with a recent report using combined data from trypsin, Lys-C, Glu-C, Asp-N, chymotrypsin, and Arg-C digests of a similar mixture (Table III).
Table II. Percent protein coverage and average peptide lengths obtained from digestion of a standard protein mixture with various proteases.
| Protein | Trypsin | LysC | Elastase | Chymotrypsin | WaLP | MaLP |
|---|---|---|---|---|---|---|
| GroEL | 87.8 | 92.6 | 73.7 | 97.6 | 80.5 | 81.0 |
| Leptin | 96.5 | 78.1 | 52.7 | 92.5 | 95.2 | 80.2 |
| Aprotinin | 70.7 | 91.4 | 65.5 | 94.8 | 96.6 | 79.3 |
| Peroxidase | 58.1 | 38.6 | 47.7 | 64.6 | 58.5 | 57.2 |
| BSA | 81.8 | 92.3 | 79.4 | 95.7 | 89.2 | 83.5 |
| Cytochrome C | 66.3 | 67.3 | 82.7 | 78.9 | 82.7 | 69.3 |
| Hb α | 81.6 | 55.3 | 47.5 | 66.0 | 68.8 | 51.0 |
| Hb β | 86.3 | 82.9 | 35.6 | 91.1 | 56.2 | 44.5 |
| Average peptide length | 12.5 ± 5.1 | 15.0 ± 8.1 | 10.7 ± 3.1 | 14.8 ± 6.4 | 11.7 ± 4.8 | 12.0 ± 4.5 |
Table III. Percent protein coverage obtained by combining data obtained from the digestion of a standard protein mixture with various proteases compared to results from Guthals et al. (22).
| Protein | Trypsin | LysC | WaLP | MaLP | Combined | Percentage of combined (22) | Combined residues/residues in protein | Fold gain of combined/trypsin |
|---|---|---|---|---|---|---|---|---|
| GroEL | 87.8 | 92.6 | 80.5 | 81.0 | 98.4 | 97.8 | 539/548 | 1.121 |
| Leptin | 96.5 | 78.1 | 95.2 | 80.2 | 98.0 | 94.6 | 143/146 | 1.016 |
| Aprotinin | 70.7 | 91.4 | 96.6 | 79.3 | 102.0a | 102.0a | 59/58 | 1.443 |
| Peroxidase | 58.1 | 38.6 | 58.5 | 57.2 | 77.9 | 67.7 | 240/308 | 1.341 |
| BSA | 81.8 | 92.3 | 89.2 | 83.5 | 98.6 | 575/583 | 1.205 | |
| Cytochrome C | 66.3 | 67.3 | 82.7 | 69.3 | 85.6 | 89/104 | 1.290 | |
| Hb α | 81.6 | 55.3 | 68.8 | 51.0 | 99.3 | 140/141 | 1.218 | |
| Hb β | 86.3 | 82.9 | 56.2 | 44.5 | 92.5 | 135/146 | 1.072 |
a Our results and those of Guthals et al., both demonstrate that the mature sequence of Aprotinin given in UniProt is too short, actually it appears to contain an additional N-terminal residue (we found residues 35–93, not 36–93 as reported in UniProt).
Comparison of Tryptic and Nontryptic Peptide Identification Using CID, ETD, and HCD
Peptide fragment ion series depend on the peptide amino acid sequence and the activation method used to induce fragmentation (40). Tryptic peptides, which bear at least one positive charge at each terminus, produce strong b- and y-ion series upon activation with CID or HCD. Because peptides from WaLP and MaLP digestion lack such defined charge character, we used the versatile fragmentation ability of the LTQ-Orbitrap Velos (41) equipped with ETD to assess the identification efficiency of nontryptic peptides by CID, ETD, and HCD. First, we analyzed data from total S. pombe digests in which peptides identified in MS1 were sequentially activated by CID, ETD, and HCD to compare the results for aLP digests to those for trypsin digests. This analysis revealed some challenges related to the fact that WaLP and MaLP generate nontryptic peptides and cleave after several different amino acid residues. Out of the three FT-measured MS/MS activations, FT-HCD was most efficient for the identification of tryptic peptides, and the overlap between peptides identified by all three activation methods was high (73%) (Fig. 1). FT-CID and FT-HCD performed similarly for the identification of nontryptic peptides from WaLP digestion, and the overlap was considerably lower (65%). The greatest overlap of unique identifications was for peptides from Lys-C, with 85% of unique sequences identified by all three activations. Supplemental Fig. S2 shows CID, ETD, and HCD spectra for the same peptide from the WaLP digestion. The CID spectrum contains a significant number of peaks due to losses of water and ammonia, and the HCD spectrum contains internal fragment ions, both of which are known to increase spectral complexity (42, 43), resulting in lower peptide-spectrum match scores for peptides that do not have well-defined terminal residues. ETD resulted in abundant charge-reduced precursors along with a low-intensity series of c- and z- sequence ions (supplemental Fig. S2C). ETD contributed a greater percentage of nonoverlapping peptide identifications for WaLP and MaLP than for trypsin or LysC, consistent with our previous study comparing CID and ETD for nontryptic peptides from elastase and pepsin (44).
Fig. 1.
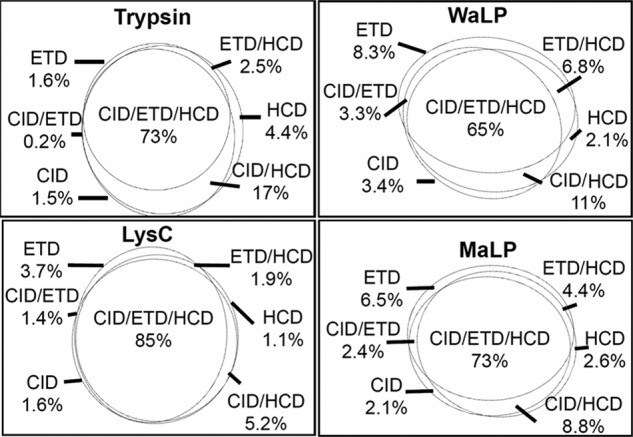
Euler diagrams showing the contribution of CID, ETD, and HCD to all unique peptides identified from sequential activation analyses of unfractionated S. pombe proteome. Samples were analyzed using a 3-h reverse-phase separation (resulting in a total of 1836 peptides identified from the trypsin digest, 1307 from the LysC digest, 1744 from the WaLP digest, and 1327 from the MaLP digest). The greatest overlap in identifications was observed for peptides from LysC digestion, and the least overlap was observed for peptides from WaLP digestion. ETD contributed a greater percentage of unique sequences for peptides from WaLP and MaLP digestion than for peptides from trypsin or LysC digestion.
We re-searched these spectra using a merged search protocol in MS-GFDB. This approach resulted in more peptide identifications within a 1% FDR. Merged searching resulted in only marginal improvements in the number of identifications of peptides from the trypsin and LysC digests (5% increases), but greater improvements (supplemental Table S2) were obtained for the samples from MaLP and WaLP digests. This is not surprising, as these searches were run without enzyme specificity and thus had the most to gain when capitalizing on the CID/ETD/HCD complementarity in searches over a larger search space. The merged search data also allowed us to analyze the HCD spectra that were not sufficient for peptide identification in the absence of additional information from ETD and/or CID (56% of the triples). We first analyzed all of the HCD spectra for identified peptides to determine the percentage of the TIC contributed by internal ions (7.2% for trypsin and 7.4% for LysC versus 9.2% for WaLP and 9.1% for MaLP). A statistically significant greater percentage of the TIC was contributed by internal ions from WaLP and MaLP digests than from trypsin digestion (Student's t test, p values < 10−10). We next analyzed the fraction of MS/MS peaks attributable to internal ions. In this analysis, only peptides from the WaLP digest yielded a statistically significant increase in the fraction of MS/MS peaks attributable to internal ions (10.3%), whereas the relative number of internal ion peaks from the MaLP digestion (8.4%) was similar to that from trypsin digestion (8.7%), and peptides from LysC produced slightly fewer internal ion peaks (7.9%). Using all peptides identified from the four separate digestions, we examined the cross-correlation of internal ion abundance with the presence of each of the 20 amino acids. The abundance and presence of internal ions was positively correlated with the presence of residues A, D, G, I, L, P, and V. Interestingly, only arginine was found to negatively correlate to internal ions.
We next used data from the CID/ETD activation comparison to determine branch points for a ddDT that targeted precursors for CID or ETD based on precursor charge state and m/z. A ddDT targeting +2 charge-state precursors with CID and ≥+3 charge-state precursors with ETD was implemented similarly to the manner described in previous reports (28). The total run time of the ddDT method was only 1.5 h, half that of the other activation comparison runs. Use of this ddDT afforded more unique peptide identifications from WaLP digestion than even the best 3-h activation experiment (i.e. 2544 from 1.5-h ddDT versus 2358 from merged search of ion trap CID/ETD). Use of the ddDT for tryptic peptides resulted in nearly as many peptides as ion trap CID in half the acquisition time (i.e. 4195 from 1.5-h ion trap ddDT and 4576 from 3-h ion trap CID).
Characterization of the MS/MS Data from WaLP and MaLP Digests
S. pombe proteome samples digested separately by trypsin, LysC, WaLP, or MaLP were separated off-line using HPRP (29), and each fraction was analyzed using a 90-min nano-LC run with the ddDT method. Over 200,000 MS/MS spectra were collected for each sample and searched with MSGF+ followed by training and re-searching. At a peptide-level FDR of less than 1%, similar numbers of peptides were identified from the trypsin, LysC, WaLP, and MaLP digests; 17,810 and 26,747 peptides were identified from the WaLP and MaLP digests, respectively (Table IV). Even though very similar numbers of spectra were collected for each digest, the number of peptides identified from the WaLP digest was somewhat lower. Several factors might have contributed to this, one being the nontryptic C termini generated by this enzyme.
Table IV. Results for proteome coverage based on unique peptides for each individual digest and combined data from different digests.
| Dataset | Spectra | Peptides | Protein groups | Proteome coverage (%) |
|---|---|---|---|---|
| Trypsin (T) | 246,996 | 20,480 | 2837 | 9.2 |
| LysC (L) | 226,403 | 21,565 | 2781 | 8.4 |
| WaLP (W) | 267,608 | 17,810 | 1955 | 5.8 |
| MaLP (M) | 251,103 | 26,747 | 2330 | 7.6 |
| T1 + T2a | 23,069 | 2947 (+6%) | 10.2 (+10%) | |
| T + L | 37,808 | 3293 (+16%) | 13.6 (+48%) | |
| T + W | 38,282 | 3007 (+6%) | 12.5 (+36%) | |
| T + M | 47,111 | 3207 (+13%) | 13.9 (+51%) | |
| T + L + W + M | 79,508 | 3555 (+24%) | 18.5 (+101%) |
a We analyzed the same trypsin digestion twice to ascertain how much additional coverage would be obtained by combining the datasets.
The gain in proteome coverage by combining data sets is given in the last column in parentheses. The gain from combining two separate trypsin digestions was 10%.
To better understand the consequences of nontryptic C termini for peptide identification, we analyzed the number of various fragment ions observed in the MS/MS spectra from trypsin, LysC, WaLP, or MaLP digests (Table V). The percentage of the TIC attributable to y-ions was higher for trypsin and LysC than for WaLP and MaLP, and conversely the percentage of the TIC attributable to b-ions was higher for WaLP and MaLP (Fig. 2). The y-ion directing capabilities of C-terminal positive charges have been discussed previously (45), but the impact on large proteome analyses can be appreciated from the results presented here. Indeed, many search engines give higher scores for y-ions than for other ions, which might be part of the reason more peptides were identified from the tryptic digestion than from the WaLP digestion. Another possible reason for lower numbers of peptide identifications from the WaLP digest could be the production of internal ions upon MS/MS. Training the MSGF+ scoring function for peptides from WaLP or MaLP allowed reasonable identification of nontryptic peptides despite the lower percentage of the TIC attributable to y-ions. In fact, the MaLP digested sample resulted in the greatest number of unique peptides identified (Table IV).
Table V. Analysis of ion types observed from peptides resulting from digestion with various proteases.
| Protease | Subset | % TIC | % MS/MS peaks | Notes |
|---|---|---|---|---|
| Trypsin | CID, b | 14.8 ± 8.6 | 8.30 ± 3.4 | CID PSMs = 65,891 |
| CID, y | 20.9 ± 10.7 | 9.0 ± 5.7 | ||
| CID breaks | 81.8 ± 15.3 | |||
| ETD, c | 21.1 ± 8.4 | 12.8 ± 4.6 | ETD PSMs = 13,222 | |
| ETD, z | 23.0 ± 8.6 | 14.1 ± 5.6 | ||
| ETD breaks | 47.5 ± 26.0 | |||
| LysC | CID, b | 17.2 ± 10.3 | 7.0 ± 3.0 | CID PSMs = 48,742 |
| CID, y | 18.2 ± 10.7 | 6.9 ± 2.8 | ||
| CID breaks | 83.7 ± 12.7 | |||
| ETD, c | 20.2 ± 8.4 | 8.1 ± 3.9 | ETD PSMs = 19,738 | |
| ETD, z | 22.1 ± 8.5 | 9.0 ± 4.2 | ||
| ETD breaks | 64.75 ± 25.0 | |||
| WaLP | CID, b | 22.4 ± 11.1 | 7.5 ± 3.1 | CID PSMs = 33,475 |
| CID, y | 14.5 ± 9.0 | 6.7 ± 2.6 | ||
| CID breaks | 80.4 ± 12.1 | |||
| ETD, c | 23.3 ± 8.8 | 10.3 ± 4.6 | ETD PSMs = 11,117 | |
| ETD, z | 19.1 ± 7.8 | 9.5 ± 4.0 | ||
| ETD breaks | 53.5 ± 23.6 | |||
| MaLP | CID, b | 20.1 ± 10.5 | 6.08 ± 2.44 | CID PSMs = 45,138 |
| CID, y | 14.4 ± 9.29 | 5.82 ± 2.13 | ||
| CID breaks | 84.3 ± 11.9 | |||
| ETD, c | 22.2 ± 8.61 | 7.05 ± 3.68 | ETD PSMs = 13,509 | |
| ETD, z | 18.5 ± 7.59 | 6.55 ± 3.09 | ||
| ETD breaks | 69.9 ± 20.6 |
PSM, peptide-spectrum match.
Fig. 2.
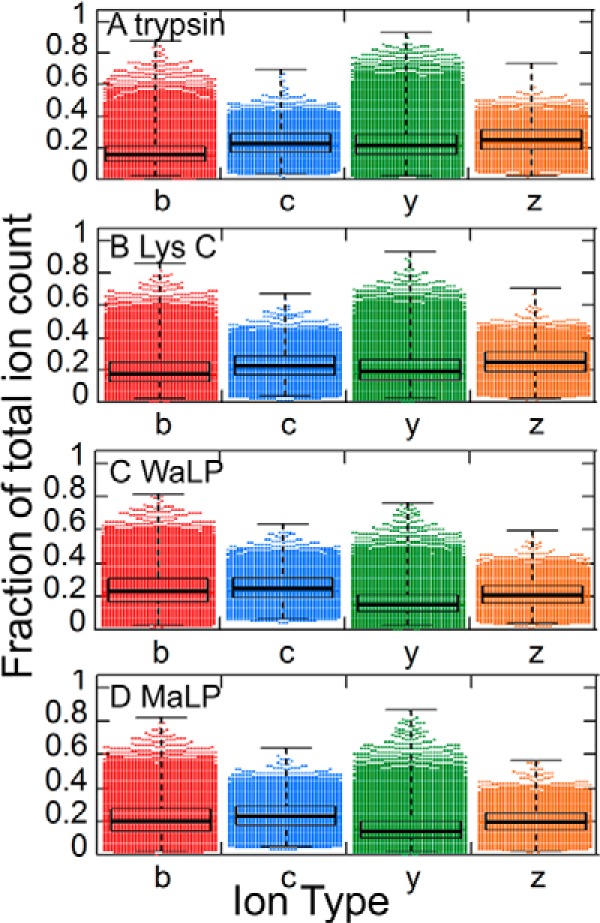
The fraction of observed ion types in the MS/MS spectra from which peptides could be identified from the datasets detailed in Table IV (A, trypsin; B, LysC; C, WaLP; D, MaLP; over 17,000 peptides from the WaLP digest and over 26,000 peptides from the MaLP digest). The black bars represent the inner quartile ranges and show that a significantly smaller proportion of the TIC was accounted for by C-terminal ions (y-ions and z-ions) for WaLP and MaLP digests that for trypsin and LysC digests.
Substrate Specificity of WaLP and MaLP
Previous studies of WaLP specificity based on chromogenic activity assays revealed high activity toward P1 residues A, V, and M (11). MaLP, which has an active site Met replaced by Ala, was reported to have broadened activity for M, L, and F but similar activity against A and V (11). In order to more fully characterize the substrate specificity, all unique peptide sequences from PeptideProphet were combined to determine the specificity of WaLP and MaLP. The observed specificity of WaLP and MaLP was visualized in heat maps of cleavage position and observed amino acid frequency (Fig. 3). For comparison, the same mapping was done for peptides from trypsin and LysC (supplemental Fig. S3). WaLP cleaved most frequently after T (36%), but also with significant frequency after V (30%), A (27%), S (26%), and M (16%). As reported previously, MaLP had specificity for slightly larger aliphatic amino acids, cleaving most frequently after M (32%), L (26%), F (26%), Y (14%), T (13%), and V (13%). These results show that WaLP and MaLP were somewhat more specific than elastase, which cleaved after A (43.5%), V (36.5%), I (34.7%), T (30.3%), S (21.4%), L (19.5%), and M (15.7%) (5). Interestingly, MaLP appeared to be able to differentiate between L and I (26% of leucines were found at the P1 position, versus only 8% of isoleucines), which cannot be resolved by mass alone. To follow up this potentially very interesting finding, we measured the ability of MaLP to cleave succinyl-A-A-P-L-pNa versus succinyl-A-A-P-I-pNa. Whereas activity toward the succinyl-A-A-P-L-pNa was high (specific activity of 3.4 × 10⁻³ U/mg, compared with 2.8 × 10⁻² U/mg for the substrate of choice, succinyl-A-A-P-F-pNa), the activity of MaLP toward succinyl-A-A-P-I-pNa was not observable under identical assay conditions.
Fig. 3.

Heat maps (with white representing the highest and red representing the lowest) summarizing the analysis of the occurrence of each amino acid at each position in the identified peptides detailed in Table IV (over 17,000 peptides from the WaLP digest and over 26,000 peptides from the MaLP digest). A, WaLP peptides; raw counts of frequency of each amino acid at each position. B, WaLP peptides; counts normalized for the occurrence of each amino acid at each position. C, iceLogo depicting the enrichment and depletion of specific amino acids (relative to the whole proteome) at each position in the WaLP peptides with residues colored according to property (acidic, red; basic, blue; hydrophobic, black; small/neutral, green). WaLP yields peptides with the following P1 (C-terminal) residues: A, 20%; V, 20%; S, 16%; T, 16%; G, 8%; L, 6%. D, MaLP peptides; raw counts of frequency of each amino acid at each position. E, MaLP peptides; counts normalized for the occurrence of each amino acid at each position. F, iceLogo depicting the enrichment and depletion of specific amino acids (relative to the whole proteome) at each position in the MaLP peptides. MaLP yields peptides with the following P1 (C-terminal) residues: L, 24%; F, 13%; V, 11%; A, 7%; T, 7%; I, 6%. The cleavage site is marked by a vertical line in each plot.
Length of Peptides from WaLP and MaLP Digestions
Because of their apparently promiscuous activity, complete digestion with WaLP or MaLP could result in many single amino acids and short peptides. Remarkably, WaLP digestion produces peptides with nearly the same average length as those resulting from trypsin digestion (11.8 ± 3.1 amino acids versus 12.2 ± 4.3 from WaLP and trypsin, respectively) (Fig. 4). MaLP digestion produced slightly longer peptides (12.6 ± 3.7 amino acids). In addition, if nonspecific digestion were resulting in more single amino acids produced, one would expect the yield of amino acids still in peptides that adhered to C18 during solid phase extraction to be less, but this was not the case. Amino acid analysis of peptides from each digest revealed similar total peptide yields from digestion by trypsin, WaLP, and MaLP (Fig. 5). Interestingly, these results suggest that amino acids corresponding to the P1 specificity are depleted. So, for example, the peptides isolated from trypsin digests contain less R and K than the whole proteome and the peptides isolated from WaLP digests contain less A, S, T, and V than the whole proteome. This would make sense if pairs of these residues were cleaved into individual amino acids and not retained as peptides in the experiment. Indeed, in silico trypsin cleavage yields digestion products of which nearly one-quarter would be only a single amino acid (presumably K or R).
Fig. 4.
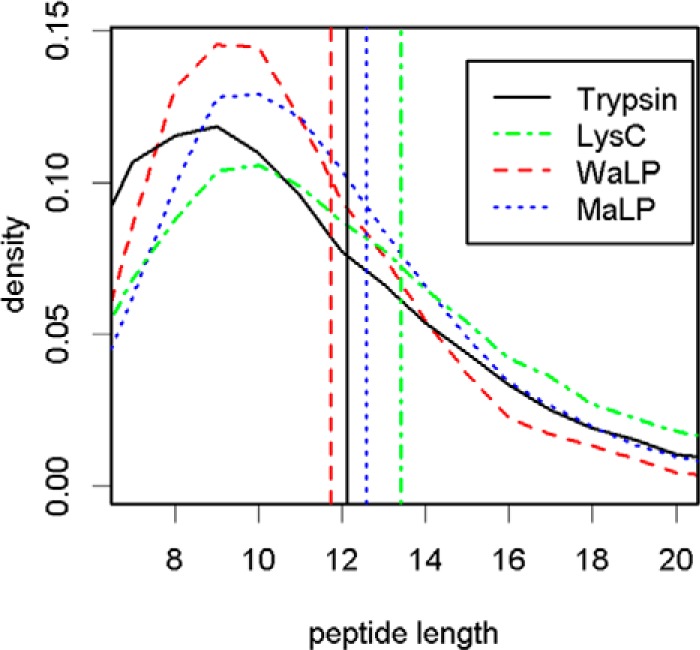
Observed length distribution of all the unique peptides from the protease digest data summarized in Table IV. Trypsin digestion generated a broader distribution with a higher frequency of shorter peptides. The size distributions of the peptides from the WaLP and MaLP digests were narrower than those for either trypsin or LysC. Colored vertical lines mark the average observed peptide lengths. WaLP digestion produced the shortest mean peptide length of 11.8 ± 3.1 amino acids. Trypsin digestion produced peptides with an average length of 12.2 ± 4.2 amino acids. MaLP and LysC produced slightly longer average peptides with lengths of 12.6 ± 3.7 and 13.5 ± 4.7 amino acids, respectively. The average lengths of the observed peptides were all remarkably similar.
Fig. 5.
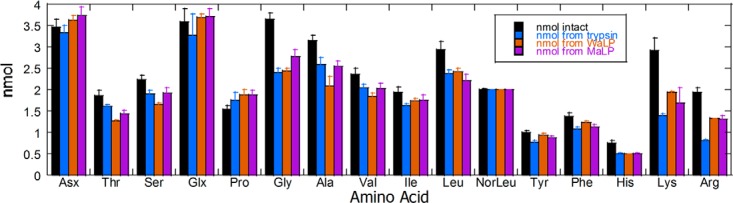
Quantitative amino acid analysis of undigested (black), trypsin-digested (blue), WaLP-digested (orange), and MaLP-digested (purple) S. pombe proteome after purification on C18 to remove single amino acids and undigested proteins. The results show that each protease yielded similar total amounts of peptides with similar amino acid compositions, but some interesting differences in amino acid content were also discovered (discussed further in the text).
Quantitation of Peptide Overlap
Another possible limitation due to proteome digestion by semi-specific proteases is the production of largely redundant sequences with different terminal truncations (“shredding”). We quantified the redundancy in amino acid coverage according to the following relationship:
 |
The numerator includes redundancy from chemical modification (e.g. oxidized methionine), overlapping peptides, and identification of multiple charge states. This relationship can be applied to any proteomics experiment to assess the efficiency of converting peptide identifications to covering proteome sequences. Peptides from trypsin digestion were the least redundant, and peptides from MaLP digestion were the most redundant. Redundancy values for trypsin, LysC, WaLP, and MaLP were 1.3, 1.6, 1.7, and 2.0, respectively. The redundancy for combined data was 2.7. Such high redundancy is expected to be useful for high ion coverage that would facilitate site localization of PTMs (46).
Biological Gains from WaLP and MaLP Digestions
The central aim of this study was to improve proteome coverage. Compared with data from only trypsin, the combined proteases increased protein identifications by 24% and proteome coverage by 101% (Table IV). Such gains were significantly greater than those afforded from re-injection of tryptic peptides, which increased proteome coverage by only 10%.
One possible gain from the increased proteome coverage would be in PTM identification. Although the samples were not enriched for phosphorylation, we re-searched the fully separated S. pombe proteome data allowing for variable phosphorylation of S and T to look for these PTMs. Indeed, the complementary amino acids covered from WaLP digestion allowed the observance of 95 serine and threonine phosphorylations, 63 of which had not been previously reported in UniProt. Similarly, 77 S/T phosphorylations were identified from the MaLP digest, 57 of which had not been previously reported (the assignments were made at the peptide level, not the site level). A particularly illustrative example of the improved coverage of phosphorylation sites was observed for the protein MPD2. The WaLP digest contained three phosphorylated peptides from MPD2, one corresponding to the previously reported phosphorylation of S175 and two novel sites at S223 and S750 (Fig. 6). It is clear from the sequence of the protein that S175 is located between two basic residues and would result in a tryptic peptide 17 amino acids long. The tryptic peptide covering S223 would be 75 amino acids in length, and the tryptic peptide covering S750 would be only 5 amino acids in length.
Fig. 6.

A, sequence of MPD2 showing S175 (yellow), a previously reported phosphorylation site, and S223 and S750 (red), phosphorylation sites that had not been reported before. B, annotated spectrum from the +3 charge state precursor of the peptide TGTApSPKLGSPFNHINRPV fragmented by ETD. C, annotated spectrum from the +2 charge state precursor of the peptide TLQQPQRAGpSDTFPDLNTS fragmented by CID. D, annotated spectrum from the +3 charge state precursor of the peptide ALKpSPLIKKNIQQA fragmented by ETD. The peptide mass information is given in supplemental Table S3, and the complete tables of assigned ions for each peptide are given in supplemental Fig. S4.
We also wondered whether proteases that cleave aliphatic residues might increase the coverage of membrane protein sequences. Out of all 3555 protein groups identified, 244 (6.9%) were predicted to have three or more transmembrane helices. Sequences from these proteins were preferentially enriched in the gained coverage, with increases of up to 350% for very hydrophobic sequences (Fig. 7). Peptides from MaLP digestion were the greatest individual contributor to these gains, as can be seen by the observation that the percent proteome coverage did not decrease with transmembrane helix content nearly as dramatically as for the other proteases (Fig. 7A). Because in-gel digestion is sometimes used to digest membrane proteins, we tested the suitability of WaLP and MaLP for in-gel digestion on glucose transporter 5 (UniProt accession number P22732). Trypsin digestion yielded 36% coverage, WaLP yielded 84% coverage, and MaLP yielded 50% coverage. The combination of data covered 88% of the target protein sequence. A plot of sequence coverage versus hydrophobicity shows that peptides from WaLP and MaLP digests are almost solely responsible for coverage of the transmembrane segments (Fig. 7C).
Fig. 7.
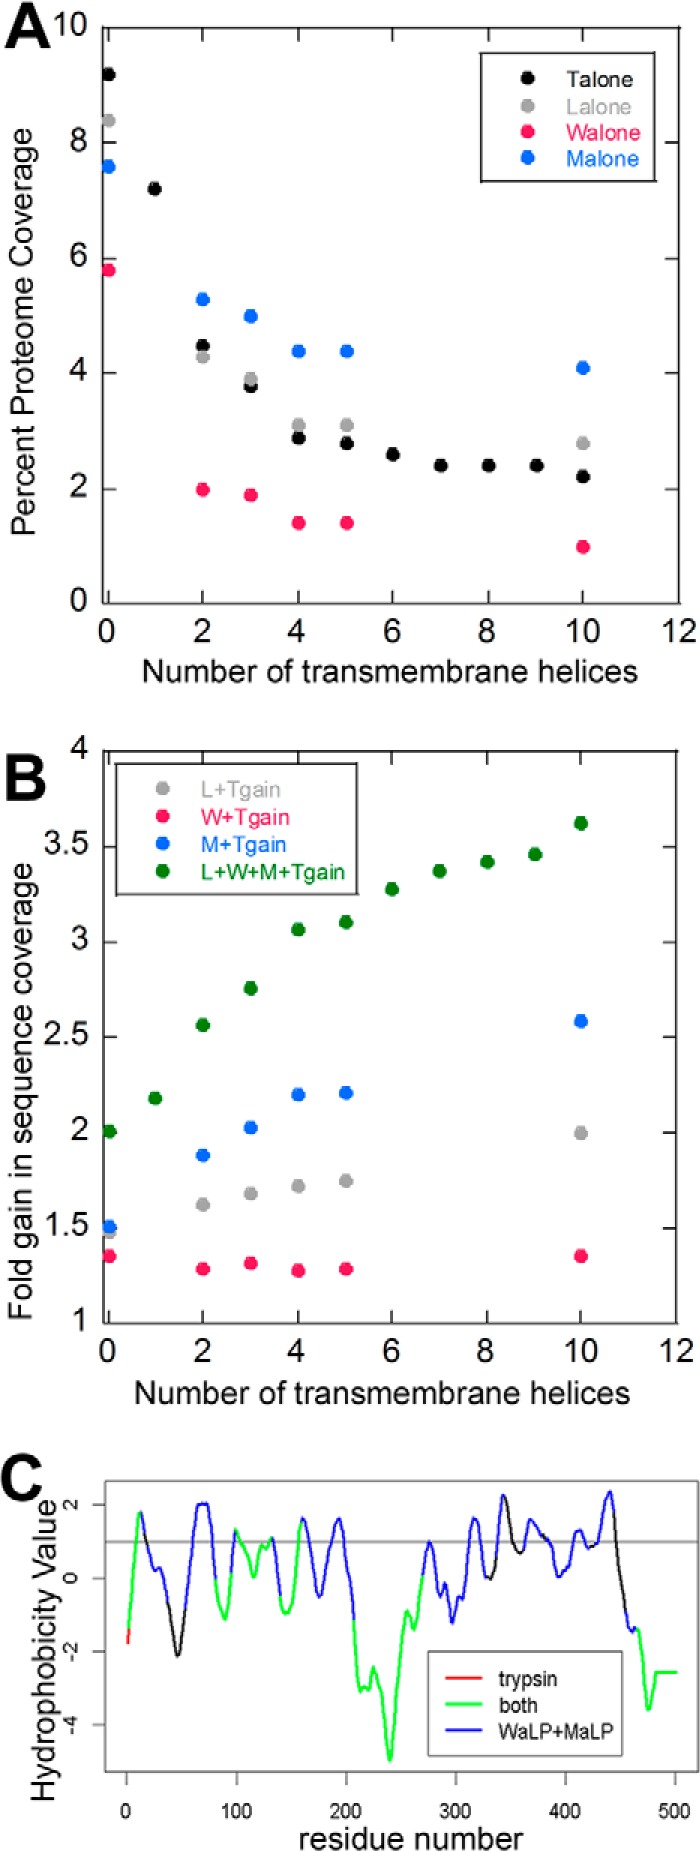
MaLP and WaLP improve membrane protein sequence coverage.
A, each protease digest dataset for trypsin  , LysC
  , WaLP
  , and MaLP
  was evaluated for the amount of protein sequence that was covered in relation to how many transmembrane helices were predicted to be in each protein. The data show that MaLP covered a greater amount of sequence that is predicted to be from proteins containing transmembrane helices. B, the fold gain of proteome coverage was evaluated for the trypsin dataset combined with Lys C , WaLP , MaLP , and all four datasets
  . For the four datasets combined, proteome coverage for proteins with at least four predicted transmembrane helices was increased more than 3-fold. C, plot of the hydrophobicity versus coverage of the glucose transporter-5 sequence when various combinations of proteases are used for the digestion. WaLP and MaLP cover the more hydrophobic regions, whereas trypsin does not.
DISCUSSION
The use of alternative proteases has the potential to expand proteome coverage, affording gains in PTM coverage as well as the identification of splice variants. In this work, we explored the utility of two proteases that have not been used for proteomics before, WaLP and MaLP. These proteases retain activity in harsh denaturing conditions. They improve the coverage of an in-gel digested protein. Combining data from WaLP, MaLP, trypsin, and LysC results in nearly 100% coverage of protein sequences in standard mixtures. Thus, WaLP and MaLP digestion will likely prove to be useful for increasing the coverage of protein sequences in proteomics, particularly when increased coverage is required for a targeted experiment or when appropriate tryptic cleavage sites are not present.
One possible advantage of WaLP and MaLP is that they cleave at aliphatic residues (A, V, T, and S for WaLP; L, F, and V for MaLP). Chymotrypsin, which cleaves after aromatic residues (F, Y, and W), has also been used to expand protein sequence coverage, but we could not find examples of chymotrypsin being used in studies of complex proteomes. WaLP and MaLP retain activity throughout long digestion times, whereas chymotrypsin does not, potentially making WaLP and MaLP better for improving coverage of proteins in complex proteome mixtures.
The fact that WaLP and MaLP cleave at nonpolar residues, however, presented some challenges when they were used in global proteomics experiments. The first challenge was their semi-specific substrate specificity. WaLP and MaLP were shown to cleave after several common nonpolar residues. Compared with termini from elastase digestion reported previously (V (36.5%), I (34.7%), T (30.3%), S (21.4%), L (19.5%), M (15.7%), and even H (9.1%)) (5), WaLP and MaLP (see “Results”) were more specific. This semi-specificity would be expected to generate many single amino acids and short peptides, which would not be useful in unique sequence determination for proteomics. Surprisingly, the average length of the peptides identified from digests with WaLP were the same as those from trypsin, and peptides from digestion by MaLP were slightly longer than those obtained with trypsin. Fig. 3 suggests that the substrate recognition preference of WaLP and MaLP extends beyond the P1 position, both before and after the position of cleavage, which is consistent with previous work showing that WaLP recognizes at least four amino acids past the position of cleavage (47). Thus, WaLP and MaLP target more residues for cleavage but apparently recognize a longer sequence motif.
Another challenge of the nonpolar substrate specificity of WaLP and MaLP is the yield of peptide fragment ions that are useful for sequence determination. WaLP and MaLP peptides yield a significantly lower abundance of y-ions (often scored the highest by database search algorithms). Whereas some 20,000 more MS/MS spectra were obtained from the WaLP digest in our ddDT experiment than with trypsin, some 2600 fewer peptides were matched to those spectra. This might partly be due to the need to search databases with “no enzyme” specificity. Indeed, searching tryptic digests with no enzyme for specificity results in 18,520 unique peptide identifications, compared with 21,035. The use of the merged spectra search capability in the MS-GFDB search engine did improve the number of identifications. However, it remains a puzzle why the number of peptides identified from the WaLP digest was lower. It is very encouraging that the number of peptides identified from the MaLP digest was significantly higher despite the lower percentage of y-ions. Because WaLP and MaLP don't cleave at K and R, the resultant peptides contain a higher percentage of these positively charged residues. Although this doesn't seem to have helped in the identification of WaLP peptides, the combination of the higher content of charged residues with the longer average length of the MaLP peptides might have improved the MS2 spectra enough to aid subsequent unambiguous peptide identification.
One striking feature of MaLP specificity is its ability to differentiate I and L, with MaLP preferring to cleave after L. This observation increases the utility of MaLP digestion, because differences between I and L cannot be resolved by mass alone. Another interesting result was that WaLP and MaLP digests avoided the residue-specific depletion of R and K from trypsin digestion (Fig. 5). Thus, WaLP and MaLP are likely to be extremely useful for proteomics analyses of K- and/or R-rich sequences.
Sequences identified from WaLP and MaLP digestion are highly complementary to sequences identified from trypsin and LysC digestions. In comparison with the results of Swaney et al., who doubled proteome coverage relative to trypsin using five separate digestions (4), we achieved double the sequence coverage from only four digestions. The additional coverage is, as expected, beneficial for more comprehensive PTM mapping studies. We show one such example in which two new serine phosphorylation sites were identified in MPD2, neither of which is on a peptide that would have been identified from trypsin digestion. Finally, the nonpolar substrate specificity of WaLP and, particularly, MaLP resulted in a dramatic increase (up to 350%) in the proteome coverage of proteins with transmembrane regions. The increase in proteome coverage from all four proteases relative to only trypsin was found to positively correlate with the minimum number of predicted transmembrane helices. Thus, we expect digestion with WaLP and MaLP will find use in comprehensive PTM-mapping studies and especially deeper proteomic analysis of membrane proteins.
Supplementary Material
Acknowledgments
We thank Dr. Paul Russell (TSRI) for providing S. pombe lysates, Dr. Dave Agard (UCSF) for providing the pALP12-M190A plasmid, and Dr. Sheila Jaswal (Amherst) for providing the Lysobacter enymogenesis. We thank Dr. Robert Chalkley and Dr. Katalin Medzihradszky (UCSF) for assistance in experimental design and data analysis and the UCSF Mass Spectrometry Facility (P41RR001614) for instrument time. John Schulze (UC-Davis) provided the amino acid analysis.
Footnotes
Author contributions: J.G.M., N.B., and E.A.K. designed research; J.G.M., D.M., and M.G. performed research; S.K. contributed new reagents or analytic tools; J.G.M. and E.A.K. analyzed data; J.G.M., N.B., and E.A.K. wrote the paper.
* J.G.M. was supported by the Interfaces Training Grant (T32EB009380). This work was supported by generous funding from the NSF (MCB1244506) to E.A.K. and by funding from the NIH (3-P41-GM103484) to N.B. The Proteome Coverage Summarizer software tool from Pacific Northwest National Laboratory (OMICS.PNNL.GOV) is gratefully acknowledged.
 This article contains supplemental material.
2 Kim, S. and Pevzner, P. A. unpublished.
1 The abbreviations used are:
- PTM
- post-translational modification
- WaLP
- wild-type α-lytic protease
- MaLP
- M190A α-lytic protease
- CID
- collision-induced dissociation
- ETD
- electron-transfer dissociation
- HCD
- higher-energy collisional dissociation
- FT
- Fourier transform
- ACN
- acetonitrile
- NEM
- N-ethyl maleimide
- FA
- formic acid
- SDC
- sodium deoxycholate
- ddDT
- data-dependent decision tree
- HPRP
- high-pH reverse-phase
- FDR
- false discovery rate
- TIC
- total ion current.
REFERENCES
- 1. Walther T. C., Mann M. (2010) Mass spectrometry-based proteomics in cell biology. J. Cell Biol. 190, 491–500 [DOI] [PMC free article] [PubMed] [Google Scholar]
- 2. de Godoy L. M. F., Olsen J. V., Cox J., Nielsen M. L., Hubner N. C., Frohlich F., Walther T. C., Mann M. (2008) Comprehensive mass-spectrometry-based proteome quantification of haploid versus diploid yeast. Nature 455, 1251–1254 [DOI] [PubMed] [Google Scholar]
- 3. Nagaraj N., Kulak N. A., Cox J., Neuhauser N., Mayr K., Hoerning O., Vorm O., Mann M. (2012) System-wide perturbation analysis with nearly complete coverage of the yeast proteome by single-shot ultra HPLC runs on a bench top orbitrap. Mol. Cell. Proteomics 11, M111.013722. [DOI] [PMC free article] [PubMed] [Google Scholar]
- 4. Swaney D. L., Wenger C. D., Coon J. J. (2010) Value of using multiple proteases for large-scale mass spectrometry-based proteomics. J. Proteome Res. 9, 1323–1329 [DOI] [PMC free article] [PubMed] [Google Scholar]
- 5. Wang B., Malik R., Nigg E. A., Kor̈ner R. (2008) Evaluation of the low-specificity protease elastase for large-scale phosphoproteome analysis. Anal. Chem. 80, 9526–9533 [DOI] [PubMed] [Google Scholar]
- 6. MacCoss M. J., McDonald W. H., Saraf A., Sadygov R., Clark J. M., Tasto J. J., Gould K. L., Wolters D., Washburn M., Weiss A., Clark J. I., Yates J. R. (2002) Shotgun identification of protein modifications from protein complexes and lens tissue. Proc. Natl. Acad. Sci. U.S.A. 99, 7900–7905 [DOI] [PMC free article] [PubMed] [Google Scholar]
- 7. Rietschel B., Arrey T. N., Meyer B., Bornemann S., Schuerken M., Karas M., Poetsch A. (2009) Elastase digests: new ammunition for shotgun membrane proteomics. Mol. Cell. Proteomics 8, 1029–1043 [DOI] [PMC free article] [PubMed] [Google Scholar]
- 8. Wiœniewski J. R., Duœ K., Mann M. (2012) Proteomic workflow for analysis of archival formalin fixed and paraffin embedded clinical samples to a depth of 10,000 proteins. Proteomics Clin. Appl. 7, 225–233 [DOI] [PubMed] [Google Scholar]
- 9. Wiœniewski J. R., Mann M. (2012) Consecutive proteolytic digestion in an enzyme reactor increases depth of proteomic and phosphoproteomic analysis. Anal. Chem. 84, 2631–2637 [DOI] [PubMed] [Google Scholar]
- 10. Silen J. L., Frank D., Fujishige A., Bone R., Agard D. A. (1989) Analysis of prepro-alpha-lytic protease expression in Escherichia coli reveals that the pro region is required for activity. J. Bacteriol. 171, 1320–1325 [DOI] [PMC free article] [PubMed] [Google Scholar]
- 11. Bone R., Silen J. L., Agard D. A. (1989) Structural plasticity broadens the specificity of an engineered protease. Nature 339, 191–195 [DOI] [PubMed] [Google Scholar]
- 12. Graham L. D., Haggett K. D., Jennings P. A., Le Brocque D. S., Whittaker R. G., Schober P. A. (1993) Random mutagenesis of the substrate-binding site of a serine protease can generate enzymes with increased activities and altered primary specificities. Biochemistry 32, 6250–6258 [DOI] [PubMed] [Google Scholar]
- 13. Sohl J. L., Jaswal S. S., Agard D. A. (1998) Unfolded conformations of [alpha]-lytic protease are more stable than its native state. Nature 395, 817–819 [DOI] [PubMed] [Google Scholar]
- 14. Jaswal S. S., Sohl J. L., Davis J. H., Agard D. A. (2002) Energetic landscape of [alpha]-lytic protease optimizes longevity through kinetic stability. Nature 415, 343–346 [DOI] [PubMed] [Google Scholar]
- 15. Gupta N., Bandeira N., Keich U., Pevzner P. A. (2011) Target-decoy approach and false discover rate: when things may go wrong. J. Am. Soc. Mass Spectrom. 22, 1111–1120 [DOI] [PMC free article] [PubMed] [Google Scholar]
- 16. Wysocki V. H., Tsaprailis G., Smith L. L., Breci L. A. (2000) Mobile and localized protons: a framework for understanding peptide dissociation. J. Mass Spectrom. 35, 1399–1406 [DOI] [PubMed] [Google Scholar]
- 17. Tabb D. L., Smith L. L., Breci L. A., Wysocki V. H., Lin D., Yates J. R. (2003) Statistical characterization of ion trap tandem mass spectra from doubly charged tryptic peptides. Anal. Chem. 75, 1155–1163 [DOI] [PMC free article] [PubMed] [Google Scholar]
- 18. Syka J. E. P., Coon J. J., Schroeder M. J., Shabanowitz J., Hunt D. F. (2004) Peptide and protein sequence analysis by electron transfer dissociation mass spectrometry. Proc. Natl. Acad. Sci. U.S.A. 101, 9528–9533 [DOI] [PMC free article] [PubMed] [Google Scholar]
- 19. Michalski A., Neuhauser N., Cox J., Mann M. (2012) A systematic investigation into the nature of tryptic HCD spectra. J. Proteome Res. 11, 5479–5491 [DOI] [PubMed] [Google Scholar]
- 20. Shen Y., Tolić N., Xie F., Zhao R., Purvine S. O., Schepmoes A. A., Moore R. J., Anderson G. A., Smith R. D. (2011) Effectiveness of CID, HCD, and ETD with FT MS/MS for degradomic-peptidomic analysis: comparison of peptide identification methods. J. Proteome Res. 10, 3929–3943 [DOI] [PMC free article] [PubMed] [Google Scholar]
- 21. Kim S., Mischerikow N., Bandeira N., Navarro J. D., Wich L., Mohammed S., Heck A. J. R., Pevzner P. A. (2010) The generating function of CID, ETD and CID/ETD pairs of tandem mass spectra: applications to database search. Mol. Cell. Proteomics 9, 2840–2852 [DOI] [PMC free article] [PubMed] [Google Scholar]
- 22. Guthals A., Klauser K., Frank A. M., Bandeira N. (2013) Sequencing-grade de novo analysis of MS/MS triplets (CID/HCD/ETD) from overlapping peptides. J. Proteome Res. 12, 2846–2857 [DOI] [PMC free article] [PubMed] [Google Scholar]
- 23. Mace J. E., Wilk B. J., Agard D. A. (1995) Functional linkage between the active site of α-lytic protease and distant regions of structure: scanning alanine mutagenesis of a surface loop affects activity and substrate specificity. J. Mol. Biol. 251, 116–134 [DOI] [PubMed] [Google Scholar]
- 24. Mace J. E., Agard D. A. (1995) Kinetic and structural characterization of mutations of glycine 216 in alpha-lytic protease: a new target for engineering substrate specificity. J. Mol. Biol. 254, 720–736 [DOI] [PubMed] [Google Scholar]
- 25. von der Haar T. (2007) Optimized protein extraction for quantitative proteomics of yeasts. PLoS One 2, e1078. [DOI] [PMC free article] [PubMed] [Google Scholar]
- 26. Masuda T., Saito N., Tomita M., Ishihama Y. (2009) Unbiased quantitation of Escherichia coli membrane proteome using phase transfer surfactants. Mol. Cell. Proteomics 8, 2770–2777 [DOI] [PMC free article] [PubMed] [Google Scholar]
- 27. Masuda T., Tomita M., Ishihama Y. (2008) Phase transfer surfactant-aided trypsin digestion for membrane proteome analysis. J. Proteome Res. 7, 731–740 [DOI] [PubMed] [Google Scholar]
- 28. Swaney D. L., McAlister G. C., Coon J. J. (2008) Decision tree-driven tandem mass spectrometry for shotgun proteomics. Nat. Methods 5, 959–964 [DOI] [PMC free article] [PubMed] [Google Scholar]
- 29. Wang Y., Feng Y., Gritsenko M. A., Wang Y., Clauss T., Liu T., Shen Y., Monroe M. E., Lopez-Ferrer D., Reno T., Moore R. J., Klemke R. L., Camp D. G., II, Smith R. D. (2011) Reversed-phase chromatography with multiple fraction concatenation strategy for proteome profiling of human MCF10A vells. Proteomics 11, 2019–2026 [DOI] [PMC free article] [PubMed] [Google Scholar]
- 30. Kessner D., Chambers M., Burke R., Agus D., Mallick P. (2008) ProteoWizard: open source software for rapid proteomics tools development. Bioinformatics 24, 2534–2536 [DOI] [PMC free article] [PubMed] [Google Scholar]
- 31. Keller A., Eng J., Zhang N., Li X., Aebersold R. (2005) A uniform proteomics MS/MS analysis platform utilizing open XML file formats. Mol. Syst. Biol. 1, 2005.0017. [DOI] [PMC free article] [PubMed] [Google Scholar]
- 32. Kim S., Gupta N., Pevzner P. A. (2008) Spectral probabilities and generating functions of tandem mass spectra: a strike against decoy databases. J. Proteome Res. 7, 3354–3363 [DOI] [PMC free article] [PubMed] [Google Scholar]
- 33. Guthals A., Bandeira N. (2012) Peptide identification by tandem mass spectrometry with alternate fragmentation modes. Mol. Cell. Proteomics 11, 550–557 [DOI] [PMC free article] [PubMed] [Google Scholar]
- 34. Keller A., Nesvizhskii A. I., Kolker E., Aebersold R. (2002) Empirical statistical model to estimate the accuracy of peptide identifications made by MS/MS and database search. Anal. Chem. 74, 5383–5392 [DOI] [PubMed] [Google Scholar]
- 35. Nesvizhskii A. I., Keller A., Kolker E., Aebersold R. (2003) A statistical model for identifying proteins by tandem mass spectrometry. Anal. Chem. 75, 4646–4658 [DOI] [PubMed] [Google Scholar]
- 36. R Development Core Team (2011) R: A Language and Environment for Statistical Computing. R Foundation for Statistical Computing, Vienna, Austria: ISBN 3-900051-07-0, URL http://www.R-project.org/ [Google Scholar]
- 37. Krogh A., Larsson B., von Heijne G., Sonnhammer E. L. L. (2001) Predicting transmembrane protein topology with a Hidden Markov Model: application to complete genomes. J. Mol. Biol. 305, 567–580 [DOI] [PubMed] [Google Scholar]
- 38. Colaert N., Helsens K., Martens L., Vandekerckhove J., Gevaert K. (2009) Improved visualization of protein consensus sequences by iceLogo. Nat. Methods 6, 786–787 [DOI] [PubMed] [Google Scholar]
- 39. Baker D., Sohl J. L., Agard D. A. (1992) A protein-folding reaction under kinetic control. Nature 356, 263–265 [DOI] [PubMed] [Google Scholar]
- 40. Sleno L., Volmer D. A. (2004) Ion activation methods for tandem mass spectrometry. J. Mass Spectrom. 39, 1091–1112 [DOI] [PubMed] [Google Scholar]
- 41. Olsen J. V., Schwartz J. C., Griep-Raming J., Nielsen M. L., Damoc E., Denisov E., Lange O. (2009) A dual pressure linear ion trap Orbitrap instrument with very high sequencing speed. Mol. Cell. Proteomics 8, 2759–2769 [DOI] [PMC free article] [PubMed] [Google Scholar]
- 42. Elias J. E., Gibbons F. D., King O. D., Roth F. P., Gygi S. P. (2004) Intensity-based protein identification by machine learning from a library of tandem mass spectra. Nat. Biotechnol. 22, 214–219 [DOI] [PubMed] [Google Scholar]
- 43. Huang Y., Triscari J. M., Tseng G. C., Pasa-Tolic L., Lipton M. S., Smith R. D., Wysocki V. H. (2005) Statistical characterization of the charge state and residue dependence of low-energy CID peptide dissociation patterns. Anal. Chem. 77, 5800–5813 [DOI] [PMC free article] [PubMed] [Google Scholar]
- 44. Meyer J. G., Komives E. A. (2012) Charge state coalescence during electrospray ionization improves peptide identification by tandem mass spectrometry. J. Am. Soc. Mass Spectrom. 23, 1390–1399 [DOI] [PMC free article] [PubMed] [Google Scholar]
- 45. Tabb D. L., Huang Y., Wysocki V. H., Yates J. R. (2004) Influence of basic residue content on fragment ion peak intensities in low-energy collision-induced dissociation spectra of peptides. Anal. Chem. 76, 1243–1248 [DOI] [PMC free article] [PubMed] [Google Scholar]
- 46. Chalkley R. J., Clauser K. R. (2012) Modification site localization scoring: strategies and performance. Mol. Cell. Proteomics 11, 3–14 [DOI] [PMC free article] [PubMed] [Google Scholar]
- 47. Schellenberger V., Turck C. W., Rutter W. J. (1994) Role of the S' subsites in serine protease catalysis. Active-site mapping of rat chymotrypsin, rat trypsin, alpha-lytic protease, and cercarial protease from Schistosoma mansoni. Biochemistry 33, 4251–4257 [DOI] [PubMed] [Google Scholar]
Associated Data
This section collects any data citations, data availability statements, or supplementary materials included in this article.