

Abstract
Adoption of targeted mass spectrometry (MS) approaches such as multiple reaction monitoring (MRM) to study biological and biomedical questions is well underway in the proteomics community. Successful application depends on the ability to generate reliable assays that uniquely and confidently identify target peptides in a sample. Unfortunately, there is a wide range of criteria being applied to say that an assay has been successfully developed. There is no consensus on what criteria are acceptable and little understanding of the impact of variable criteria on the quality of the results generated. Publications describing targeted MS assays for peptides frequently do not contain sufficient information for readers to establish confidence that the tests work as intended or to be able to apply the tests described in their own labs. Guidance must be developed so that targeted MS assays with established performance can be made widely distributed and applied by many labs worldwide. To begin to address the problems and their solutions, a workshop was held at the National Institutes of Health with representatives from the multiple communities developing and employing targeted MS assays. Participants discussed the analytical goals of their experiments and the experimental evidence needed to establish that the assays they develop work as intended and are achieving the required levels of performance. Using this “fit-for-purpose” approach, the group defined three tiers of assays distinguished by their performance and extent of analytical characterization. Computational and statistical tools useful for the analysis of targeted MS results were described. Participants also detailed the information that authors need to provide in their manuscripts to enable reviewers and readers to clearly understand what procedures were performed and to evaluate the reliability of the peptide or protein quantification measurements reported. This paper presents a summary of the meeting and recommendations.
Targeted mass spectrometry (MS) approaches have tremendous promise for specific, reproducible and quantitative measurement of changes in the levels of proteins, peptides, and modified peptides of interest to biologists and biomedical researchers (1–3 and references therein). Adoption of targeted MS to study biological and clinical questions is well underway in the biomedical community with the assumption being that the measurements made using targeted MS methods are reliable, that is that they specifically identify and quantify the analytes targeted in a sample. In the field of proteomics, umbrella terms like “multiple reaction monitoring”, “selected reaction monitoring” (MRM1 and SRM, respectively; terms used interchangeably), “absolute quantification” and “targeted MS” can convey the erroneous message that the results are unquestionably correct with respect to what is being detected and how much is present. This is certainly not true, and is dependent on the extent to which the measurements have been analytically validated.
The most widely used targeted MS approach at present is MRM (1–3). Unlike discovery proteomics experiments in which full-scan MS/MS spectra are collected, in MRM only three to five fragment ions per-precursor are monitored, typically on triple quadrupole MS systems, the most widely available MS instruments in clinical and drug metabolism laboratories. The fragment ions monitored are generally those that are most abundant rather than those that are most sequence informative; as a result there is little-to-no sequence information in MRM data. Furthermore, in complex matrices like plasma, tissue or cell lysates, peptides with the same or similar precursor mass-to-charge ratio (e.g. ±1.5 in m/z) to an analyte of interest can give rise to many and sometimes all of the three to five fragment ions monitored for a specific analyte, resulting in false positives. Therefore, it is essential that other information be used to increase confidence in assignment and quantification in targeted MS experiments.
In contrast to the long and well developed history of MS-based assay development for small molecules, drugs and metabolites (3–10), consensus on what performance criteria are essential to define for peptide and protein assay development has yet to be achieved. This has led to a range of problems that continue to plague the development of reliable proteomic assays for both clinical and biological studies. For example, currently, a wide range of criteria are being applied in the proteomics community to assert that an assay has been successfully developed and that analytes of interest are being confidently detected and changes in their levels reliably quantified. Proteomics scientists are only slowly implementing practices in targeted, quantitative assay development that have been learned and adopted by the small molecule community (11–13). Equally troubling is that targeted-MS papers are being published without clear and complete documentation of the analytical methods used or the assay performance, making it difficult if not impossible for reviewers and readers to have confidence that the tests work as intended to apply the tests described in their own labs with an expectation that similar results can be achieved. Therefore, we assert that strong, consensus guidance must be developed addressing quality assay development, if targeted proteomics is going to have the impact we all desire it to have, providing accurate, reliable assays of known performance metrics that can be widely distributed and applied by many labs worldwide.
To begin to address the problems and their solutions, a workshop was held June 18 and 19, 2013 at the National Institutes of Health under the auspices of the National Cancer Institute (CPTAC - Clinical Proteomic Tumor Analysis Consortium) and National Heart, Lung, and Blood Institute (Proteomics Centers). Representatives from the multiple communities developing and employing targeted assays were present, including in vitro diagnostic companies, clinical laboratories, labs specializing in quantitative assay development for candidate biomarker verification and biology-focused labs. Investigators with long experience in the application of targeted MS methods for quantification of small molecules were invited to provide a review of the decades of practice and application of MRM in small molecule quantification, providing a foundation to principles that are equally applicable to the proteomic applications under discussion.
Speakers and participants were asked to use a “fit-for-purpose” approach by identifying the analytical goals of their experiments and then to describe the performance characteristics required for success (14–19). Based on the goals of the measurements, we next sought to identify the experimental evidence (i.e. the “analytical validation” steps) needed to establish that the assays reported are working as intended and are achieving the required levels of performance (including the test's repeatability, reproducibility, limits of detection, analytical specificity, etc.). Computational and statistical tools useful for the analysis of targeted MS results, including generation of response/calibration curves, determination of limits of detection and quantification (LOD and LOQ, respectively), were discussed. This process led to the identification of three “Tiers” of assays/measurements that are described in detail, below.
Participants were also asked to identify what information authors need to provide in their manuscripts to enable reviewers and readers to clearly understand what procedures were performed and to evaluate the reliability of the peptide or protein quantification measurements reported. We present a summary of those recommendations, below. As follow-on to the workshop and this report, Molecular and Cellular Proteomics intends to develop guidelines for authors of papers describing development and/or application of targeted MS methods. The need for establishing guidelines for authors parallels the situation in discovery proteomics before 2004 when similar issues relating to lack of ability to ascertain reliability of published results prompted the journal Molecular and Cellular Proteomics to develop and adopt the first set of guidelines for publication of peptide and protein identification data using mass spectrometry (20). These guidelines, which have been repeatedly revised and updated over the past several years (21–23), have been embraced in whole or in part by other proteomics journals. The goal then, as it is now, was to try to ensure that reliable, high quality data and results are entering the proteomics literature.
The Three Tiers of Targeted MS Measurements
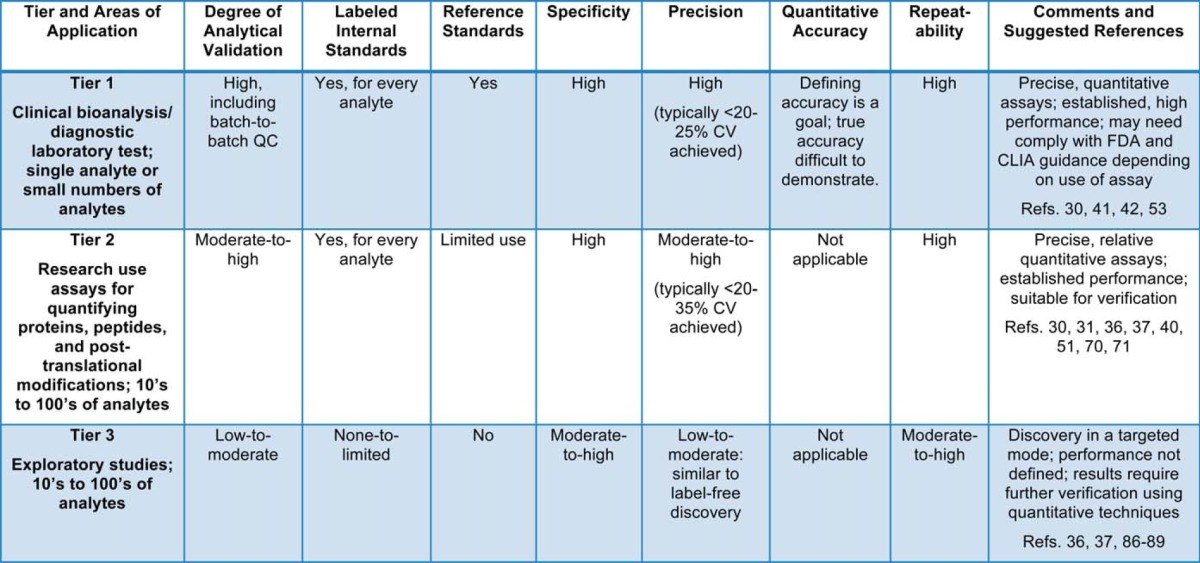
The group identified three tiers of targeted MS assays/measurements based on the intended purpose of the measurements (“fit for purpose” concept) and then worked to define the extent of analytical validation required in each Tier (Table I). A list of speakers, presentations, and discussion groups is available in supplemental Materials.
Table I. Three Tiers of Targeted MS Measurements; experimental design parameters and assay characteristics are listed for each tier.
Tier 1
Andy Hoofnagle, University of Washington and Russell Grant, Laboratory Corporation of America led the discussion around Tier 1. The goals of developing and applying Tier 1 assays are to (1) provide accurate, precise, clinically actionable information for medical practitioners or (2) inform decision-making in the development of drugs for human use. In pharmaceutical applications the goals include quantifying proteins targeted by therapeutics, assessment of target engagement (free, complex, total) in preclinical and proof of concept studies, and measurement of mechanistic, protein biomarkers that are proximal to the target/site of action to examine pharmacodynamics. Depending on the use of the assay data, these tests may need to meet the requirements of the Clinical Laboratory Improvement Amendments of 1988 (CLIA), the US Food and Drug Administration (FDA), or the European Medicines Agency (EMA) (for example, see 24, 25). Guidance from these agencies and accrediting organizations, as well as those from the Clinical and Laboratory Standards Institute (http://www.clsi.org) continues to evolve and be clarified, especially for newer approaches in protein analysis, like targeted MS. These changes and clarifications are driven, in part, through dialog and interaction among the pharmaceutical, diagnostic companies, and regulatory agencies all working to improve assay quality when it pertains, even indirectly, to the care of patients (for example, see 26). The goal is to provide complete, high-quality data for review for regulatory purposes.
The use of stable isotope-labeled internal standards provides the highest level of detection confidence and measurement precision in targeted MS experiments (26–42). This approach, adopted from the field of small molecule quantitative analysis, is known as Stable Isotope Dilution (43, 44). In Tier 1, best practice would dictate the use of stable isotope-labeled internal standards for each target analyte. Labeled analog proteins can also be used as internal standards if properly characterized and validated. Internal standards are ideally included to control for the fate of analytes through the analytical process, which enables more precise quantification. Assay precision can be strongly affected by variations in sample processing, especially by the enzymatic digestion conditions used (31, 45, 46). Good precision can only be obtained when these conditions are carried out reproducibly. Peptide concentrations are derived by measurement of the peak area ratios of one or more of the fragment ions from the labeled internal standard and the endogenous peptide. Stable isotope-labeled peptides provide this added measure of confidence as they (1) co-elute with the targeted analytes, (2) fragment to yield the corresponding, mass-shifted peptide backbone fragment ions, (3) have (in the absence of interference) identical relative abundances of the fragment ions as the endogenous peptide, and (4) compensate for ion suppression and poor spray stability (47–51). Ion suppression is an insidious problem caused by other matrix components (lipids and other small molecules, peptides, salts, etc.) that co-elute and compete with the analyte of interest for ionization. Ion suppression results in a decrease in the ion current detected for the same amount of analyte analyzed from different samples. Ideally, the internal standard has the same structure as the analyte and co-elutes with the analyte, thereby experiencing the same matrix-induced suppressive effects as the analyte. So while the sensitivity (ion counts) for detection of analyte and internal standard both decrease as a result of suppression, the ratio of analyte to internal labeled standard (provided the signals for both are well above the noise) is unaffected. This is a key point, as quantification is based on measurement of the observed ratios using precursor-product ion pairs (called transitions) that have been shown to be free of interference. Although monitoring of three or more transitions is standard practice, only one of the transitions need be used for quantification (provided it is interference-free), while the other monitored ions are used for confirmation of identity and to detect interferences. It is also acceptable to sum all monitored transitions for quantification provided none have significant interference and have signals that are well above the noise.
Accurate quantification is generally a goal of Tier 1 assays. Quantification with labeled tryptic peptide standards alone provides high measurement precision, but not accuracy for quantifying proteins, because the standards do not account for differences in proteolytic cleavage efficiency (variable depending on peptide/protein, and often much less than 100%), nor are these standards subject to all of the sample preparation and cleanup steps as the peptides derived from the proteins (31, 43, 51). Labeled proteins, when available, or “extended peptides” or “winged-peptides” having 2–6 amino acids of native flanking sequence at the N- and C termini of the tryptic peptide analyte can be added at the start of sample processing to serve as more robust internal standards for normalization and move closer to precise and accurate quantification (42, 46, 52–55). However, it is important to note that the use of even a labeled recombinant protein standard does not guarantee measurement accuracy. Establishing how accurate an assay is requires considerable additional work, including constructing calibration curves and demonstration of spike-recovery within an accepted tolerance in a closely matched matrix with a protein standard that is as identical as possible to the native protein analyte present in the sample. Equivalency of behavior of the surrogate protein to that of the native protein analyte must be demonstrated to provide confidence that the assay is accurate. These requirements pertain whether the assay is MS-based or a conventional immunoassay (17). For MS-based assays the availability and use of a uniformly isotope-labeled internal standard protein to control for digestion and other matrix-associated issues is also required. In many, if not most cases, this ideal scenario cannot be achieved due to lack of the necessary reagents. So, while assays can be made repeatable and reproducible, true accuracy will often remain an elusive goal even for Tier 1 assays.
The results of an analytically demanding series of experiments, carried out using well-defined sets of acceptance criteria, need to be presented to regulatory agencies and in publications to enable the quality of the assay to be assessed. In addition to identifying the analytes being targeted (an obvious and common feature to all three Tiers), the specific matrix in which the measurements are to be made must be defined as the assay may not be acceptable for use in an alternate matrix type. Multiple assay validation criteria are typically applied to build required confidence and acceptability of the assays, and include measurements of assay precision, accuracy, specificity, analytical sensitivity, including LOD, limit of the blank (LOB), and lower limit of quantification (LLOQ), linearity, and parallelism (24–26). Response curves and calibration curves (as described above) are generated for each analyte in the relevant matrices to establish these performance metrics. Testing for the presence of interferences is carefully evaluated in the presence of hemolysis, jaundice, lipemia, etc. using different sources of the preferred matrix (e.g. plasma from different individuals or patients), alternate sample types (serum and plasma), alternate counter ions in sample collection (K2 EDTA and Li Heparin plasma etc.), using multiple reference standards, via transition ratio monitoring of multiple transitions per peptide. The purity of the internal standards and calibrator materials used must be established, generally by liquid chromatography and amino acid analysis (AAA). The influence of various analytical variables such as source of enzyme, duration of digestion, etc. on assay performance is evaluated, as is carryover from injection-to-injection. Most of these parameters, as well as overall LC-MS instrument performance, are evaluated on a within-day and day-to-day and week-to-week level to assess stability of assay performance. Guidance documents on each aspect of the process are available from the CLSI (http://www.clsi.org). Furthermore, quality control samples with known or previously measured analyte concentration are typically analyzed alongside the samples to ascertain assay performance during routine use. Beyond establishing assay performance, evidence of clinical utility must also be provided for assays used in the diagnostics area. For examples illustrating development of Tier 1 assays, see references 30, 41, 42, 53.
Tier 2
Brad Ackerman, Eli Lilly, and Susan Abbatiello, Broad Institute led the discussion of goals and requirements for Tier 2 assays. Tier 2 assays are developed to measure changes in the expression levels of proteins, peptides, and modifications such as phosphorylation resulting from perturbations such as drug treatment and disease for nonclinical purposes (28–43, 46, 51–54, 61). Samples may be model systems such as cell lines or non-human animals or patient-derived materials including tissues and biofluids where the goals are to measure proteins or modified peptides (e.g. phospho-, methyl-, acetyl-, or ubiquitinated peptides) related to growth, development, genetic or chemical perturbation for biological studies. Another major focus of Tier 2 assays is to reduce an initial list of candidate biomarker proteins derived from discovery experiments to the subset that truly reflects disease presence, stage or response (31, 35–44, 52–58). Accomplishing this generally requires transitioning to a much more precise, reproducible, quantitative and higher throughput approach than was used in discovery—namely MRM and related targeted MS methods (e.g. parallel reaction monitoring (59))—and applying that approach to measure a defined set of analytes in a much larger, and independent set of samples than was used in discovery. This step in the biomarker discovery process is called “Verification” (1, 43). In the case of biomarker studies, particular attention needs to be paid to statistical experimental design, and to use randomization, replication and blocking to avoid introduction of systematic biases and maximize the ability of the experiment to detect true quantitative changes between groups (60).
Tier 2 assays need to have high selectivity, high repeatability and sufficient reproducibility and sensitivity to detect and quantify the analytes targeted and to enable assays to be standardized across laboratories, (Table I). Characterization of the analytical performance must be rigorous to establish that the above criteria are met, to facilitate transfer and implementation across laboratories and to help enable possible translation of a subset of these assays that may have value clinical relevance into Tier 1 assays. In contrast to Tier 1 assays where extremely well characterized and analytically validated assays are constructed to measure a few analytes of known interest to clinicians and drug developers across hundreds to thousands of samples, the analytes that are being analyzed in experiments using Tier 2 assays are often much less well characterized, deriving from literature, discovery proteomics or transcriptional profiling experiments and may have little or no prior established association with treatment or disease. Tier 2 assays are frequently highly multiplexed, targeting many tens to hundreds of analytes in a single assay.
Neither regulatory agencies nor journals have provided guidance for analytical validation requirements of Tier 2 assays, but there was near consensus among the participants on what those requirements should be, and the need for authors to define the steps and practices used to establish the performance of their assays. The requirements for analytical validation of Tier 2 assays mirror those of Tier 1 beginning with the minimum requirement that stable isotope-labeled internal standard peptides for each and every analyte peptide be used. In addition to stable isotope-labeled tryptic peptides, labeled concatamer peptides (61), “wing” peptides, other extended sequences or full-length proteins (as described above) can also be used to improve precision, if available (42, 46, 52–55). The rationale for the use of labeled internal standards is the same as for Tier 1, specifically to provide confidence in the identity of each analyte monitored, to improve measurement precision, and to help compensate for suppression effects.
Unlike Tier 1 assays, the goal of Tier 2 assays is not necessarily to provide actual concentrations at the peptide or protein level. Instead, Tier 2 MRM assays may also be used to precisely and consistently measure relative changes in the levels of large numbers of targeted analytes across samples. For relative quantification of analytes using Tier 2 assays, the need for highly purified peptides of known quantity can be relaxed if properly validated, thereby reducing the cost for labeled peptide synthesis that is primarily driven by the cost of purification and amino acid analysis. However, use of unpurified peptides will compromise the ability to determine the LOD and LOQ of the assay. Unpurified peptides must still be analyzed with LC-MS, LC-UV, and/or MALDI-TOF-MS to demonstrate that the correct sequence has been synthesized and that the desired product is the dominant species.
As with Tier 1 assays, multiple assay validation steps are undertaken to build required confidence and acceptance of the assays (Table 1). These include the generation of response or calibration curves for each analyte in the relevant matrices and testing for the presence of interferences in multiple sources or multiple distinct pools of the matrix (e.g. biological replicates using different cultures of the same cell line(s) or pools of cell lines mixed in differing proportions). These experiments are typically performed in a minimum of full process (not technical) triplicate to measure reproducibility. Analytical validation of Tier 2 also includes measurement of assay precision, definition of the linear range and, when purified and quantified labeled reference peptides are used, determination of the LOD and LLOQ. A number of acceptable statistical methods exist for establishing these metrics for example, see 62–65, and it is more important that the developers of these assays state exactly what they did rather than used a prescribed method. The presence of high endogenous levels of analyte makes determination of LLOQ difficult. Established practice has been to use a similar matrix from an alternative species. Alternatively, so-called “reverse” curves run in the correct matrix may be used. In this approach, light peptide is added at a fixed amount while varying the amount of heavy peptide in response curves (66–68). Within-day and day-to-day variability are also measured to assess stability of assay performance over the time required to complete the measurements of analyte. Overall LC-MS instrument performance should also be assessed before, during and after sets of analyses using a system suitability check to ensure adequate and sustained performance of the analysis platform (69). How quantitation was performed and which transition or transitions for each analyte were used must be clearly described. In contrast to Tier 1, multiple distinct reference standards for each analyte are not required. Examples illustrating development of Tier 2 assays can be found in references 30, 31, 36, 37, 40, 51, 70, 71.
Tier 3
Bruno Domon, Luxembourg Clinical Proteomics Center, and Ruth Huttenhain, UCSF (formerly ETH, Zurich) led the discussion of goals and requirements for Tier 3 measurements. Tier 3 measurements, while still using targeted MS approaches, are clearly distinguished from Tier 1 and 2 by the absence of use of labeled internal standards for each analyte targeted. As a result, Tier 3 measurements are best suited for comparative, semi-quantitative measurements of proteins, protein forms, or peptides in biological systems. Absence of internal standards for each analyte requires the use of additional chromatographic and mass spectrometric information to establish confidence in the identification and measurement of the analytes being targeted. The layers of evidence that are presently being used are described in more detail, below. When all available information about the peptides targeted is appropriately used, Tier 3 measurements are robust and powerful, representing a more refined higher throughput way to do what amounts to label-free, semi-quantitative discovery but with much better repeatability for target detection and measurement (36, 37). However, the absence of internal standards can diminish confidence in the identity of what is being measure and semi-quantified, and suppression effects cannot be accounted for which limits measurement accuracy and precision, enabling only rough estimations of changes in abundance for the same reasons that it is limited in the case of label-free discovery experiments (see 72 and references therein). Run-to-run variation in the performance of the LC-MS system can accounted for by monitoring for variation in the MS signal of spiked reference peptides or proteins known not be present endogenously in the samples analyzed (e.g. sequence unique E. coli peptide or protein spiked into a mammalian matrix, (87)), but such reference materials do not compensate for the analyte-specific effects described above. Tier 3 measurements cannot be considered as truly quantitative, and, as with discovery proteomics experiments, observations from such measurements will generally require additional studies to verify the findings.
Analytical validation as carried out for Tier 1 and 2 assays, above, is not possible for Tier 3 targeted MS measurements. Instead, confidence in the reliability of analyte identification and quantification is built up through increasing layers of evidence including (1) complete co-elution or overlap of the entire set of monitored fragment ions for each analyte helps to establish that they come from the same species and not from different but nearly co-eluting analytes; (2) agreement of the m/z and relative ratios of precursor and fragment ions for the analyte measured compared with those of an authentic standard spectrum of each analyte; (3) correlation of the observed retention of the analyte to the predicted or previously observed retention of an authentic peptide; and (4) repeatability of the results across multiple biological or full process replicates. Absence of one or more of these layers greatly decreases reliability of the results. To fulfill criteria 2, above, reference relative ion abundance measurements from MS/MS spectra or from chromatogram libraries (both referred to as spectra, below) are needed for all targeted analytes to establish what fragment ions are produced and must be observed to confidently state that a specific analyte has been detected. Identification confidence improves with increasing mass accuracy and resolution for precursor and product ions, and with the number of fragment ions monitored and compared with reference spectra. Instruments with high resolution, accurate mass capabilities are beginning to be used for quantitative experiments (MRM-like) and the accurate mass measurement of the precursor and the fragments significantly improves the confidence of the analyses (73, 74). Reference spectra can be obtained from prior discovery experiments stored in public data repositories such as GPM (75), PeptideAtlas (76), PRIDE (77) and collections of curated MS/MS spectra such as SRMAtlas (78, 79). However, it is important to bear in mind that differences in fragmentation methods (e.g. collisional excitation versus resonance excitation) and collision energies used can have a significant effect on the relative ratios of peptide fragments, preventing use of ratio-matching as a criterion for identification. Therefore, the best reference spectra will derive from discovery proteomics experiments or analyses of unlabeled synthetic peptide standards on the same LC-MS platform and under the exact same analysis conditions as the samples to be analyzed. Increasingly, data-independent methods are being used for Tier 3 analyses (80–84). These experiments are done using m/z selection windows for fragmentation that are 4–25 Da in width, resulting in highly complex, overlapping MS/MS spectra. These properties severely limit the use of standard sequence assignment software to establish identity, again requiring the availability of reference spectra for identification.
Addition of a retention time standard to each sample enables correlation of peptide retention times across experiments and/or obtained under differing chromatographic conditions including differing columns, gradients, temperatures and flow rates (85). Use of retention times normalized to standard peptides provides much higher confidence in the identities of analytes measured, especially when labeled peptide standards for each analyte are not used, especially when more highly multiplexed analyses are carried out with relatively narrow RT windows. Other methods employing positive identification and retention time alignment may also be used to increase confidence in measuring target peptides.
A few examples illustrating development and application of Tier 3 measurements can be found in references 86–89. In addition, several published studies have used Tier 3 measurements to help select targets from discovery proteomics studies for Tier 2 assay development (for example, see 36, 37).
Tools and Software for Analytical Validation, Analysis and Storage of MRM Data
Useful open source tools for the analysis of MRM data have recently been reviewed (90, 91), and new tools are being introduced at a rapid pace. Such tools are needed to reduce the need for labor-intensive and error-prone review of increasingly massive amounts of targeted MS data, and to achieve high quality, reproducible data analysis results within and across laboratories. Olga Vitek, Purdue University, DR Mani, Broad Institute, and Lukas Reiter, Biognosys led the discussion of statistical data analysis approaches and Eric Deutsch, Institute for Systems Biology and Brendan MacLean, University of Washington led a discussion of software tools for assay development and data-basing. The goal of these presentations was to describe the methods and tools that are being actively used in each Tier rather than to recommend one specific tool over another. Many separate software packages exist that facilitate assay development, analytical assay validation, data export, peak integration, data quality assessment, biostatistical analysis, and project management. Software specific to each vendor's instrument is provided as part of the instruments data analysis software. Proprietary second-party tools for data analysis, reduction and storage are also available for targeted MS data (examples include Indigo Biosystems (http://www.indigobio.com/) and Data Innovations (http://www.datainnovations.com/). These tools are most often used by clinical and diagnostic laboratories that generate very large volumes of data requiring high analysis reliability and data security. The FDA has also developed guidance for testing and validation of software used to design, develop, or manufacture medical devices (92). Increasingly powerful, highly flexible and more readily adaptable vendor-neutral software is now also widely available. These packages, such as mProphet (50) (http://www.mprophet.org/) and Skyline (93, https://skyline.gs.washington.edu/labkey/project/home/software/Skyline/begin.view), are being continually updated and optimized through user feedback and adaptation. The interested reader is referred the references and the websites cited for details as to what each tool does.
Skyline is a vendor-neutral tool for MRM assay development and data collection that accomplishes peptide and transition selection, collision energy optimization, method export, peak detection and peak integration. The majority of workshop participants indicated that they are active users of Skyline. Vendor-specific software also provide the above functionality, and the vendors have each made an effort to have the data acquired on that platform and the tools provided for analysis work together as efficiently and seamless as possible (e.g. MassHunter from Agilent; MultiQuant from Sciex; Pinpoint from Thermo). Skyline (with its related package called Panorama), aims to integrate and make seamless the entire workflow for assay development, data acquisition and data analysis overall. At present, no single package from either a vendor or open source accomplishes all required tasks for all analysis Tiers, so multiple packages need to be used.
Statistical data analysis using non-vendor supplied tools has, until recently, required the use of multiple tools including commercial products like JMP, SAS, Excel and/or open source tools like R to determine coefficient of variation (CV), regression slope and intercept (with confidence intervals), interference detection, and LOD and LOQ and to visualize the results in various plots. AuDIT (49, 65), QuaSAR (94), and MSstats (an R package that extends the previously developed package SRMStats (95)) are recently developed open source tools that simplify and streamline these tasks. Both QuaSAR and SRMStats are available as external tools within Skyline (https://skyline.gs.washington.edu/labkey/project/home/software/Skyline/begin.view). Useful tools for label-free measurements used in Tier 3 include mProphet (50), Skyline, and SRMStats. The program mProphet, operates in a distinctly different manner, employing “decoy transitions” to model identification confidence and to determine presence of interference. To use this approach for label-free experiments, data on user defined decoy transitions for each peptide must be acquired in each run. When labeled peptides for each analyte are used, mProphet works more like traditional methods for determining confidence of identification and presence of interferences. The mProphet approach is also applicable to data independent acquisition and is currently implemented in Spectronaut (http://www.biognosys.ch/hrm-mrm-tools/spectronaut.html).
Participants of the workshop agreed that both raw data and processed results should be publicly available. For maximum benefit to the community, the results should be in a form that (1) makes it easy to understand what the assay measures and how reliable it is and (2) is easily transferred and used to configure assays/measurements in one's own laboratory. Public accessibility of all critical information necessary to construct assays for peptide/protein targets of interest as well as QC data demonstrating the performance of the assays will facilitate development of reliable MRM assays by researchers around the world as well as transitioning of assays to Tier 1 by clinical and in vitro diagnostic laboratories. Intense development activity is ongoing in this area, with some of the first examples of useful data repositories for MRM data having the capabilities described above being PASSEL (96) and Panorama (https://panoramaweb.org). The Clinical Proteomics Tumor Analysis Consortium is developing a portal for MRM assays targeting cancer-relevant proteins and modified peptides (http://proteomics.cancer.gov/programs/cptacnetwork). Panorama serves as a back end to the CPTAC assay portal, allowing scientists to search for assay details for peptides and proteins of interest. This portal will clearly define assay details (SOPs) as well as the quality metrics for each assay, including the results of the analytical validation studies conducted.
Guidance for Reporting Results of Targeted MS Experiments
Workshop participants were also asked to consider what information authors need to provide in their manuscripts to enable reviewers and readers to clearly understand what was done and to evaluate the reliability of the peptide or protein quantification measurements reported. Guidelines for authors are already in place for quantitative discovery proteomic studies (23), but these guidelines do not explicitly address targeted MS analyses. Efforts have begun to define the minimum information that needs to be provided for quantitative proteomics experiments, including those involving targeted MS analyses. These efforts are largely focused on deposition of data into public repositories like PRIDE (97). Providing such information, which requires manual entry of information in multiple free-form text fields, is generally considered burdensome. As a result, compliance is low and the information provided is often incomplete. The published manuscript describing the study remains the best public source of information regarding how the experiments were carried out and why. There is increasing recognition on the part of journals that, in addition to requiring deposition of the raw data, they need to do more to try to ensure that the results of experiments reported in the papers they publish are reliable and reproducible, and that the statistical analysis methods used are appropriate (98). Without clear demonstration of reproducibility in biological replicates the validity of the results of targeted MS studies (and, by extension, all scientific results) are open to question.
Although there was insufficient time for the participants to fully develop a set of guidelines for authors, some general recommendations that apply to all targeted MS analyses emerged. One guiding principal is that authors need to provide sufficient experimental detail to enable replication of work by others, regardless of Tier. To accomplish this, authors will likely need to provide more extensive experimental sections in papers. All details of the experimental design must be described, including how the assays/measurements were constructed, the assay performance achieved for each analyte, how measurements were analytically validated, and how interferences were assessed. Authors should describe how or why they selected the level of analytical validation employed and explain how this is fit-for-purpose given the goals of the experiment and the likely use of the results. All analytical validation data for assay performance should be included in the publication as supplement to allow the reader to independently assess assay quality. Authors need to describe, in detail, the methods used for data analysis and quantification including all statistical methods employed and what assumptions are being made. Simply stating that a certain analysis package was used is insufficient. Authors are encouraged to consistently use standard nomenclature for key terms regarding validation and quality assessment. As noted above, there was unanimous agreement that raw data should be made available in public repositories together with methods files containing reference spectra for all peptides selected, lists of transitions monitored, and all instrument parameters (dwell times, collision energy, etc.). Skyline files were again highlighted as providing a simplified way to provide this information.
The more detailed recommendations of the working groups are informing a set of draft guidelines for authors submitting papers employing targeted MS approaches. These will be presented in a subsequent issue of this journal following a period of public comment.
SUMMARY AND CONCLUSIONS
The meeting participants identified three “Tiers” of targeted MS measurements defined by the analytical goals of the experiments and the required performance characteristics of each using a “fit for purpose” approach. Within each Tier, the experimental evidence and analytical validation steps needed to establish that the tests reported are working as intended and achieving the required levels of performance were also defined. Computational and statistical tools useful for the analysis of targeted MS results were discussed. At the highest level, targeted MS-based assays in Tier 1 and 2 have two properties that together differentiate them from discovery experiments: (1) ability to repeatedly measure sets of analytes of interest within and across samples/experiments and (2) employ internal standards for each analyte for confident detection and precise quantification. Tier 3 measurements, useful in early-stage biological studies, enable repeatable measurement of the same sets of analytes across experiments but that do not employ internal standards for either accurate or precise measurement of the levels. These methods do not constitute assays, but rather are a different way to do discovery proteomics. While the focus of the meeting was on use of the well established targeted MS methods of MRM on triple quadrupole instruments, several of the speakers discussed the use of new data acquisition and analysis methods such as data independent analysis (80–84) and Parallel Reaction Monitoring (59, 99). High resolution, accurate mass analysis and parallel reaction monitoring are of particular interest for targeted assay development owing to their greater analyte specificity, reduction in potential interferences from analytes with similar precursor and product-ion masses, and potential for greater dynamic range. Like traditional MRM methods, papers employing these methods must contain adequate and appropriate data and results demonstrating that the required performance metrics for the measurements have been met.
Supplementary Material
Acknowledgments
We thank the National Cancer Institute (CPTAC - Clinical Proteomic Tumor Analysis Consortium) and the National Heart, Lung, and Blood Institute (Proteomics Centers) of the NIH for their strong support of the meeting.
Footnotes
Author contributions: S.A.C., S.E.A., B.L.A., C.B., B.D., E.W.D., R.P.G., A.N.H., R.H., J.M.K., D.C.L., T.L., B.M., D.M., H.N., A.G.P., L.R., O.V., and R.B. designed research; S.E.A., B.L.A., C.B., B.D., E.W.D., R.P.G., A.N.H., R.H., J.M.K., D.C.L., T.L., B.M., D.M., H.N., A.G.P., L.R., and O.V. performed research; S.E.A., B.L.A., C.B., B.D., E.W.D., R.P.G., A.N.H., R.H., J.M.K., D.C.L., T.L., B.M., D.M., H.N., A.G.P., L.R., and O.V. contributed new reagents or analytic tools; S.A.C., S.E.A., B.L.A., C.B., B.D., E.W.D., R.P.G., A.N.H., R.H., J.M.K., D.C.L., T.L., B.M., D.M., H.N., A.G.P., L.R., and O.V. analyzed data; S.A.C. and E.M. wrote the paper; S.A.C. organized the meeting; E.M., L.A., J. Blonder, E.B., J. Botelho, M.B., R.A.B., A.L.B., D.C., H.K., E.K., C.K., J.L., S.L., R.M., J.O., N.R., J.R., H.R., R.R.T., J.V., G.W., A.W., and S.W. contributed in breakout groups; R.A. helped with initial planning of meeting; R.B. helped with organization of the meeting; P.R.S. helped with initial organization of meeting.
* This work was supported in part by the Broad Institute of MIT and Harvard and by the following grants from the US National Institutes of Health: grant U24CA160034 from the National Cancer Institute Clinical Proteomics Tumor Analysis Consortium Initiative (to S.A.C.) and grants HHSN268201000033C and R01HL096738 from the National Heart, Lung, and Blood Institute (to S.A.C.).
 This article contains supplemental Data.
1 Supplemental materials include the meeting agenda, slide presentations, list of discussion groups and members and the questions participants were asked to address.
1 The abbreviations used are:
- MRM
- multiple reaction monitoring
- SRM
- selected reaction monitoring
- LOD
- limits of detection
- LOQ
- limits of quantification
- LLOQ
- lower limits of quantification.
REFERENCES
- 1. Gillette M. A., Carr S. A. (2013) Quantitative analysis of peptides and proteins in biomedicine by targeted mass spectrometry. Nat Methods 10, 28–34 [DOI] [PMC free article] [PubMed] [Google Scholar]
- 2. Picotti P., Aebersold R. (2012) Selected reaction monitoring-based proteomics: workflows, potential, pitfalls and future directions. Nat. Methods 9, 555–566 [DOI] [PubMed] [Google Scholar]
- 3. Grebe S. K. G., Singh R. J. J. (2011) LC-MS/MS in the clinical laboratory—where to from here? Clin. Biochem. Rev. 32, 5–31 [PMC free article] [PubMed] [Google Scholar]
- 4. Lawson A. M. (1975) The scope of mass spectrometry in clinical chemistry. Clin. Chem. 21, 803–824 [PubMed] [Google Scholar]
- 5. Parsons H. G. (1990) Stable isotopes in the management and diagnosis of inborn errors of metabolism. Can. J. Physiol. Pharmacol. 68, 950–954 [DOI] [PubMed] [Google Scholar]
- 6. Brumley W. C., Sphon J. A. (1981) Regulatory mass spectrometry. Biomed. Mass Spectrom. 8, 390–396 [DOI] [PubMed] [Google Scholar]
- 7. Sphon J. A. (1978) Use of mass spectrometry for confirmation of animal drug residues. J. Assoc. Off. Anal. Chem. 61, 1247–1252 [PubMed] [Google Scholar]
- 8. Vargo J. D. (1998) Determination of sulfonic acid degradates of chloroacetanilide and chloroacetamide herbicides in groundwater by LC/MS/MS. Anal. Chem. 70, 2699–2703 [DOI] [PubMed] [Google Scholar]
- 9. Kuhara T. (2007) Noninvasive human metabolome analysis for differential diagnosis of inborn errors of metabolism. J. Chromatog. 855, 42–50 [DOI] [PubMed] [Google Scholar]
- 10. Pitt J. J., Eggington M., Kahler S. G. (2002) Comprehensive screening of urine samples from inborn errors of metabolism by electrospray tandem mass spectrometry. Clin. Chem. 48, 1970–1980 [PubMed] [Google Scholar]
- 11. Timmerman P., Anders, Kall M., Gordon B., Laakso S., Freisleben A., Hucker R. (2010) Best practices in a tiered approach to metabolite quantification: Views and recommendations of the European Bioanalysis Forum. Bioanalysis 2, 1185–1194 [DOI] [PubMed] [Google Scholar]
- 12. Timmerman P., Herling C., Stoellner D., Jaitner B., Pihl S., Elsby K., Henderson N., Barroso B., Fischmann S., Companjen A., Versteilen A., Bates S., Kingsley C., Kunz U. (2012) European Bioanalysis Forum recommendation on method establishment and bioanalysis of biomarkers in support of drug development. Bioanalysis 4, 1883–1894 [DOI] [PubMed] [Google Scholar]
- 13. Timmerman P., Lausecker B., Barosso B., van Amsterdam P., Luedtke S., Dijksman J. (2012) ‘Large Meets Small’: connecting the bioanalytical community around peptide and protein bioanalysis with LC-MS(/MS). Bioanalysis 4, 627–631 [DOI] [PubMed] [Google Scholar]
- 14. Thompson M., Ramsey M. H. (1995) Quality concepts and practices applies to sampling – an exploratory study. Analyst 120, 261–270 [Google Scholar]
- 15. Bethem R., Boyd R. K. (1998) Mass spectrometry in trace analysis. J. Amer. Soc. Mass Spectrom. 9, 643–648 [Google Scholar]
- 16. Bethem R., Boison J., Gale J., Heller D., Lehotay S., Loo J., Musser S., Price P., Stein S. (2003) Establishing the fitness for purpose of mass spectrometric methods. J. Amer. Soc. Mass Spectrom. 14, 528–541 [DOI] [PubMed] [Google Scholar]
- 17. Lee J. W., Devanarayan V., Barrett Y. C., Weiner R., Allinson J., Fountain S., Keller S., Weinryb I., Green M., Duan L., Rogers J. A., Millham R., O'Brien P. J., Sailstad J., Khan M., Ray C., Wagner J. A. (2006) Fit-for-purpose method development and validation for successful biomarker measurement. Pharm. Res. 23, 312–328 [DOI] [PubMed] [Google Scholar]
- 18. Lee J. W., Figeys D., Vasilescu J. (2007) Biomarker assay translation from discovery to clinical studies in cancer drug development: quantification of emerging protein biomarkers. Adv. Cancer Res. 96, 269–298 [DOI] [PubMed] [Google Scholar]
- 19. Cummings J., Raynaud F., Jones L., Sugar R., Dive C., on behalf of the Bioanalysis and Quality Assurance (BAQA) Group of the ECMC (2010) Fit-for-purpose biomarker method validation for application in clinical trials of anticancer drugs. Br. J. Cancer 103, 1313–1317 [DOI] [PMC free article] [PubMed] [Google Scholar]
- 20. Carr S. A., Aebersold R., Baldwin M., Burlingame A., Clauser K., Nesvizhski A. (2004) The need for guidelines in publication of peptide and protein identification data. Mol. Cell. Proteomics 3, 531–533 [DOI] [PubMed] [Google Scholar]
- 21. Bradshaw R. A., Burlingame A. L., Carr S., Aebersold R. (2006) Reporting protein identification data: the next generation of guidelines. Mol. Cell. Proteomics. 5, 787–788 [DOI] [PubMed] [Google Scholar]
- 22. Chalkley R. J., Clauser K. R., Carr S. A. (2009) Updating the MCP Proteomic publication guidelines. ASBMB Today, 16–17 [Google Scholar]
- 23.http://www.mcponline.org.libproxy.mit.edu/site/misc/PhialdelphiaGuidelinesFINALDRAFT.pdf
- 24. Guidance for Industry: Bioanalytical Method Validation (2001) US Department of Health and Human Services, US FDA, Center for Drug Evaluation and Research, Rockville, MD, U.S.A: (Rev. 1, September, 2013) [Google Scholar]
- 25.(2011) Guideline on Bioanalytical Method Validation. EMA, Committee for Medicinal Products for Human Use, London, UK [Google Scholar]
- 26. DeSilva, et al. (2012) White paper on recent issues in bioanalysis and alignment of multiple guidelines. Bioanalysis 4, 2213–2226 [DOI] [PubMed] [Google Scholar]
- 27. Barr J.R., Maggio V.L., Patterson D.G., Jr., Cooper G.R., Henderson L.O., Turner W.E., et al. (1996) Isotope dilution–mass spectrometric quantification of specific proteins: model application with apolipoprotein A-I. Clin Chem 42, 1676–1682 [PubMed] [Google Scholar]
- 28. Gerber S. A., Rush J., Stemman O., Kirschner M. W., Gygi S. P. (2003) Absolute quantification of proteins and phosphoproteins from cell lysates by tandem MS. Proc. Nat. Acad. Sci. 100, 6940–6945 [DOI] [PMC free article] [PubMed] [Google Scholar]
- 29. Keshishian H., Addona T., Burgess M., Kuhn E., Carr S. A. (2007) Quantitative, multiplexed assays for low abundance proteins in plasma by targeted mass spectrometry and stable isotope dilution. Mol. Cell. Proteomics 2, 2212. [DOI] [PMC free article] [PubMed] [Google Scholar]
- 30. Berna M. J., Ott L., Engle S., Watson D., Solter P., Ackermann B. (2008) Quantification of NTproBNP in rat serum using immunoprecipitation and LC/MS/MS: a Biomarker of drug-induced cardiac hypertrophy. Anal. Chem. 80, 561–566 [DOI] [PubMed] [Google Scholar]
- 31. Addona T. A., Abbatiello S. E., Schilling B., Skates S. J., Mani D. R., Bunk D. M., Spiegelman C. H., Zimmerman L. J., Ham A. J. L., Keshishian H., Hall S. C., Allen S., Blackman R. K., Borchers C. H., Buck C., Cardasis H. L., Cusack M. P., Dodder N. G., Gibson B. W., Held J. M., Hiltke T., Jackson A., Johansen E. B., Kinsinger C. R., Li J., Mesri M., Neubert T. A., Niles R. K., Pulsipher T. C., Ransohoff D., Rodriguez H., Rudnick P. A., Smith D., Tabb D. L., Tegeler T. J., Variyath A. M., Vega-Montoto L. J., Wahlander A., Waldemarson S., Wang M., Whiteaker J. R., Zhao L., Anderson N. L., Fisher S. J., Liebler D. C., Paulovich A. G., Regnier F. E., Tempst P., Carr S. A. (2009) Multi-site assessment of the precision and reproducibility of multiple reaction monitoring-based measurements of proteins in plasma. Nat. Biotechnol. 27, 633–685 [DOI] [PMC free article] [PubMed] [Google Scholar]
- 32. Picotti P., Bodenmiller B., Mueller L. N., Domon B., Aebersold R. (2009) Full dynamic range proteome analysis of S. cerevisiae by targeted proteomics. Cell 138, 795–806 doi: 10.1016/j.cell.2009.05.051. Epub 2009 Aug 6 [DOI] [PMC free article] [PubMed] [Google Scholar]
- 33. Whiteaker J. R., Zhao L., Abbatiello S. E., Burgess M., Kuhn E., Lin C. W., Pope M. E., Razavi M., Anderson N. L., Pearson T. W., Carr S. A., Paulovich A. G. (2011) Evaluation of large scale quantitative proteomic assay development using peptide affinity-based mass spectrometry. Mol. Cell. Proteomics 10, M110.005645. [DOI] [PMC free article] [PubMed] [Google Scholar]
- 34. Shi T., Fillmore T. L., Sun X., Zhao R., Schepmoes A. A., Hossain M., Xie F., Wu S., Kim J. S., Jones N., Moore R. J., Pasa-Tolic L., Kagan J., Rodland K. D., Liu T., Tang K., Camp D. G., Smith R. D., Qian W. J. (2012) Antibody-free, targeted mass-spectrometric approach for quantification of proteins at low picogram per milliliter levels in human plasma/serum. Proc. Natl. Acad. Sci. U.S.A. 109, 15395–15400 [DOI] [PMC free article] [PubMed] [Google Scholar]
- 35. Wang Q., Chaerkady R., Wu J., Hwang H. J., Papadopoulos N., Kopelovich L., Maitra. A., Matthaei H., Eshleman J. R., Hruban R. H., Kinzler K. W., Pandey A., Vogelstein B. (2011) Mutant proteins as cancer-specific biomarkers. Proc. Natl. Acad. Sci. U.S.A. 108, 2444–2449 [DOI] [PMC free article] [PubMed] [Google Scholar]
- 36. Addona T. A., Shi X., Keshishian H., Mani D. R., Burgess M., Gillette M. A., Clauser K. R., Shen D., Lewis G. D., Farrell L. A., Fifer M. A., Sabatine M. S., Gerszten R. E., Carr S. A. (2011) A pipeline that integrates the discovery and verification of plasma protein biomarkers reveals candidate markers for cardiovascular disease. Nat. Biotechnol. 29, 635–643 [DOI] [PMC free article] [PubMed] [Google Scholar]
- 37. Whiteaker J. R., Lin C., Kennedy J., Hou L., Trute M., Sokal I., Yan P., Schoenherr R. M., Zhao L., Voytovich U. J., Kelly-Spratt K. S., Krasnoselsky A., Gafken P. R., Hogan J. M., Jones L. A., Wang P., Amon L., Chodosh L. A., Nelson P. S., McIntosh M. W., Kemp C. J., Paulovich A. G. (2011) A targeted proteomics-based pipeline for verification of biomarkers in plasma. Nat. Biotech. 29, 625–634 [DOI] [PMC free article] [PubMed] [Google Scholar]
- 38. Domanski D., Percy A. J., Yang J., Chambers A. G., Hill J. S., Freue G. V., Borchers C. H. (2012) MRM-based multiplexed quantitation of 67 putative cardiovascular disease biomarkers in human plasma. Proteomics 12, 1222–1243 [DOI] [PubMed] [Google Scholar]
- 39. Pan S., Chen R., Brand R. E.., Hawley S., Tamura Y., Gafken P. R., Milless B. P., Goodlett D. R., Rush J., Brentnall T. A. (2012) Multiplex targeted proteomic assay for biomarker detection in plasma: A pancreatic cancer biomarker case study. J. Proteome Res. 11, 1937–1948 [DOI] [PMC free article] [PubMed] [Google Scholar]
- 40. Huttenhain R., Soste M., Selevsek N., Rost H., Sethi A., Carapito C.., Farrah T., Deutsch E. W., Kusebauch U., Moritz R. L., Nimeus-Malmstrom E., Rinner O., Aebersold R. (2012) Reproducible quantification of cancer-associated proteins in body fluids using targeted proteomics. Sci. Transl. Med. 4, 1–13 [DOI] [PMC free article] [PubMed] [Google Scholar]
- 41. Kushnir M. M., Rockwood A. L., Roberts W. L., Abraham D., Hoofnagle A. N., Meikle A. W. (2013) Measurement of thyroglobulin by liquid chromatography-tandem mass spectrometry in serum and plasma in the presence of antithyroglobulin autoantibodies. Clinical Chemistry 59, 982–990 [DOI] [PMC free article] [PubMed] [Google Scholar]
- 42. Neubert H., Muirhead D., Kabir M., Grace C., Cleton A., Arends R. (2013) Sequential protein and peptide immunoaffinity capture for mass spectrometry-based quantification of total human beta-nerve growth factor. Anal. Chem. 85, 1719–1726 [DOI] [PubMed] [Google Scholar]
- 43. Rifai N., Gillette M. A., Carr S. A. (2006) Protein biomarker discovery and validation: the long and uncertain path to clinical utility. Nat. Biotechnol. 24, 971–983 [DOI] [PubMed] [Google Scholar]
- 44. Brun V., Masselon C., Garin J., Dupuis A. (2009) Isotope dilution strategies for absolute quantitative proteomics. J. Proteomics 72, 740–749 [DOI] [PubMed] [Google Scholar]
- 45. Kuzyk M. A., Smith D., Yang J. C., Cross T. J., Jackson A. M., Hardie D. B., Anderson N. L., Borchers C. H. (2009) Multiple reaction monitoring-based, multiplexed, absolute quantitation of 45 proteins in human plasma. Mol. Cell. Proteomics 8, 1860–1877 [DOI] [PMC free article] [PubMed] [Google Scholar]
- 46. Shuford C. M., Sederoff R. R., Chiang V. L., Muddiman D. C. (2012) Peptide production and decay rates affect the quantitative accuracy of protein cleavage isotope dilution mass spectrometry (PC-IDMS). Mol. Cell. Proteomics 11, 814–823 [DOI] [PMC free article] [PubMed] [Google Scholar]
- 47. Matuszewski B. K., Constanzer M. L., Chavez-Eng C. M. (1998) Matrix effect in quantitative LC/MS/MS analyses of biological fluids: a method for determination of finasteride in human plasma at picogram per milliliter concentrations. Anal. Chem. 70, 882–889 [DOI] [PubMed] [Google Scholar]
- 48. King R., Bonfiglio R., Fernandez-Metzler C., Miller-Stein C., Olah T. (2000) Mechanistic investigation of ionization suppression in electrospray ionization. J. Am. Soc. Mass Spectrom. 11, 942–950 [DOI] [PubMed] [Google Scholar]
- 49. Abbatiello S. E., Mani D. R., Keshishian H., Carr S. A. (2010) Automated Detection of inaccurate and imprecise transitions in quantitative assays of peptides by multiple monitoring mass spectrometry. Clin. Chem. 56, 291–305 [DOI] [PMC free article] [PubMed] [Google Scholar]
- 50. Reiter L., Rinner O., Picotti P., Hüttenhain R., Beck M., Brusniak M. Y., Hengartner M. O., Aebersold R. (2011) mProphet: automated data processing and statistical validation for large-scale SRM experiments. Nat. Methods 8, 430–435 [DOI] [PubMed] [Google Scholar]
- 51. Keshishian H., Addona T., Burgess M., Mani D. R., Shi X., Kuhn E., Sabatine M. S., Gerszten R. E., Carr S. A. (2009) Quantification of cardiovascular biomarkers in patient plasma by targeted mass spectrometry and stable isotope dilution. Mol. Cell. Proteomics 8, 2339–2349 [DOI] [PMC free article] [PubMed] [Google Scholar]
- 52. Brun V., Dupuis A., Adrait A., Marcellin M., Thomas D., Court M., Vandenesch F., Garin J. (2007) Isotope-labeled protein standards. Mol. Cell. Proteomics 6, 2139–2149 [DOI] [PubMed] [Google Scholar]
- 53. Singh R., Crow F. W., Babic N., Lutz W. H., Lieske J. C., Larson T. S., Kumar R. (2007) A liquid chromatography-mass spectrometry method for the quantification of urinary albumin using a novel N-15-isotopically labeled albumin internal standard. Clin. Chem. 53, 540–542 [DOI] [PubMed] [Google Scholar]
- 54. Kito K., Ito T. (2008) Mass spectrometry-based approaches toward absolute quantitative proteomics. Current Genomics 9, 263–274 [DOI] [PMC free article] [PubMed] [Google Scholar]
- 55. Picard G., Lebert D., Louwagie M., Adrait A., Huillet C., Vandenesch F., Bruley C., Garin J., Jaquinod M., Brun V. (2012) PSAQ standards for accurate MS-based quantification of proteins: from the concept to biomedical applications. J. Mass Spectrom. 47, 1353–1363 [DOI] [PubMed] [Google Scholar]
- 56. Kuhn E., Whiteaker J. R., Mani D. R., Jackson A. M., Zhao L., Pope M. E., Smith D., Rivera K. D., Anderson N. L., Skates S. J., Pearson T. W., Paulovich A. G., Carr S. A. (2012) Inter-laboratory evaluation of automated, multiplexed peptide immunoaffinity enrichment coupled to multiple reaction monitoring mass spectrometry for quantifying proteins in plasma. Mol. Cell. Proteomics 11, M111.013854. [DOI] [PMC free article] [PubMed] [Google Scholar]
- 57. Paulovich A. G., Whiteaker J. R., Hoofnagle A. N., Wang P. (2008) The interface between biomarker discovery and clinical validation: The tar pit of the protein biomarker pipeline. Proteomics Clin. Appl. 2, 1386–1402 [DOI] [PMC free article] [PubMed] [Google Scholar]
- 58. Remily-Wood E. R., Liu R. Z., Xiang Y., Chen Y., Thomas C. E., Rajyaguru N., Kaufman L. M., Ochoa J. E., Hazlehurst L., Pinilla-Ibarz J., Lancet J., Zhang G. L., Haura E., Shibata D., Yeatman T., Smalley K. S. M., Dalton W. S., Huang E. N., Scott E., Bloom G. C., Eschrich S. A., Koomen J. M. (2011) A database of reaction monitoring mass spectrometry assays for elucidating therapeutic response in cancer. Proteomics Clin. Appl. 5, 383–396 [DOI] [PMC free article] [PubMed] [Google Scholar]
- 59. Gallien S., Duriez E., Crone C., Kellmann M., Moehring T., Domon B. (2012) Targeted proteomic quantification on quadrupole-orbitrap mass spectrometer. Mol. Cell. Proteomics 11, 1709–1723 [DOI] [PMC free article] [PubMed] [Google Scholar]
- 60. Oberg A. L., Vitek O. (2009) Statistical design of quantitative mass spectrometry-based proteomic experiments. J. Proteome Res. 8, 2144–2156 [DOI] [PubMed] [Google Scholar]
- 61. Beynon R. J., Doherty M. K., Pratt J. M., Gaskell S. J. (2005) Multiplexed absolute quantification in proteomics using artificial QCAT proteins of concatenated signature peptides. Nat. Methods 2, 587. [DOI] [PubMed] [Google Scholar]
- 62. Linnet K. (1993) Evaluation of regression procedures for methods comparison studies. Clin. Chem. 39, 424–432 [PubMed] [Google Scholar]
- 63. Currie L. A. (1968) Limits for qualitative detection and quantitative determination. Anal. Chem. 40, 586–593 [Google Scholar]
- 64. Linnet K., Kondratovichm M. (2004) Partly nonparametric approach for determining the limit of detection. Clin. Chem. 50, 732–740 [DOI] [PubMed] [Google Scholar]
- 65. Mani D. R., Abbatiello S. E., Carr S. A. (2012) Statistical characterization of multiple-reaction monitoring mass spectrometry (MRM-MS) assays for quantitative proteomics. Bioinformatics 13, S9. [DOI] [PMC free article] [PubMed] [Google Scholar]
- 66. Li W., Cohen L.H. (2003) Quantitation of endogenous analytes in biofluid without a true blank matrix Anal. Chem. 75, 5854–5859 [DOI] [PubMed] [Google Scholar]
- 67. Whiteaker J. R., Zhao L., Lin C., Yan P., Paulovich A. G. (2011) Sequential multiplexed analyte quantification using peptide immunoaffinity enrichment coupled to mass spectrometry Mol. Cell. Proteomics 10.1074/mcp.M111.015347 [DOI] [PMC free article] [PubMed] [Google Scholar]
- 68. Kuhn E., Ross J., Abbatiello S. E., Mani D. R., Carr S. A. (2012) Reversing the Curve: Determining LOD in the Presence of Endogenous Signal using SID-MRM-MS. Presented at the 60th Annual Conference on Mass Spectrometry, Monday poster MP01, poster number 004 [Google Scholar]
- 69. Abbatiello S. E., Mani D. R., Schilling B., Maclean B., Zimmerman L. J., Feng X., Cusack M. P., Sedransk N., Hall S. C., Addona T., Allen S., Dodder N. G., Ghosh M., Held J. M., Hedrick V., Inerowicz H. D., Jackson A., Keshishian H., Kim J. W., Lyssand J. S., Riley C. P., Rudnick P., Sadowski P., Shaddox K., Smith D., Tomazela D., Wahlander A., Waldemarson S., Whitwell C. A., You J., Zhang S., Kinsinger C. R., Mesri M., Rodriguez H., Borchers C. H., Buck C., Fisher S. J., Gibson B. W., Liebler D., Maccoss M., Neubert T. A., Paulovich A., Regnier F., Skates S. J., Tempst P., Wang M., Carr S. A. (2013) Design, implementation, and multi-site evaluation of a system suitability protocol for the quantitative assessment of instrument performance in LC-MRM-MS. Mol. Cell. Proteomics 12, 2623–2639 doi: 10.1074/mcp.M112.027078 [DOI] [PMC free article] [PubMed] [Google Scholar]
- 70. Neubert H., Gale J., Muirhead D. (2010) Online high-flow peptide immunoaffinity enrichment and nanoflow LC-MS/MS: Assay development for total salivary pepsin/pepsinogen. Clin. Chem. 56, 1413–1423 [DOI] [PubMed] [Google Scholar]
- 71. Li W., Nemirovskiy O., Fountain S., Mathews W. R., Szekely-Klepser G. (2007) Clinical validation of an immunoaffinity LC–MS/MS assay for the quantification of a collagen type II neoepitope peptide: A biomarker of matrix metalloproteinase activity and osteoarthritis in human urine. Anal. Biochem. 369, 41–53 [DOI] [PubMed] [Google Scholar]
- 72. Bantscheff M., Lemeer S., Savitski M. M., Kuster B. (2012) Quantitative mass spectrometry in proteomics: critical review update from 2007 to the present. Anal. Bioanal. Chem. 404, 939–965 [DOI] [PubMed] [Google Scholar]
- 73. Rochat B., Peduzzi D., McMullen J., Favre A., Kottelat E., Favrat B., Tissot J. D., Angelillo-Scherrer A., Bromirski M., Waldvogel S. (2013) Validation of hepcidin quantification in plasma using LC–HRMS and discovery of a new hepcidin isoform. Bioanalysis 5, 2509–2520 [DOI] [PubMed] [Google Scholar]
- 74. Jaffe J. D., Wang Y., Chan H. M., Zhang J., Huether R., Kryukov G. V., Bhang H. E., Taylor J. E., Hu M., Englund N. P, Yan F., Wang Z., McDonald R. E., 3rd, Wei L., Ma J., Easton J., Yu Z., Debeaumount R., Gibaja V., Venkatesan K., Schlegel R., Sellers W. R., Keen N., Liu J., Caponigro G., Barretina J., Cooke V. G., Mullighan C., Carr S. A., Downing J. R., Garraway L. A., Stegmeier F. (2013) Global chromatin profiling reveals NSD2 mutations in pediatric acute lymphoblastic leukemia. Nat. Genet. 45, 1386–1391, Epub 2013 Sep 29 [DOI] [PMC free article] [PubMed] [Google Scholar]
- 75. Fenyö D., Eriksson J., Beavis R. (2010) Mass spectrometric protein identification using the global proteome machine. Methods Mol Biol. 673, 189–202 [DOI] [PMC free article] [PubMed] [Google Scholar]
- 76. Deutsch E. W. (2010) The peptideatlas project. Methods Mol. Biol. 604, 285–296 [DOI] [PMC free article] [PubMed] [Google Scholar]
- 77. Vizcaíno J. A., Côté R. G., Csordas A., Dianes J. A., Fabregat A., Foster J. M., Griss J., Alpi E., Birim M., Contell J., O'Kelly G., Schoenegger A., Ovelleiro D., Perez-Riverol Y., Reisinger F., Ríos D., Wang R., Hermjakob H. (2013) The proteomics identifications (PRIDE) database and associated tools: Status in 2013. Nucleic Acids Res. 41 (Database issue), D1063–D1069, Epub 2012 Nov 29 [DOI] [PMC free article] [PubMed] [Google Scholar]
- 78. Picotti P., Lam H., Campbell D., Deutsch E. W., Mirzaei H., Ranish J., Domon B., Aebersold R. (2013) A database of mass spectrometric assays for the yeast proteome. Mol. Cell. Proteomics 12, 1005–1016 [DOI] [PMC free article] [PubMed] [Google Scholar]
- 79. Hüttenhain R., Surinova S., Ossola R., Sun Z., Campbell D., Cerciello F., Schiess R., Bausch-Fluck D., Rosenberger G., Chen J., Rinner O., Kusebauch U., Hajdúch M., Moritz R. L, Wollscheid B., Aebersold R. (2013) N-glycoprotein SRMAtlas: A resource of mass spectrometric assays for N-glycosites enabling consistent and multiplexed protein quantification for clinical applications. Mol. Cell. Proteomics 12, 1005–1016 [DOI] [PMC free article] [PubMed] [Google Scholar]
- 80. Venable J. D., Dong M. Q., Wohlschlegel J., Dillin A., Yates J. R. (2004) Automated approach for quantitative analysis of complex peptide mixtures from tandem mass spectra. Nat. Methods 1, 39–45 [DOI] [PubMed] [Google Scholar]
- 81. Huang X., Liu M., Nold M. J., Tian C., Fu K., Zheng J., Geromanos S. J., Ding S. J. (2011) Software for quantitative proteomic analysis using stable isotope labeling and data independent acquisition. Anal. Chem. 15, 6971–6979 doi: 10.1021/ac201555m. Epub 2011 Aug 23 [DOI] [PubMed] [Google Scholar]
- 82. Gillet L. C., Navarro P., Tate S., Röst H., Selevsek N., Reiter L., Bonner R., Aebersold R. (2012) Targeted data extraction of the MS/MS spectra generated by data-independent acquisition: a new concept for consistent and accurate proteome analysis. Mol. Cell. Proteomics 11, 10.1074/mcp.O111.016717 Epub 2012 Jan 18 [DOI] [PMC free article] [PubMed] [Google Scholar]
- 83. Egertson J. D., Kuehn A., Merrihew G. E., Bateman N. W., Maclean B. X., Ting Y. S., Canterbury J. D., Marsh D. M., Kellmann M., Zabrouskov V., Wu C. C., Maccoss M. J. (2013) Multiplexed MS/MS for improved data-independent acquisition. Nat. Methods 10, 744–746 10.1038/nmeth.2528 Epub 2013 Jun 23 [DOI] [PMC free article] [PubMed] [Google Scholar]
- 84. Panchaud A., Scherl A., Shaffer S. A., von Haller P. D., Kulasekara H. D., Miller S. I., Goodlett D. R. (2009) Precursor acquisition independent from ion count: how to dive deeper into the proteomics ocean. Anal. Chem. 81, 6481–6488 10.1021/ac900888s [DOI] [PMC free article] [PubMed] [Google Scholar]
- 85. Escher C., Reiter L., MacLean B., Ossola R., Herzog F., Chilton J., MacCoss M. J., Rinner O. (2012) Using iRT, a normalized retention time for more targeted measurement of peptides. Proteomics 12, 1111–1121 10.1002/pmic.201100463 [DOI] [PMC free article] [PubMed] [Google Scholar]
- 86. Picotti P., Rinner O., Stallmach R., Dautel F., Farrah T., Domon B., Wenschuh H., Aebersold R. (2010) High-throughput generation of selected reaction-monitoring assays for proteins and proteomes. Nat. Methods 7, 43–46 10.1038/nmeth.1408 Epub 2009 Dec 6 [DOI] [PubMed] [Google Scholar]
- 87. Zhang H., Liu Q., Zimmerman L. J., Ham A. J., Slebos R. J., Rahman J., Kikuchi T., Massion P. P., Carbone D. P., Billheimer D., Liebler D. C. (2011) Methods for peptide and protein quantitation by liquid chromatography-multiple reaction monitoring mass spectrometry. Mol. Cell. Proteomics 10, 10.1074/mcp.M110.006593 Epub 2011 Feb 27 [DOI] [PMC free article] [PubMed] [Google Scholar]
- 88. Tang H. Y., Beer L. A., Barnhart K. T., Speicher D. W. (2011) Rapid verification of candidate serological biomarkers using gel-based, label-free multiple reaction monitoring. J. Proteome Res. 10, 4005–4017 10.1021/pr2002098 Epub 2011 Jul 26 [DOI] [PMC free article] [PubMed] [Google Scholar]
- 89. Sherrod S. D., Myers M. V., Li M., Myers J. S., Carpenter K. L., Maclean B., Maccoss M. J., Liebler D. C., Ham A. J. (2012) Label-free quantitation of protein modifications by pseudo selected reaction monitoring with internal reference peptides. J. Proteome Res. [Epub ahead of print] [DOI] [PMC free article] [PubMed] [Google Scholar]
- 90. Colangelo C. M., Chung L., Bruce C., Cheung K. H. (20130 Review of software tools for design and analysis of large scale MRM proteomic datasets. Methods 61, 287–298 10.1016/j.ymeth.2013.05.004 Epub 2013 May 21 [DOI] [PMC free article] [PubMed] [Google Scholar]
- 91. Brusniak M. Y., Chu C. S., Kusebauch U., Sartain M. J., Watts J. D., Moritz R. L. (2012) An assessment of current bioinformatic solutions for analyzing LC-MS data acquired by selected reaction monitoring technology. Proteomics 12, 1176–1184 10.1002/pmic.201100571 [DOI] [PMC free article] [PubMed] [Google Scholar]
- 92. General Principles of Software Validation; Final Guidance for Industry and FDA Staff Document issued on: January 11, 2002 This document supersedes the draft document, “General Principles of Software Validation, Version 1.1, dated June 9, 1997. http://www.fda.gov/downloads/RegulatoryInformation/Guidances/ucm126955.pdf [Google Scholar]
- 93. MacLean B., Tomazela D. M., Shulman N., Chambers M., Finney G. L., Frewen B., Kern R., Tabb D. L., Liebler D. C., MacCoss M. J. (2010) Skyline: an open source document editor for creating and analyzing targeted proteomics experiments. Bioinformatics 26, 966–968 10.1093/bioinformatics/btq054 Epub 2010 Feb 9 [DOI] [PMC free article] [PubMed] [Google Scholar]
- 94.http://genepattern.broadinstitute.org/gp/pages/index.jsf?lsid=QuaSAR. Note that you must register on the Genepattern website in order to access. Registration is free [Google Scholar]
- 95. Surinova S., Hüttenhain R., Chang C. Y., Espona L., Vitek O., Aebersold R. (2013) Automated selected reaction monitoring data analysis workflow for large-scale targeted proteomic studies. Nature Protocols 8, 1602–1619 [DOI] [PubMed] [Google Scholar]
- 96. Farrah T., Deutsch E. W., Kreisberg R., Sun Z., Campbell D. S., Mendoza L., Kusebauch U., Brusniak M. Y., Huttenhain R., Schiess R., Selevsek N., Aebersold R., Moritz R. L. (2012) PASSEL: The PeptideAtlas SRM experiment library. Proteomics 12, 1170–1175 [DOI] [PMC free article] [PubMed] [Google Scholar]
- 97. Martínez-Bartolomé S., Deutsch E. W., Binz P. A., Jones A. R., Eisenacher M., Mayer G., Campos A., Canals F., Bech-Serra J. J., Carrascal M., Gay M., Paradela A., Navajas R., Marcilla M., Hernáez M. L., Gutiérrez-Blázquez M. D., Velarde L. F., Aloria K., Beaskoetxea J., Medina-Aunon J. A., Albar J. P. (2013) Guidelines for reporting quantitative mass spectrometry based experiments in proteomics. J. Proteomics in press [DOI] [PubMed] [Google Scholar]
- 98. Russell J. F. (2013) If a job is worth doing, it is worth doing twice. Nature (2013) 496: 7 and Editorial Staff. Reducing our irreproducibility. Nature 496, 398. [DOI] [PubMed] [Google Scholar]
- 99. Peterson A. C., Russell J. D., Bailey D. J., Westphall M. S., Coon J. J. (2012) Parallel reaction monitoring for high resolution and high mass accuracy quantitative, targeted proteomics. Mol. Cell. Proteomics 11, 10.1074/mcp.O112.020131:1475–1488 [DOI] [PMC free article] [PubMed] [Google Scholar]
Associated Data
This section collects any data citations, data availability statements, or supplementary materials included in this article.