Abstract
In this work, we design and synthesize a malonitrile-functionalized TPE derivative (TPE-DCV), which can react with thiol group through thiol-ene click reaction, leading to the fluorescence change of the system. Combined with the unique AIE property, TPE-DCV can selectively detect glutathione (GSH) but not cysteine or homocysteine. As the cleavage of GSSG with the aid of glutathione reductase produces GSH, which turns on the fluorescence of TPE-DCV, the ensemble of TPE-DCV and GSSG can thus serve as a label-free sensor for enzymatic activity assay of glutathione reductase. We also apply TPE-DCV for the detection of intracellular GSH in living cells.
Biological thiols, including glutathione (GSH), cysteine (Cys), and homocysteine (Hcy), play a pivotal role in many biological processes such as regulating redox homeostasis, detoxification and metabolism, and as an active site of enzymes and cofactors1,2. GSH, which consists of a tripeptide of glutamic acid, cysteine and glycine, is the most abundant and the representative nonprotein thiol inside the cell3. GSH can be oxidized to its dimeric form, GSSG, in which way to scavenge reactive oxygen species and free radicals, protecting cells from oxidative stress and toxins4. GSSG can be converted back to GSH with the aid of the enzyme glutathione reductase5. Over exposure to oxidative stress, however, can result in the imbalance of the GSH level and lead to cancer, aging, cardiovascular disease, neurodegenerative diseases and other ailments6,7,8. Therefore, quantitative analysis of the GSH level is of great importance because of its biological significance and clinical relevance9,10,11,12,13,14,15,16.
Fluorescent sensors are widely developed for the detection of thiol-containing biological molecules owing to the superior sensitivity, fast response, and unrivalled spatio-temporal resolution14. The strong nucleophilicity of the thiol group allows the design of reaction-based sensors which can switch on/off and/or alter emission colors in response to thiols17,18,19,20,21,22,23,24,25,26,27. Although many sensors have been developed to distinguish thiols from other biological molecules, it still remains elusive to discriminate GSH from other biological thiol molecules because of the bulky structure and thus lower reactivity of GSH. Only a few examples of fluorescent probes have been reported to selectively detect GSH28,29,30,31,32 and even fewer for the detection in the cellular environment33,34,35,36,37. For instance, a novel ratiometric fluorescent probe based on monochlorinated boron dipyrromethene (BODIPY) derivatives has been reported recently by Yang et al. for the specific detection of GSH over Cys and Hcy16. The difficulty of BODIPY synthesis, however, may limit its applications. It is thus desirable to develop a fluorescent sensor that displays high sensitivity and selectivity for GSH and enables easier accessibility.
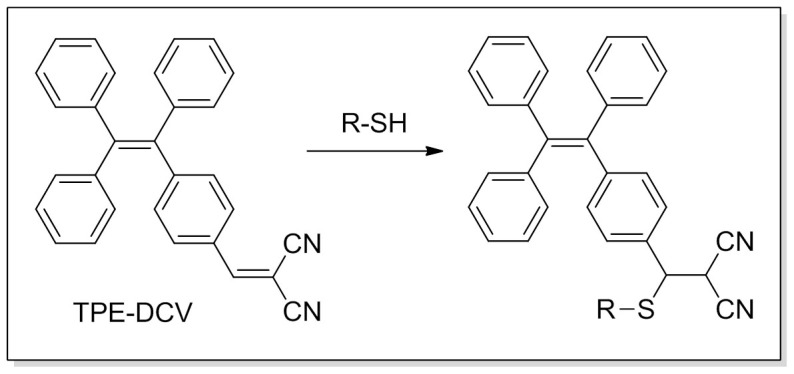
Our group has discovered a novel phenomenon of aggregation-induced emission (AIE)38, that is, a series of nonemissive dyes, such as tetraphenylethene (TPE) and hexaphenylsilole (HPS), are induced to emit efficiently by aggregate formation39. Restriction of intramolecular motions in the aggregate state has been proposed as the main cause for the AIE phenomenon40. TPE is an archetypal AIE fluorogen which is easy to synthesize and ready to functionalize41. We and other research group have successfully utilized TPE-based AIE luminogens as chemosensors and bioprobes42,43,44,45,46,47,48,49,50,51,52,53,54. According to the AIE mechanism, the fluorescence of these dyes can be turned on/off if the analyte can alter the aggregation behavior (solubility) or the intramolecular motions of the fluorescent species55,56. It is envisioned that a specific AIE probe can be designed by decorating the TPE core with a particular functional group26,57. We have previously reported a maleimide group functionalized TPE (TPE-MI) for thiol sensing26. TPE-MI offers a simple and sensitive method for the detection of thiol, however, with poor selectivity among different thiols. To improve the selectivity, in this work, we design and synthesize a malononitrile-functionalized TPE derivative, TPE-DCV, which can undergo addition reaction with thiol group to the alkene bond, leading to the change in its fluorescence in the system (Figure 1). Combined with the unique AIE behavior, TPE-DCV can detect GSH with high specificity over Cys and Hcy.
Figure 1. Reaction of TPE-DCV with thiol.
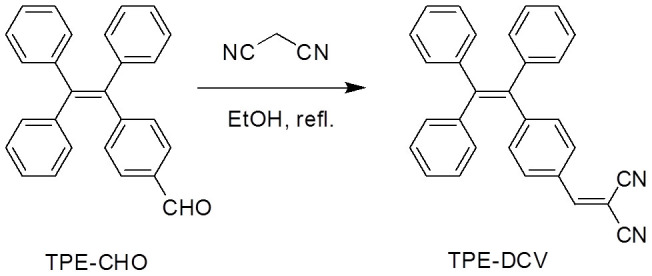
TPE-DCV was synthesized according to the synthetic route shown in Figure 2. The product was obtained as yellow powder in a yield of 74% and characterized by NMR, high-resolution mass spectroscopy and elemental analysis (see Experimental Section in Supporting Information). TPE-DCV is soluble and thus non-emissive in ethanol. The fluorescence spectrum exhibits as nearly a flat line parallel to the abscissa when the volume fraction of water (fw) is lower than 60% (Figure S1). When a large amount of water is added, the resultant mixture becomes intensely luminescent with yellow emission peaked at 563 nm. The photoluminescence (PL) intensity of TPE-DCV in the solution with fw of 95% is ~300 times higher than that in pure ethanol. This characteristic curve shown in Figure S1B indicates that TPE-DCV is a typical AIE active fluorogen with an fw threshold of 68%, above which the dye molecules aggregate and the emission is turned on. We then use the solution of TPE-DCV in ethanol/water mixture with fw of 68% as the detection medium for our experiments. Under such circumstance, the background noise of TPE-DCV is suppressed while the hydrophilic biological thiols can still be well dissolved.
Figure 2. Synthetic route to TPE-DCV.
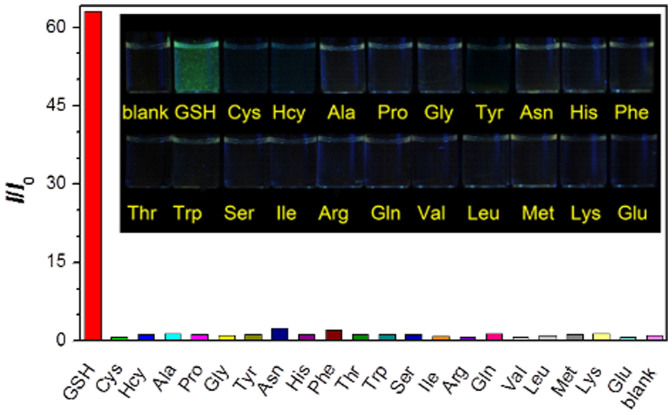
First, we measure the fluorescence response of TPE-DCV to different amino acids in the detection medium (Figure 3). The blank solution of TPE-DCV is almost non-emissive. The presence of GSH triggers the fluorescence of the dye whereas all the other amino acids, including Cys and Hcy, can hardly turn on the fluorescence of TPE-DCV in the detection medium. The emission spectra show that the spectrum of TPE-DCV peaks at 523 nm in the presence of GSH, which blue-shifts about 40 nm as compared to that of the TPE-DCV aggregates in water (Figure S3). Similar phenomenon is observed in the solution of water/ethanol mixtures with 70% water fraction where TPE-DCV is in the aggregate state (Figure S4).
Figure 3. Selectivity of TPE-DCV towards glutathione (GSH).
Fluorescence response of TPE-DCV (3 μM) at 520 nm in the presence of different amino acids (1 mM) in a water/ethanol mixture (68:32, v/v). Excitation wavelength: 415 nm. Inset: photographs of TPE-DCV in the presence of different amino acids taken under illumination of a handheld UV lamp.
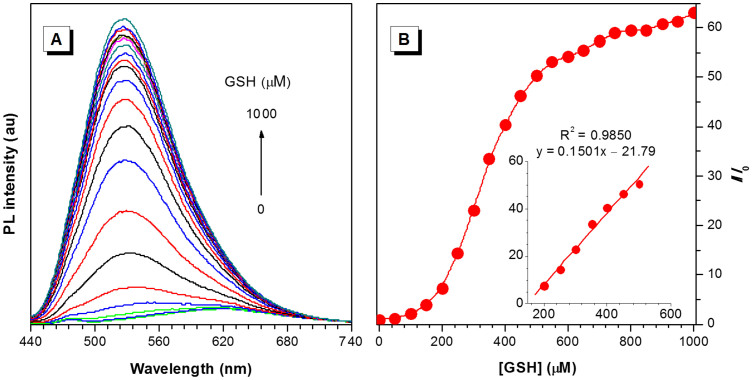
The selectivity of TPE-DCV to GSH over other amino acids prompts us to further investigate its utility as a GSH sensor. The solution of TPE-DCV is weakly fluorescent in the absence of GSH. Upon addition of GSH, a new emission peak at 520 nm emerges and the intensity is rising along with the increase of GSH concentration (Figure 4A). In the GSH concentration range of 200–500 μM, the plot of fluorescence increment (I/I0) at 520 nm as a function of GSH concentration is in a linear regression with a correlation coefficient of 0.985 (Figure 4B).
Figure 4. Glutathione (GSH) quantification by TPE-DCV.
(A) Emission spectra of TPE-DCV (3 μM) in the presence of different concentrations of GSH in a water/ethanol mixture (68:32, v/v). (B) Plot of relative emission intensity (I/I0) at 520 nm versus GSH concentration. Inset: plot of I/I0 at 520 nm of TPE-DCV upon addition of GSH (200–500 μM). I0 denotes the intensity of TPE-DCV in the absence of GSH. Excitation wavelength: 415 nm.
UV spectrum of TPE-DCV in the detection medium shows an absorption band at 409 nm (Figure S5). This peak, however, disappears upon addition of GSH. Same phenomenon is observed in the presence of Cys and Hcy, indicating a chemical reaction may take place between TPE-DCV and thiols which breaks down the conjugation of TPE-DCV. To verify this hypothesis, we perform a model reaction between TPE-DCV and a thiol, 2-mercaptoethanol (ME). A thiol-ene click reaction between TPE-DCV and ME is observed and monitored by 1H NMR spectroscopy. Upon addition of ME, the olefinic proton (Ha) of TPE-DCV with chemical shift of ~8.4 ppm disappears and a new peak (Hb) at 4.69 ppm arises, suggestive of the addition reaction of thiol on the vinyl group (Figure S6)58. In addition, mass analysis also shows the molecular ion of the addition product of TPE-DCV and ME (Figure S7). This thiol-ene click reaction can be complete within 5 min at room temperature, indicating the strong reactivity of TPE-DCV with thiols. Biological thiols can thus react with TPE-DCV under physiological condition, as suggested by the absorption spectra shown in Figure S5.
The absorption spectra clearly suggest that TPE-DCV can react with GSH, Cys, and Hcy through thiol-ene click reaction to form thioether (Figure S5). The fluorescence of TPE-DCV, however, is selectively turned on by GSH but not Cys or Hcy in the detection medium. We are curious about the origin of such high selectivity. Taken into consideration the AIE property of TPE-DCV, the difference in fluorescence response may be ascribed to the varied solubility of the reaction products. TPE-DCV is hydrophobic but still molecularly dissolved in the detection medium of water/ethanol mixture with fw of 68%, as revealed by the weak emission (Figure S1B). GSH is a hydrophilic molecule. The GSH adduct is thus more hydrophilic and less hydrophobic, as compared to TPE-DCV. In the detection medium containing 32% ethanol, the adduct is poorly soluble and forms aggregates, thus switching on the fluorescence. Although Cys and Hcy are also hydrophilic, they are much smaller than GSH. The addition of Cys or Hcy, however, can hardly change the hydrophobicity of TPE-DCV. Their adducts thus remain faintly luminescent in the detection medium.
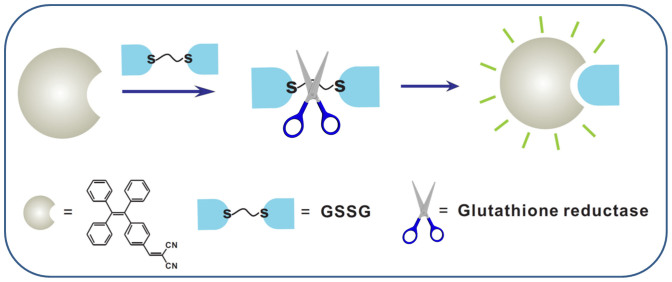
As mentioned, GSH can be oxidized to GSSG under oxidative stress and then rapidly converted back to GSH with glutathione reductase (GR) as the catalysis. The high selectivity and the turn-on property of TPE-DCV to GSH inspire us to utilize it as a probe for real time monitoring of GR activity. The working principle is shown in Figure 5. Neither GSSG nor GR can turn on the fluorescence of TPE-DCV (Figures S8–S9). The fluorescence of TPE-DCV thus solely depends on the yielded GSH in this enzymatic reaction.
Figure 5. Schematic representation of glutathione reductase activity assay by TPE-DCV.
The dimeric form of glutathione (GSSG) can be reduced to GSH with glutathione reductase (GR) as the catalysis. This working principle is used as a probe for real time monitoring of GR activity.
GR is added into the solution of TPE-DCV and GSSG and fluorescent spectra are recorded immediately. Figure 6 shows the time-course change in fluorescent intensity of TPE-DCV with GSSG upon addition of different amounts of GR (0–5.0 UN). With the increase of GR amount, the rate of the initial cleavage reaction is accelerated and more GSH is yielded as revealed by the higher fluorescent intensity after the completion of the enzymatic reaction (Figures S9–S12). TPE-DCV thus represents a simple method for the study of enzyme kinetics of GR.
Figure 6. Kinetic monitoring of glutathione reductase activity.
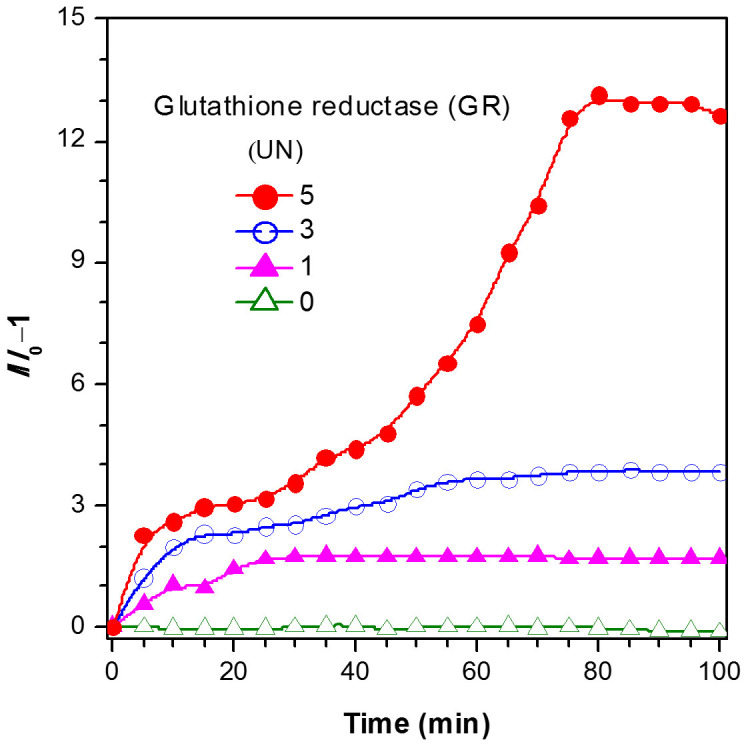
Time-dependent fluorescence change of TPE-DCV (3 μM) at 520 nm in H2O/ethanol mixture (68:32, v/v) with GSSG (1 mM) in the presence of different concentrations of GR. I0 denotes the fluorescent intensity of TPE-DCV with GSSG before addition of GR.
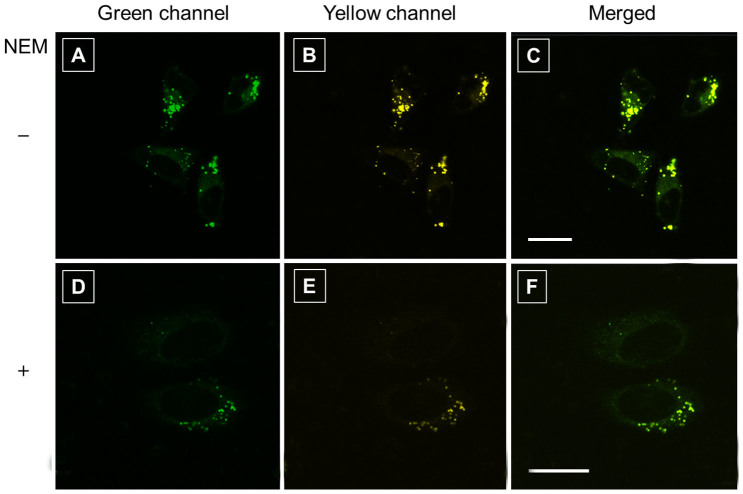
Furthermore, we employ the dye for mapping the distribution of intracellular thiols, mainly GSH. Before applying to live cells, the cytotoxicity of TPE-DCV is evaluated by using 3-(4,5-dimethyl-2-thiazolyl)-2,5-diphenyltetrazolium bromide (MTT) assay (Figure S13). The result shows that the viability of the cells treated with TPE-DCV is almost unchanged as compared to the control untreated cells, suggesting the dye at the tested concentration range would not interfere with the physiology or proliferation of the cells. After verifying the cytocompatibility, live HeLa cells are incubated with TPE-DCV (500 nM) for 5 min following the standard cell-staining protocol. As TPE-DCV shifts its emission wavelength upon reacting with thiols, we collect the fluorescence signals of the cell images from both green (438–521 nm) and yellow channels (522–581 nm). TPE-DCV is cell permeable and stains the cytoplasmic region but not the nucleic parts. The emission from intracellular region covers the green and yellow channels (Figure 7A–C). When pretreating the cells with N-ethylmaleimide (NEM, 20 mM), a trapping reagent of thiol species, for 0.5 h, the signals from the cytoplasmic regions are decreased in both green and yellow channels (Figure 7D–F). As NEM can react and thus consume partial thiols, less amount of thiol is available for TPE-DCV to react. This result in turn implies the occurnace of the thiol-ene click reaction between TPE-DCV and the intracellular thiols-mainly GSH.
Figure 7. Living cell imaging by TPE-DCV.
Confocal images of live HeLa cells incubated with TPE-DCV (500 nM) for 5 min (A–C). Confocal images of live HeLa cells first pretreated with N-ethylmaleimide (NEM, 20 mM), a trapping reagent of thiol species, for 0.5 h, then incubated with TPE-DCV (500 nM) for 5 min (D–F). Excitation wavelength: 405 nm; emission filter: (A,D) green channel 438–521 nm; (B,E) yellow channel 522–581 nm. (C,F) Merged images of panels A/B and D/E, respectively. Scale bar: 20 μm.
In conclusion, an AIE-active fluorogen, TPE-DCV, has been designed and synthesized for the detection of biological thiols. A thiol-ene click reaction between TPE-DCV and thiol group gives rise to the change of the emission color of TPE-DCV. In combination with the AIE property, TPE-DCV exhibits high selectivity GSH over other biological thiols, e.g. Cys and Hcy. The turn-on emission of TPE-DCV by GSH allows us to follow the kinetic process of glutathione reductase. With excellent biocompatibility, TPE-DCV can also be used for mapping the distribution of intracellular free thiols, mainly GSH. TPE-DCV thus represents a new, simple, sensitive, and selective probe for the sensing of GSH, which is of high demand in biological research and clinical applications. The development of reaction-based AIE sensors is of our current interest and ongoing in our laboratories.
Methods
Materials
Tetrahydrofuran (THF), toluene and ethanol were distilled from sodium benzophenone ketyl, calcium hydride and magnesium, respectively, under nitrogen immediately prior to use. Water was purified by a Millipore filtration system. Other chemicals were purchased from Aldrich and used as received without further purification.
Instruments
1H and 13C NMR spectra were measured on a Bruker ARX 400 NMR spectrometer using CDCl3, DMSO-d6, or D2O as solvent and tetramethylsilane (TMS) as internal reference. UV absorption spectra were taken on a Varian Cary spectrometer. Photoluminescence (PL) spectra were recorded on a Perkin-Elmer LS 55 spectrofluorometer. MALDI-TOF mass spectra were recorded on a GCT premier CAB048 mass spectrometer. Elemental analysis was performed with an Elementar Vario Micro Cube. Particle sizes and Zeta potential of the nanoaggregates were determined using a ZETA-Plus potential Analyzer.
Synthesis 1-(4-(2,2-Dicyanovinyl)phenyl)-1,2,2-triphenylethene (TPE-DCV)
TPE-CHO was prepared according to the previous publication59. A solution of TPE-CHO (180 mg, 0.5 mmol) and malononitrile (66 mg, 1 mmol) in dry EtOH (10 mL) was refluxed under nitrogen for 24 h. After cooling to room temperature, the solvent was evaporated under reduced pressure. The crude product was purified by a silica gel column chromatography using hexane and dichloromethane mixture (10:1 v/v) as eluent and obtained as yellow powder in 74% yield. 1H NMR (400 MHz, DMSO-d6), δ (ppm): 8.41 (s, 1H), 7.76 (d, 2H), 7.19–7.25 (m, 11H), 7.00–7.09 (m, 6H). 13C NMR (100 MHz, CDCl3): δ (ppm): 159.83, 151.91, 144.77, 143.46, 143.43, 143.25, 139.96, 133.16, 131.98, 131.89, 130.99, 129.54, 128.76, 128.45, 128.09, 127.80, 127.77, 114.73, 113.52, 81.98. HRMS (MALDI-TOF): m/z 408.1646 [(M + H)+, calcd 408.1626]. Elemental analysis calcd. for C30H20N2: C, 88.21; H, 4.93; N, 6.86. Found C, 87.94; H, 5.03; N, 6.78.
Preparation of nanoaggregates
Stock solution of TPE-DCV in ethanol with a concentration of 1 mM was prepared. Aliquots of the stock solution were transferred to 10 mL volumetric flasks and appropriate amount of ethanol was added. Water was added dropwise under vigorous stirring to furnish 3 μM TPE-DCV solution with different water contents (0–99 vol%). PL measurement of the resultant solutions was performed immediately.
Preparation for fluorescent measurement
A stock solution (1 mM) of TPE-DCV in ethanol was prepared and used by dilution in ethanol/water mixtures for fluorescence experiments. A solution of TPE-DCV (2.0 mL) was placed in a quartz cuvette (10.0 mm width). After mixing with appropriate amount of each amino acid (0.1 M), emission spectra were recorded at room temperature.
Enzymatic activity assay
A solution of the TPE-DCV and GSSG mixture (2.0 mL) was placed in a quartz cuvette (final concentration: [TPE-DCV] = 3 μM, [GSSG] = 1 mM). Then appropriate amount of glutathione reductase was added into the cuvette. Emission spectra were recorded every 5 min over a period of 100 min.
Cell culture and imaging
HeLa cells were cultured in minimum essential medium containing 10% fetal bovine serum and antibiotics (100 units/mL penicillin and 100 μg/mL streptomycin) in a 5% CO2 humidity incubator at 37°C. The HeLa cells were grown overnight on a plasma-treated 25 mm round cover slip mounted onto a 35 mm Petri dish with an observation window. The living cells were stained with 500 nM TPE-DCV for 5 min. The stained cells were imaged under confocal microscope (Zeiss Laser Scanning Confocal Microscope; LSM7 DUO) using ZEN 2009 software (Carl Zeiss). Excitation wavelength: 405 nm, emission collected: 438–521 nm.
Cell viability evaluated by MTT assay
Viability of the cells was assayed using cell proliferation Kit I with the absorbance of 595 nm being detected using a Perkin-Elmer Victor plate reader. Seven thousand cells were seeded per well in a 96-well plate. After overnight culture, various concentrations of TPE-DCV were added into the 96-well plate. After 12 h treatment, 10 μL of MTT solution (5 mg/mL in phosphate buffer solution) was added into the each well. After 4 h incubation at 37°C, 100 μL of solubilization solution containing 10% SDS and 0.01 M HCl was added to dissolve the purple crystals. After 6 h incubation, the optical density readings at 595 nm were taken using a plate reader. Each of the experiments was performed at least three times.
Author Contributions
X.L., Y.H., S.C. and B.Z.T. designed the research. X.L., S.C., C.W.T.L., N.Z. and B.S. carried out the experiments. X.L., Y.H., S.C., J.W.Y.L. and B.Z.T. analysed data and participitated in the discussion. X.L., Y.H. and B.Z.T. wrote and revised the paper. All authors reviewed the manuscript.
Supplementary Material
Supplementary info
Acknowledgments
This work was partially supported by National Basic Research Program of China (973 Program; 2013CB834701), the Research Grants Council of Hong Kong (604711, 604913, HKUST2/CRF/10 and N_HKUST620/11), and the University Grants Committee of Hong Kong (AoE/P-03/08). B.Z.T. thanks the support from Guangdong Innovative Research Team Program of China (201101C0105067115).
References
- Chen X., Zhou Y., Peng X. & Yoon J. Fluorescent and colorimetric probes for detection of thiols. Chem. Soc. Rev. 39, 2120 (2010). [DOI] [PubMed] [Google Scholar]
- Wang S. P. et al. A colorimetric and fluorescent merocyanine-based probe for biological thiols. Org. Biomol. Chem. 7, 4017 (2009). [DOI] [PubMed] [Google Scholar]
- Meister A. Glutathione metabolism and its selective modification. J. Biol. Chem. 263, 17205 (1988). [PubMed] [Google Scholar]
- MacMicking J., Xie Q. W. & Nathan C. Nitric oxide and macrophage function. Annu. Rev. Immunol. 15, 323 (1997). [DOI] [PubMed] [Google Scholar]
- Winkler B. S., Orselli S. M. & Rex T. S. The redox couple between glutathione and ascorbic acid: a chemical and physiological perspective. Free Radical Biol. Med. 17, 333 (1994). [DOI] [PubMed] [Google Scholar]
- Lu S. C. Regulation of glutathione synthesis. Mol. Aspects Med. 30, 42 (2009). [DOI] [PMC free article] [PubMed] [Google Scholar]
- Townsend D. M., Tew K. D. & Tapiero H. The antioxidant role of selenium and seleno-compounds Biomed. Pharmacother 57, 145 (2003). [DOI] [PMC free article] [PubMed] [Google Scholar]
- Barnham K. J., Masters C. L. & Bush A. I. Neurodegenerative diseases and oxidative stress. Nat. Rev. Drug Discov. 3, 205 (2004). [DOI] [PubMed] [Google Scholar]
- McMahon B. K. & Gunnlaugsson T. Selective Detection of the Reduced Form of Glutathione (GSH) over the Oxidized (GSSG) Form Using a Combination of Glutathione Reductase and a Tb(III)-Cyclen Maleimide Based Lanthanide Luminescent ‘Switch On' Assay. J. Am. Chem. Soc. 134, 10725 (2012). [DOI] [PubMed] [Google Scholar]
- Guo Y., Wang H., Sun Y. & Qu B. A disulfide bound-molecular beacon as a fluorescent probe for the detection of reduced glutathione and its application in cells. Chem. Commun. 48, 3221 (2012). [DOI] [PubMed] [Google Scholar]
- Deng R., Xie X., Vendrell M., Chang Y. T. & Liu X. Intracellular Glutathione Detection Using MnO2-Nanosheet-Modified Upconversion Nanoparticles. J. Am. Chem. Soc. 133, 20168 (2011). [DOI] [PubMed] [Google Scholar]
- Kim G. J., Lee K., Kwon H. & Kim H. J. Ratiometric fluorescence imaging of cellular glutathione. Org. Lett. 13, 2799 (2011). [DOI] [PubMed] [Google Scholar]
- Zhu B. et al. colorimetric and ratiometric fluorescent probe for thiols and its bioimaging applications. Chem. Commun. 46, 5710 (2010). [DOI] [PubMed] [Google Scholar]
- Li Y., Wu P., Xu H. & Zhong X. Anti-aggregation of gold nanoparticle-based colorimetric sensor for glutathione with excellent selectivity and sensitivity. Analyst 136, 196 (2011). [DOI] [PubMed] [Google Scholar]
- Shao N. et al. Design of Bis-spiropyran Ligands as Dipolar Molecule Receptors and Application to in Vivo Glutathione Fluorescent Probes. J. Am. Chem. Soc. 132, 725 (2010). [DOI] [PubMed] [Google Scholar]
- Niu L. Y. et al. BODIPY-Based Ratiometric Fluorescent Sensor for Highly Selective Detection of Glutathione over Cysteine and Homocysteine. J. Am. Chem. Soc. 134, 18928 (2012). [DOI] [PubMed] [Google Scholar]
- Sun Y. Q. et al. Nitroolefin-based coumarin as a colorimetric and fluorescent dual probe for biothiols. Chem. Commun. 47, 11029 (2011). [DOI] [PubMed] [Google Scholar]
- Guy J. et al. Convergent Preparation and Photophysical Characterization of Dimaleimide Dansyl Fluorogens: Elucidation of the Maleimide Fluorescence Quenching Mechanism. J. Am. Chem. Soc. 129, 11969 (2007). [DOI] [PubMed] [Google Scholar]
- Lee M. H. et al. Hepatocyte-Targeting Single Galactose-Appended Naphthalimide: A Tool for Intracellular Thiol Imaging in Vivo. J. Am. Chem. Soc. 134, 1316 (2012). [DOI] [PubMed] [Google Scholar]
- Lim C. S. et al. Ratiometric Detection of Mitochondrial Thiols with a Two-Photon Fluorescent Probe. J. Am. Chem. Soc. 133, 11132 (2011). [DOI] [PubMed] [Google Scholar]
- Pires M. M. & Chmielewski J. Fluorescence imaging of cellular glutathione using a latent rhodamine. Org. Lett. 10, 837 (2008). [DOI] [PubMed] [Google Scholar]
- Zhang J. et al. Synthesis and Characterization of a Series of Highly Fluorogenic Substrates for Glutathione Transferases, a General Strategy. J. Am. Chem. Soc. 133, 14109 (2011). [DOI] [PubMed] [Google Scholar]
- Shao J. et al. A highly selective red-emitting FRET fluorescent molecular probe derived from BODIPY for the detection of cysteine and homocysteine: an experimental and theoretical study. Chem. Sci. 3, 1049 (2012). [Google Scholar]
- Tang B. et al. A Rhodamine-Based Fluorescent Probe Containing a Se−N Bond for Detecting Thiols and Its Application in Living Cells. J. Am. Chem. Soc. 129, 11666 (2007). [DOI] [PubMed] [Google Scholar]
- Zhang M. et al. A highly selective fluorescence turn-on sensor for cysteine/homocysteine and its application in bioimaging. J. Am. Chem. Soc. 129, 10322 (2007). [DOI] [PubMed] [Google Scholar]
- Liu Y. et al. Simple Biosensor with High Selectivity and Sensitivity: Thiol-Specific Biomolecular Probing and Intracellular Imaging by AIE Fluorogen on a TLC Plate through a Thiol–Ene Click Mechanism. Chem. Eur. J. 16, 8433 (2010). [DOI] [PubMed] [Google Scholar]
- Mei J. et al. Discriminatory Detection of Cysteine and Homocysteine Based on Dialdehyde-Functionalized Aggregation-Induced Emission Fluorophores. Chem. Eur. J. 19, 613 (2013). [DOI] [PubMed] [Google Scholar]
- Guo Y. et al. A Fast Response Highly Selective Probe for the Detection of Glutathione in Human Blood Plasma. Sensors 12, 5940 (2012). [DOI] [PMC free article] [PubMed] [Google Scholar]
- Xu H. & Hepel M. “Molecular beacon”-based fluorescent assay for selective detection of glutathione and cysteine. Anal. Chem. 83, 813 (2011). [DOI] [PubMed] [Google Scholar]
- Liu J., Bao C., Zhong X., Zhao C. & Zhu L. Y. Highly selective detection of glutathione using a quantum-dot-based OFF–ON fluorescent probe. Chem. Commun. 46, 2971 (2010). [DOI] [PubMed] [Google Scholar]
- Yao Z., Feng X., Li C. & Shi G. Q. Conjugated polyelectrolyte as a colorimetric and fluorescent probe for the detection of glutathione. Chem. Commun. 5886 (2009). [DOI] [PubMed] [Google Scholar]
- Banerjee S., Kar S., Perez J. M. & Santra S. Quantum Dot-Based OFF/ON Probe for Detection of Glutathione. J. Phys. Chem. C 113, 9659 (2009). [Google Scholar]
- Yi L. et al. A Highly Sensitive Fluorescence Probe for Fast Thiol-Quantification Assay of Glutathione Reductase. Angew. Chem., Int. Ed. 48, 4034 (2009). [DOI] [PubMed] [Google Scholar]
- Ahn Y. H., Lee J. S. & Chang Y. T. Combinatorial Rosamine Library and Application to in Vivo Glutathione Probe. J. Am. Chem. Soc. 129, 4510 (2007). [DOI] [PubMed] [Google Scholar]
- Refsum H., Ueland P. M., Nygard O. & Vollset S. E. Homocysteine and cardiovascular disease. Annu. Rev. Med. 49, 31 (1998). [DOI] [PubMed] [Google Scholar]
- Seshadri S. et al. Plasma Homocysteine as a Risk Factor for Dementia and Alzheimer's Disease. New Engl. J. Med. 346, 476 (2002). [DOI] [PubMed] [Google Scholar]
- Herzenberg L. A. et al. Glutathione deficiency is associated with impaired survival in HIV disease. Proc. Natl. Acad. Sci. USA 94, 1967 (1997). [DOI] [PMC free article] [PubMed] [Google Scholar]
- Luo J. et al. Aggregation-induced emission of 1-methyl-1,2,3,4,5-pentaphenylsilole. Chem. Commun. 1740 (2001). [DOI] [PubMed] [Google Scholar]
- Hong Y., Lam J. W. Y. & Tang B. Z. Aggregation-induced emission. Chem. Soc. Rev. 40, 5361 (2011). [DOI] [PubMed] [Google Scholar]
- Zhao Z., Lam J. W. Y. & Tang B. Z. Aggregation-induced emission of tetraarylethene luminogens. Curr. Org. Chem. 14, 2109 (2010). [Google Scholar]
- Wang M., Zhang G., Zhang D., Zhu D. & Tang B. Z. Fluorescent bio/chemosensors based on silole and tetraphenylethene luminogens with aggregation-induced emission feature. J. Mater. Chem. 20, 1858 (2010). [Google Scholar]
- Xu X. et al. A Strategy for Dramatically Enhancing the Selectivity of Molecules Showing Aggregation-Induced Emission towards Biomacromolecules with the Aid of Graphene Oxide. Chem. Eur. J. 18, 7278 (2012). [DOI] [PubMed] [Google Scholar]
- Cheng X. et al. A “turn-on” fluorescent probe for hypochlorous acid: convenient synthesis, good sensing performance, and a new design strategy by the removal of C = N isomerization. Chem. Commun. 47, 11978 (2011). [DOI] [PubMed] [Google Scholar]
- Shustova N. B., McCarthy B. D. & Dincă M. Turn-On Fluorescence in Tetraphenylethylene-Based Metal–Organic Frameworks: An Alternative to Aggregation-Induced Emission. J. Am. Chem. Soc. 133, 20126 (2011). [DOI] [PubMed] [Google Scholar]
- Chen S. et al. Full-Range Intracellular pH Sensing by an Aggregation-Induced Emission-Active Two-Channel Ratiometric Fluorogen. J. Am. Chem. Soc. 135, 4926 (2013). [DOI] [PubMed] [Google Scholar]
- Shi H. et al. Real-time Monitoring of Cell Apoptosis and Drug Screening Using Fluorescent Light-up Probe with Aggregation-Induced Emission Characteristics. J. Am. Chem. Soc. 134, 17972 (2012). [DOI] [PubMed] [Google Scholar]
- Leung C. W. T. et al. A Photostable AIE Luminogen for Specific Mitochondrial Imaging and Tracking. J. Am. Chem. Soc. 135, 62 (2013). [DOI] [PubMed] [Google Scholar]
- Zhang G., Palmer G. M., Dewhirst M. W. & Fraser C. L. A dual-emissive-materials design concept enables tumour hypoxia imaging. Nat. Mater. 8, 747 (2009). [DOI] [PMC free article] [PubMed] [Google Scholar]
- Lin S. C., Lin T. F., Ho R. M., Chang C. Y. & Hsu C. S. Hierarchical Superstructures with Helical Sense in Self-Assembled Achiral Banana-Shaped Liquid Crystalline Molecules. Adv. Funct. Mater. 21, 3386 (2008). [Google Scholar]
- Hong Y. et al. Monitoring and Inhibition of Insulin Fibrillation by a Small Organic Fluorogen with Aggregation-Induced Emission Characteristics. J. Am. Chem. Soc. 134, 1680 (2012). [DOI] [PubMed] [Google Scholar]
- Wang M., Gu X., Zhang G., Zhang D. & Zhu D. Convenient and continuous fluorometric assay method for acetylcholinesterase and inhibitor screening based on the aggregation-induced emission. Anal. Chem. 81, 4444 (2009). [DOI] [PubMed] [Google Scholar]
- Liu Y. et al. Specific Detection of D-Glucose by a Tetraphenylethene-Based Fluorescent Sensor. J. Am. Chem. Soc. 133, 660 (2011). [DOI] [PubMed] [Google Scholar]
- Yu Y. et al. Cytophilic Fluorescent Bioprobes for Long-Term Cell Tracking. Adv. Mater. 23, 3298 (2011). [DOI] [PubMed] [Google Scholar]
- Qin W. et al. Biocompatible Nanoparticles with Aggregation-Induced Emission Characteristics as Far-Red/Near-Infrared Fluorescent Bioprobes for in Vitro and in Vivo Imaging Applications. Adv. Funct. Mater. 22, 771 (2012). [Google Scholar]
- Hong Y., Lam J. W. Y. & Tang B. Z. Aggregation-induced emission: phenomenon, mechanism and applications. Chem. Commun. 4332 (2009). [DOI] [PubMed] [Google Scholar]
- Leung C. W. T. et al. Superior fluorescent probe for detection of cardiolipin. Anal. Chem. 86, 1253 (2014). [DOI] [PMC free article] [PubMed] [Google Scholar]
- Huang X., Gu X., Zhang G. & Zhang D. A highly selective fluorescence turn-on detection of cyanide based on the aggregation of tetraphenylethylene molecules induced by chemical reaction. Chem. Commun. 48, 12195 (2012). [DOI] [PubMed] [Google Scholar]
- Kim G. J. & Kim H. J. Coumarinyl aldehyde as a Michael acceptor type of colorimetric and fluorescent probe for cyanide in water. Tetrahedron Lett. 51, 2914 (2010). [Google Scholar]
- Hu R. et al. Luminogenic materials constructed from tetraphenylethene building blocks: Synthesis, aggregation-induced emission, two-photon absorption, light refraction, and explosive detection. J. Mater. Chem. 22, 232 (2012). [Google Scholar]
Associated Data
This section collects any data citations, data availability statements, or supplementary materials included in this article.
Supplementary Materials
Supplementary info


