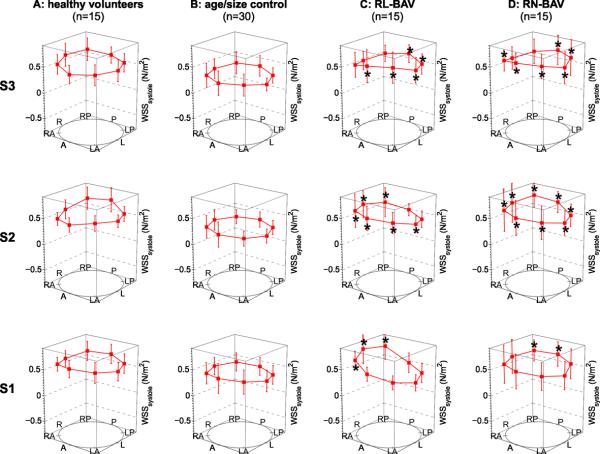
Figure 3.
Segmental systolic wall shear stress (WSS) measurements at the sinotubular junction (analysis plane S1), the mid ascending aorta (S2), and the distal ascending aorta (S3). The individual data points represent mean systolic WSS for patients with bicuspid aortic valves (C,D), aorta size matched controls (B), and healthy volunteers (A) across eight anatomical locations (“A” anterior, “LA” left anterior, “L” left, “LP” left posterior, “P” posterior, “RP” right posterior, “R” right, “RA” right anterior). Error bars represent the standard deviation of inter-individual WSS variation. * indicates statistically significant differences for RL-BAV and RN-BAV cohorts compared to aorta size matched controls (p < 0.0125 after Bonferroni correction).

