

Abstract
Background
The involvement of cytokines in schizophrenia (SZ) has been proposed in recent years and various studies have accumulated convergent lines of evidence. Among which, the role of interleukin-10 (IL-10) in SZ has been explored in a number of studies by investigating association of single nucleotide polymorphisms (SNPs) and susceptibility of SZ. However, the results are inconsistent since its power is limited by the individual sample size. To evaluate the overall effect between them, we conducted a meta-analysis by combining all available studies.
Methods
Studies were searched from the database of PubMed, PsycINFO and ISI web of Knowledge up to Nov 2013. The meta-analysis was conducted based on statement of preferred reporting items for systematic reviews and meta-analyses (PRISMA).
Results
Eleven studies including 6399 subjects (3129 cases and 3270 controls) were available for the meta-analysis. Among three investigated SNPs, rs1800872 was observed to be significantly associated with risk of SZ (AA vs. AC+CC, Pooled OR = 1.351, P-value = 2.06E-04). Meanwhile, among six haplotypes of rs1800896 - rs1800871 - rs1800872, significant associations were observed in haplotype A-C-A (Pooled OR = 1.762, P-value = 2.00E-03) and G-C-C (Pooled OR = 0.649, P-value = 2.00E-03) for Asians. These results were still significant after adjusting for multiple comparisons.
Conclusions
This meta-analysis demonstrated an SNP and two haplotypes of IL-10 significantly associated with SZ, suggesting that IL-10 might be a risk factor of SZ.
Introduction
Schizophrenia (SZ) is a complex psychiatric disorder which affects approximately 1% of the population worldwide [1]. It has been demonstrated that both genetic and environmental factors contribute to SZ, but the etiology is still unclear [2]. To elucidate the pathogenic mechanism of SZ, multiple hypotheses have been proposed such as neurodevelopmental hypothesis [3], dopamine hypothesis [4], glutamate hypothesis [5] and cytokine imbalance hypothesis [6]. Among these theories, the cytokine imbalance hypothesis, which implies that imbalance of cytokines represents a key mechanism involved in the precipitation of schizophrenia-related pathology, is drawing growing attention of researchers, during the past two decades [7]. Cytokines, as key signaling molecules in inflammation, their regulatory effect extends beyond the inflammatory system, impacting also on neurotransmitter metabolism, neurogenesis and the neuroendocrine system [8]–[9].
During these decades, researches from different areas have provided convergent lines of evidence for the involvement of cytokines in SZ. Comprehensive meta-analyses of clinical studies showed that compared with healthy controls, patients with SZ had significant inflammatory cytokine alterations [10]. Furthermore, studies on animal models also indicated that cytokines could induce schizophrenia-like behavior in animals [11]–[12]. Besides, clinical studies demonstrated that antipsychotic drugs could produce anti-inflammatory effects by altering some cytokine levels in SZ patients [13]. Meanwhile, it was also reported that anti-inflammatory drugs could improve the symptoms of SZ patients [14].
Among those investigated cytokines, the involvement of interleukin-10 (IL-10) in SZ has been supported by a variety of evidence. IL-10 was an anti-inflammatory cytokine that regulates the inflammatory response, by inhibiting pro-inflammatory cytokine production [15]. A previous study demonstrated that the genetically enforced expression of IL-10 by macrophages attenuates behavioral abnormalities in a mouse model [16]. Furthermore, comprehensive meta-analyses of clinical studies demonstrated that blood IL-10 levels were significantly decreased in acutely relapsed inpatients of SZ [17]. Meanwhile, it was also observed that blood IL-10 levels were associated with severity of symptoms in SZ patients [18]. Besides, there was also studies reporting that atypical antipsychotics could up-regulate IL-10 level [19].
Both clinical and epidemiological evidence has supported the cytokine imbalance hypothesis. With the emergence of the evidence, abundant genetic researches have been conducted to explore the genetic basis of this hypothesis. Among these cytokines, the role of interleukin-10 (IL-10) in SZ has been explored in a number of studies by investigating association of single nucleotide polymorphisms (SNPs) and susceptibility of SZ [20]–[29]. However, results of individual studies were inconsistent and might not be powerful enough due to the limited sample size. To evaluate the overall effect of IL-10 polymorphisms on SZ, a meta-analysis was conducted in the present study by pooling all available data together.
Materials and Methods
The meta-analysis was conducted according to PRISMA statement (Preferred reporting items for systematic reviews and meta-analyses) [31], including search strategy, selection criteria, data extraction and data analysis.
Search Strategy
The database of PubMed, PsycINFO and ISI web of Knowledge were searched up to November 2013 using the following search terms: (“interleukin 10” OR “interleukin-10” OR “IL10” OR “IL 10” OR “IL-10”) AND “Schizophrenia”. Publication date and publication language were not restricted in our search. Reference lists and supplemental materials were also examined manually to further identify potentially relevant studies. Meanwhile, published genome-wide association studies (GWASs) about schizophrenia were also examined. Furthermore, we also contacted the authors to ask for original genotype data and related information if insufficient data were provided. If overlapped samples were used in different studies, we excluded overlapping samples or keep the study with the largest sample size.
Selection Criteria
Studies aiming to examine the association between IL-10 polymorphisms and susceptibility of SZ were included. Moreover, studies had to fulfill all of the following criteria: 1) a case-control design comparing patients with SZ to controls without mental disorders; 2) patients were diagnosed with well-validated diagnostic criteria (e.g. The Diagnostic and Statistical Manual of Mental Disorders); 3) controls were free of autoimmune or inflammatory diseases; 4) original data of genotype frequencies were published or provided by the authors. Studies were excluded if one of the following existed: 1) studies used family-based or cohort design; 2) samples were cases only; 3) genotype frequencies were neither published nor provided; 4) information is still insufficient for the meta-analysis even after requesting from authors.
Data extraction
All data were extracted independently by two authors according to the inclusion criteria listed above. Disagreements were resolved by discussion between the two authors. The following characteristics were collected from each study: the first author, publication year, geographic region, ethnicity, diagnostic criteria, gender component, sample size, age of cases, age of controls, SNPs/haplotypes investigated, and distribution of genotypes among cases and controls for each involved SNP/haplotype.
Data analysis
The statistical analysis was conducted using STATA 11.0 (Stata Corp LP, College Station, TX, United States). The strength of association was expressed as pooled odds ratio (OR) along with the corresponding 95% confidence interval (CI), which were estimated for each study in a random-effects model or in a fixed-effects model. If there was a significant heterogeneity (P-value <0.1), a random-effects model (the DerSimonian and Laird method) was selected to pool the data. Otherwise, a fixed-effects model (the Mantel-Haenszel method) was selected to pool the data.
As suggested in previous studies [32]–[33], for each polymorphism, pooled ORs were calculated under the following genetic models: additive model (allele a vs. allele A), dominant model (a/a+A/a vs. A/A), recessive model (a/a vs. A/a+A/A), in which “a” represented the minor allele and “A” represented the major allele. The significance of pooled ORs was determined by Z-test and P-value <0.05 was considered as statistically significant. Subgroup analyses were also conducted to assess any moderating effects of ethnicity (Caucasian and Asian) on odds ratios derived from each study if significant heterogeneity was observed in the meta-analysis. Moreover, corrections for multiple comparisons were conducted by the Bonferroni method [34].
Hardy-Weinberg Equilibrium (HWE) in the controls was tested by the chi-square test for goodness of fit, using a previous meta-analysis as reference [35], and a P-value <0.01 was considered as significant deviation from HWE. As deviations from HWE in control subjects may bias the estimates of genetic effects in a meta-analysis [36], sensitivity analysis was conducted to examine such influence by removing studies with significant deviation from HWE in control subjects and recalculating the pooled OR and 95% CI.
Heterogeneity among studies was examined with the χ2 -based Q testing and I2 statistics [37]. P-value <0.1 was considered significant for the χ2-based Q testing and I2 was interpreted as the proportion of total variation contributed by between-study variation [37]. Publication bias was examined with funnel plots and Egger's tests [38]. If there is evidence of publication bias, the funnel plot is noticeably asymmetric. For the Egger's tests, the significance level was set at 0.05.
Results
Study Characteristics
A total of 63 papers were obtained with the initial search of databases. After screening, ten studies fulfilled the inclusion criteria, from which genotype data of three SNPs of IL-10 were obtained [20]–[29]. Furthermore, one dataset of genotype frequencies of one SNP (rs1800872) were also acquired from a genome-wide association study of schizophrenia [30]. Combining data of candidate gene association study with GWAS data, eleven studies with a total of 6399 participants (3129 cases and 3270 controls) were available for this meta-analysis (shown in Table 1). The qualities of these studies were considered accessible for the meta-analysis. The flow chart of selection of studies and reasons for exclusion are presented in Figure 1. Data of three IL-10 SNPs (rs1800896, rs1800871 and rs1800872) and six haplotypes of rs1800896-rs1800871-rs1800872 were meta-analyzed (shown in Table 2). Characteristics of studies and genotype frequencies were presented in Tables 1 and 2 respectively.
Table 1. Characteristics of the included studies.
| Study | Cases | Controls | |||||||||
| Diagnostic | Country | Male | Age | Male | Age | Ref | |||||
| criteria | /Area | Ethnicity | Investigated SNPs | N | (%) | (year) | N | (%) | (year) | ||
| Bocchio(2002) | DSM-IV | Italy | Caucasian | rs1800896, rs1800871, rs1800872 | 106 | NA | NA | 143 | NA | NA | [20] |
| Yu(2004) | DSM-IIIR | China | Asian | rs1800896, rs1800871, rs1800872 | 341 | 54 | 42±16 | 334 | 52 | 42±16 | [21] |
| Shirts(2006) | DSM-IV | USA | Caucasian | rs1800872 | 471 | 65 | 38±10 | 453 | 52 | NA | [22] |
| Peng(2008) | DSM-IV | Taiwan | Asian | rs1800896, rs1800871, rs1800872 | 659 | 70 | 36±11 | 411 | 43 | 45±14 | [23] |
| Ozbey(2009) | DSM-IV | Turkey | Asian | rs1800896, rs1800871, rs1800872 | 171 | 45 | 38±11 | 168 | 45 | 36±15 | [24] |
| Almoguera(2011) | DSM-IV | Spain | Caucasian | rs1800896, rs1800871, rs1800872 | 241 | 63 | NA | 435 | 46 | NA | [25] |
| PGC(CATIE)(2011) | DSM-IV | USA | Caucasian | rs1800872 | 395 | NA | NA | 391 | NA | NA | [30] |
| Jun(2003) | DSM-IV | Korea | Asian | rs1800896 | 233 | 41 | 32 | 181 | 46 | 32 | [26] |
| Jun(2002) | DSM-IV | Korea | Asian | rs1800871 | 141 | NA | NA | 146 | NA | NA | [27] |
| Paul-Samojedny(2010) | DSM-IV | Poland | Caucasian | rs1800896 | 96 | 38 | 45±12 | 120 | 33 | 39±10 | [28] |
| Lung(2011) | DSM-IV | Taiwan | Asian | rs1800896, rs1800871, rs1800872 | 233a | 78 | NA | 433 | 44 | 45±14 | [29] |
PGC(CATIE): data from samples in Clinical Antipsychotic Trials of Intervention Effectiveness of Psychiatric Genomics Consortium; SNPs: single nucleotide polymorphisms; DSM: diagnosis and statistical manual of mental health disorders; NA:not available; aCases after excluding overlapping samples with study [23].
Figure 1. Flow chart of study selection.
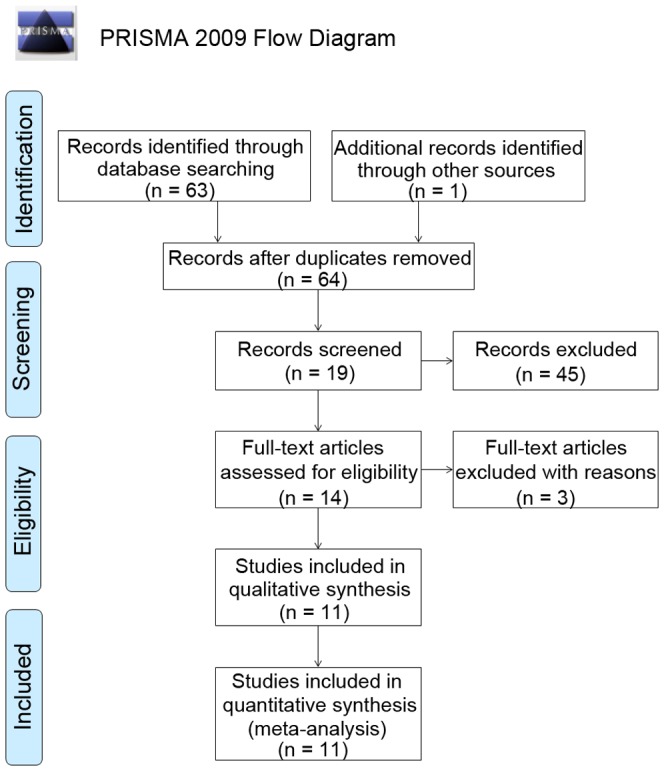
Table 2. Genotype frequencies of investigated SNPs/haplotypes.
| SNP/Haplotype | No. of | Genotype frequencies of SNPs/haplotypes | |||||
| Study | case/control | Genotype | Case | Control | HWE | Ref | |
| rs1800871 | Jun(2002) | 141/146 | CC/CT/TT | 0.092/0.44/0.468 | 0.089/0.425/0.486 | 0.919 | [27] |
| Yu(2004) | 341/334 | 0.170/0.372/0.457 | 0.183/0.392/0.425 | 0.002 | [21] | ||
| Peng(2008) | 659/411 | 0.111/0.358/0.531 | 0.100/0.362/0.538 | 0.031 | [23] | ||
| Ozbey(2009) | 171/173 | 0.170/0.374/0.456 | 0.183/0.391/0.426 | 0.027 | [24] | ||
| rs1800872 | Bocchio(2002) | 106/143 | AA/AC/CC | 0.104/0.349/0.547 | 0.077/0.455/0.469 | 0.378 | [20] |
| Yu(2004) | 341/334 | 0.302/0.513/0.185 | 0.213/0.577/0.210 | 0.004 | [21] | ||
| Shirts(2006) | 471/453 | 0.087/0.321/0.592 | 0.046/0.416/0.538 | 0.057 | [22] | ||
| Peng(2008) | 659/411 | 0.51/0.417/0.073 | 0.496/0.404/0.100 | 0.400 | [23] | ||
| Ozbey(2009) | 171/168 | 0.304/0.515/0.181 | 0.214/0.589/0.196 | 0.064 | [24] | ||
| Almoguera(2011) | 241/244 | 0.091/0.365/0.544 | 0.066/0.367/0.567 | 0.719 | [25] | ||
| PGC(CATIE)(2011) | 395/391 | 0.068/0.359/0.572 | 0.046/0.332/0.621 | 0.908 | [30] | ||
| rs1800896 | Bocchio(2002) | 106/143 | GG/GA/AA | 0.217/0.368/0.415 | 0.084/0.406/0.510 | 0.92 | [20] |
| Jun(2003) | 233/236 | 0.000/0.180/0.820 | 0.017/0.133/0.851 | 0.086 | [26] | ||
| Yu(2004) | 341/334 | 0.000/0.141/0.859 | 0.003/0.141/0.856 | 0.521 | [21] | ||
| Peng(2008) | 659/411 | 0.005/0.060/0.935 | 0.002/0.112/0.886 | 0.719 | [23] | ||
| Ozbey(2009) | 171/168 | 0.000/0.140/0.860 | 0.006/0.143/0.851 | 0.995 | [24] | ||
| Paul-Samojedny(2010) | 96/120 | 0.302/0.635/0.063 | 0.133/0.742/0.125 | <0.001 | [28] | ||
| Almoguera(2011) | 241/278 | 0.141/0.415/0.444 | 0.163/0.506/0.331 | 0.395 | [25] | ||
| Yu(2004) | 341/334 | A-C-A | 0.063 | 0.048 | NA | [21] | |
| Peng(2008) | 659/411 | 0.032 | 0.009 | [23] | |||
| Ozbey(2009) | 171/168 | 0.015 | 0.012 | [24] | |||
| Lung(2011) | 275/433 | 0.013 | 0.009 | [29] | |||
| Bocchio(2002) | 106/143 | A-C-C | 0.321 | 0.413 | NA | [20] | |
| Yu(2004) | 341/334 | 0.246 | 0.259 | [21] | |||
| Peng(2008) | 659/411 | 0.229 | 0.232 | [23] | |||
| Ozbey(2009) | 171/168 | 0.061 | 0.065 | [24] | |||
| Almoguera(2011) | 269/381 | 0.335 | 0.341 | [25] | |||
| Bocchio(2002) | 106/143 | A-T-A | 0.278 | 0.304 | NA | [20] | |
| Yu(2004) | 341/334 | 0.475 | 0.454 | [21] | |||
| rs1800896- | Peng(2008) | 659/411 | 0.688 | 0.685 | [23] | ||
| rs1800871-rs1800872 | Ozbey(2009) | 171/168 | 0.120 | 0.113 | [24] | ||
| Almoguera(2011) | 269/381 | 0.247 | 0.248 | [25] | |||
| Yu(2004) | 341/334 | A-T-C | 0.145 | 0.165 | NA | [21] | |
| Peng(2008) | 659/411 | 0.015 | 0.016 | [23] | |||
| Ozbey(2009) | 171/168 | 0.035 | 0.042 | [24] | |||
| Bocchio(2002) | 106/143 | G-C-C | 0.401 | 0.283 | NA | [20] | |
| Yu(2004) | 341/334 | 0.048 | 0.060 | [21] | |||
| Peng(2008) | 659/411 | 0.034 | 0.054 | [23] | |||
| Ozbey(2009) | 171/168 | 0.012 | 0.015 | [24] | |||
| Almoguera(2011) | 269/381 | 0.314 | 0.411 | [25] | |||
| Lung(2011) | 275/433 | 0.027 | 0.054 | [29] | |||
| Yu(2004) | 341/334 | G-T-A | 0.021 | 0.000 | NA | [21] | |
| Peng(2008) | 659/411 | 0.002 | 0.005 | [23] | |||
| Ozbey(2009) | 171/168 | 0.006 | 0.000 | [24] | |||
HWE: Hardy-Weinberg equilibrium; NA: not applicable.
Meta-analysis of SNPs and association with schizophrenia
The meta-analyses between three SNPs (rs1800896, rs1800871 and rs1800872) and SZ have been conducted, and significant associations were observed only in rs1800872 (allele A vs. allele C, OR = 1.12, P-value = 0.014; A/A vs. C/A+C/C, OR = 1.351, P-value = 2.06E-04). The result of recessive model (A/A vs. C/A+C/C) still remained significant even after correcting for multiple comparison with a P-value of 1.86E-03. No significant associations were observed in other SNPs (See Table 3 and Figure 2).
Table 3. Results of meta-analysis.
| SNP/Haplotype | Genetic model | Meta-analysis | Heterogeneity | Bias | ||
| Pooled OR(95% CI) | P-value | I2 | P-value | P-value | ||
| rs1800096 | allele G vs. allele A | 1.022(0.758 – 1.377) | 0.888 | 74.5% | 0.001 | 0.566 |
| 1.24(0.698 – 2.203) | 0.462a | 89.2% | 0.000 | 0.049 | ||
| 0.868(0.667 – 1.128) | 0.289b | 15.0% | 0.317 | 0.863 | ||
| GG+GA vs. AA | 0.953(0.688 – 1.32) | 0.772 | 64.8% | 0.009 | 0.112 | |
| 1.147(0.537 – 2.449) | 0.723a | 82.7% | 0.003 | 0.322 | ||
| 0.886(0.625 – 1.254) | 0.494b | 45.4% | 0.139 | 0.964 | ||
| GG vs. GA+AA | 1.351(0.621 – 2.942) | 0.448 | 66.1% | 0.007 | 0.747 | |
| 1.858(0.746 – 4.63) | 0.183a | 84.7% | 0.001 | 0.079 | ||
| 0.503(0.119 – 2.127) | 0.350b | 0.0% | 0.447 | 0.187 | ||
| rs1800871 | allele C vs. allele T | 0.98(0.867 – 1.109) | 0.752 | 0.0% | 0.735 | 0.828 |
| CC+CT vs. TT | 0.967(0.822 – 1.139) | 0.688 | 0.0% | 0.797 | 0.837 | |
| CC vs. CT+TT | 0.997(0.785 – 1.267) | 0.980 | 0.0% | 0.888 | 0.917 | |
| rs1800872 | allele A vs. allele C | 1.12(1.023 – 1.225) | 0.014 | 0.0% | 0.471 | 0.744 |
| AA+AC vs. CC | 1.016(0.900 – 1.147) | 0.796 | 21.6% | 0.265 | 0.997 | |
| AA vs. AC+CC | 1.351(1.153 – 1.584) | 2.06E-04 | 19.2% | 0.284 | 0.12 | |
| rs1800896- rs1800871-rs1800872 | G-C-C vs. non G-C-C | 0.784(0.533 – 1.153) | 0.216 | 77.1% | 0.001 | 0.927 |
| 1.042(0.412 – 2.636) | 0.930a | 94.3% | 0.000 | NA | ||
| 0.649(0.494 – 0.853) | 2.00E-03b | 0.0% | 0.759 | 0.561 | ||
| A-C-A vs. non A-C-A | 1.762(1.238 – 2.507) | 2.00E-03b | 44.4% | 0.145 | 0.778 | |
| A-T-C vs. non A-T-C | 0.871(0.674–1.126) | 0.292b | 0.0% | 0.957 | 0.725 | |
| G-T-A vs. non G-T-A | 3.037(0.132–70.084) | 0.488b | 79.0% | 0.008 | 0.263 | |
| A-C-C vs. non A-C-C | 0.927(0.822 – 1.046) | 0.220 | 0.0% | 0.507 | 0.36 | |
| A-T-A vs. non A-T-A | 1.023(0.912–1.147) | 0.699 | 0.0% | 0.914 | 0.528 | |
studies with Caucasian samples were included; bstudies with Asian samples were included; NA: not available; OR: Odds ratio; CI: confidence interval; significant results of pooled ORs are presented in bold.
Figure 2. Forest plots of pooled odds ratios in meta-analysis.

A. Allele A vs. allele C (rs1800872). B. AA vs. AC+CC (rs1800872). C. Haplotype A-C-A (Asian samples). D. Haplotype G-C-C (Asian samples).
Meta-analysis of haplotypes and association with schizophrenia
Among six haplotypes of rs1800896-s1800871-rs1800872 (A-C-A, A-C-C, A-T-A, A-T-C, G-C-C and G-T-A), significant association was observed in haplotype A-C-A (Pooled OR = 1.762, P-value = 2.00E-03) and G-C-C (Pooled OR = 0.649, P-value = 2.00E-03) for Asians and the results were still significant after correcting for multiple comparison with a P-value of 0.012 (See Table 3 and Figure 2); however, no significant association was observed in G-C-C for all samples or Caucasian samples. Besides, no significant association was observed in other haplotypes (See Table 3).
Sensitivity analysis
To determine whether a specific variable would impact the overall results, we compared results before and after removing studies with significant deviation from HWE (rs1800871 and rs1800872 in study [21] and rs1800896 in study [28]). The analysis showed no significant difference, which indicated that the results of the meta-analysis were not biased by studies with significant deviation from HWE (See Table S1).
Heterogeneity and publication bias
Among three SNPs, significant heterogeneity was observed in rs1800896 with P-value <0.1. After stratifying for populations, no significant heterogeneity was observed in Asians, but the heterogeneity was still significant in Caucasians. Similarly, among six haplotypes, significant heterogeneity was observed in G-C-C with P-value <0.1; after stratifying for populations, no significant heterogeneity was observed in Asians, but the heterogeneity was still significant in Caucasians. For publication bias, no significant results were observed with all P-value >0.05 of Egger's test.Besides, funnel plots of SNPs and haplotypes did not show significant publication bias either. Results of heterogeneity and publication bias are shown in Table 3 and Figure S1–S4.
Discussion
Results from the meta-analysis showed a significant association between rs1800872 of IL-10 and risk of SZ, with an OR of 1.351 for genotype A/A, indicating a higher risk with SZ. As there exist difference in allele frequencies of rs1800872 among different ethnic groups (allele A frequency in cases/controls: 0.248∼0.279/0.212∼0.304 in Caucasians; 0.559∼0.719/0.502∼0.6986 in Asians), subgroup analysis was conducted. After stratifying for ethnicity, significant association was still observed under recessive model in both Caucasians (OR = 1.625, P-value = 0.002) and Asians (OR = 1.264, P-value = 0.013), indicating that the significance does not vary across different ethnic groups. Similarly, for rs1800896, no significant results were observed under any genetic model when all samples were included. Considering the difference in allele frequencies among different ethnic groups (allele G frequency in cases/controls: 0.345∼0.620/0.287∼0.504 in Caucasians; 0.035∼0.09/0.058∼0.084 in Asians), subgroup analysis was also conducted. After stratifying for ethnicity, significant results were observed in neither Caucasians nor Asians, suggesting these results did not vary across ethnic groups either. For rs1800871, no significant results were observed, as all included studies were Asian samples (allele C frequency in cases/controls: 0.29∼0.357/0.281∼0.379), the association in other enthic groups were worthy of being investigated further.
Besides, among six haplotypes of rs1800896-rs1800871-rs1800872, two haplotypes, A-C-A and G-C-C, were both observed to be significantly associated with SZ in Asians, with an OR of 1.762 and 0.649 respectively. For haplotype A-C-A (frequency in cases/controls: 0.013∼0.063/0.009∼0.048), A-T-A (frequency in cases/controls: 0.120∼0.688/0.113∼0.685) and A-T-C (frequency in cases/controls: 0.015∼0.145/0.016∼0.165), all included studies were Asian samples. The lack of Caucasian samples was due to the the absence of these haplotypes in Caucasians [39]. For haplotype A-C-C, although haplotype frequency varied across different enthic groups (frequency in cases/controls: 0.321∼0.335/0.341∼0.413 in Caucasians; 0.061∼0.246/0.065∼0.259 in Asians), stratification for ethnicity did not cause any change on the insignificant association with SZ. For haplotype G-C-C, haplotype frequency were also different among ethnic groups (frequency in cases/controls: 0.314∼0.401/0.411∼0.283 in Caucasians; 0.048∼0.012/0.060∼0.015 in Asians), subgroup analysis demonstrated significant association was only observed in Asian samples, indicating that the frequency difference between Caucasians and Asians might be a cause of different association with SZ between these two ethnic groups.
For rs1800872 (-592A/C), an SNP locating within a putative STAT-3 binding site and negative regulatory region of IL-10, it was reported that the C allele of this polymorphism correlates with higher IL-10 production. Furthermore, it was also reported that carriers of haplotype G-C-C had higher IL-10 production [40] – [41]. Combining with results from our meta-analysis, it is suggested that individuals with lower IL-10 production genotypes might have a higher risk of SZ, compared with those with higher IL-10 production genotypes. This was supported by a previous study demonstrating that excessive prenatal levels of IL10 could decrease the risk of behavioral dysfunctions in the grown offspring [16]. In addition, clinical studies also reported anti-inflammatory drugs could improve the symptoms of SZ patients [14], as IL-10 was a cytokine with anti-inflammatory effect [42]. This might be a possible explanation for the higher risk of SZ in carriers with lower IL-10 production genotypes.
There are still some limitations for this study: 1) as limited statistical power is a common problem in genetic association studies, in our meta-analysis, negative results should be interpreted cautiously and still need to be further investigated in larger scale of samples. 2) In some cases, heterogeneity was not resolved after subgroup analyses, suggesting that other factors such as the differences in assays or clinical characteristics might have caused heterogeneity. 3). The lack of clinical information such as age onset of patients made us unable to further investigate the association of diseases with more detailed factors.
Conclusion
As far as we know, this is the first meta-analysis to investigate the association between IL-10 polymorphisms and risk of SZ. In this study, rs1800872 of three investigated SNPs of IL-10 was observed to be significantly associated with SZ. Meanwhile, significant associations were also presented in haplotypes A-C-A and G-C-C among six haplotypes of rs1800896 - rs1800871 - rs1800872 for Asians, even after adjusting for multiple comparisons. The overall effect of this meta-analysis suggested that IL-10 might be a risk factor of SZ. Larger and well-designed studies based on different ethnic groups are needed to confirm our results.
Supporting Information
Funnel plot of rs1800896.
(DOC)
Funnel plot of rs1800871.
(DOC)
Funnel plot of rs1800872.
(DOC)
Funnel plot of six haplotypes of rs1800896- rs1800871-rs1800872.
(DOC)
Results of sensitivity analysis.
(DOC)
PRISMA Checklist.
(DOC)
PRISMA Flow Diagram.
(DOC)
Funding Statement
This research was supported by the Knowledge Innovation Program of the Chinese Academy of Sciences (KSCX2-EW-J-8), the CAS/SAFEA International Partnership Program for Creative Research Teams (Y2CX131003), the Strategic Priority Research Program (B) of the Chinese Academy of Sciences (XDB02030002) and Key Laboratory of Mental Health, Institute of Psychology, Chinese Academy of Sciences. The funders had no role in study design, data collection and analysis, decision to publish, or preparation of the manuscript.
References
- 1. van Os J, Kapur S (2009) Schizophrenia. Lancet 374: 635–645. [DOI] [PubMed] [Google Scholar]
- 2. Karayiorgou M, Gogos JA (1997) A turning point in schizophrenia genetics. Neuron 19: 967–979. [DOI] [PubMed] [Google Scholar]
- 3. Fatemi SH, Folsom TD (2009) The neurodevelopmental hypothesis of schizophrenia, revisited. Schizophr Bull 35: 528–548. [DOI] [PMC free article] [PubMed] [Google Scholar]
- 4. Howes OD, Kapur S (2009) The dopamine hypothesis of schizophrenia: version III-the final common pathway. Schizophr Bull 35: 549–562. [DOI] [PMC free article] [PubMed] [Google Scholar]
- 5. Moghaddam B, Javitt D (2012) From revolution to evolution: the glutamate hypothesis of schizophrenia and its implication for treatment. Neuropsychopharmacology 37: 4–15. [DOI] [PMC free article] [PubMed] [Google Scholar]
- 6. Muller N, Riedel M, Ackenheil M, Schwarz MJ (1999) The role of immune function in schizophrenia: an overview. Eur Arch Psychiatry Clin Neurosci 249 Suppl 462–68. [DOI] [PubMed] [Google Scholar]
- 7. Meyer U, Feldon J, Yee BK (2009) A review of the fetal brain cytokine imbalance hypothesis of schizophrenia. Schizophr Bull 35: 959–972. [DOI] [PMC free article] [PubMed] [Google Scholar]
- 8. Haroon E, Raison CL, Miller AH (2012) Psychoneuroimmunology meets neuropsychopharmacology: translational implications of the impact of inflammation on behavior. Neuropsychopharmacology 37: 137–162. [DOI] [PMC free article] [PubMed] [Google Scholar]
- 9. Luo XJ, Li M, Huang L, Nho K, Deng M, et al. (2012) The interleukin 3 gene (IL3) contributes to human brain volume variation by regulating proliferation and survival of neural progenitors. PLoS One 7: e50375. [DOI] [PMC free article] [PubMed] [Google Scholar]
- 10. Potvin S, Stip E, Sepehry AA, Gendron A, Bah R, et al. (2008) Inflammatory cytokine alterations in schizophrenia: a systematic quantitative review. Biol Psychiatry 63: 801–808. [DOI] [PubMed] [Google Scholar]
- 11. Watanabe Y, Someya T, Nawa H (2010) Cytokine hypothesis of schizophrenia pathogenesis: evidence from human studies and animal models. Psychiatry Clin Neurosci 64: 217–230. [DOI] [PubMed] [Google Scholar]
- 12. Nawa H, Takei N (2006) Recent progress in animal modeling of immune inflammatory processes in schizophrenia: implication of specific cytokines. Neurosci Res 56: 2–13. [DOI] [PubMed] [Google Scholar]
- 13.Tourjman V, Kouassi E, Koue ME, Rocchetti M, Fortin-Fournier S, et al.. (2013) Antipsychotics' effects on blood levels of cytokines in schizophrenia: A meta-analysis. Schizophr Res. [DOI] [PubMed]
- 14.Sommer IE, van Westrhenen R, Begemann MJ, de Witte LD, Leucht S, et al.. (2013) Efficacy of Anti-inflammatory Agents to Improve Symptoms in Patients With Schizophrenia: An Update. Schizophr Bull. [DOI] [PMC free article] [PubMed]
- 15. Fiorentino DF, Zlotnik A, Vieira P, Mosmann TR, Howard M, et al. (1991) IL-10 acts on the antigen-presenting cell to inhibit cytokine production by Th1 cells. J Immunol 146: 3444–3451. [PubMed] [Google Scholar]
- 16. Meyer U, Murray PJ, Urwyler A, Yee BK, Schedlowski M, et al. (2008) Adult behavioral and pharmacological dysfunctions following disruption of the fetal brain balance between pro-inflammatory and IL-10-mediated anti-inflammatory signaling. Mol Psychiatry 13: 208–221. [DOI] [PubMed] [Google Scholar]
- 17. Miller BJ, Buckley P, Seabolt W, Mellor A, Kirkpatrick B (2011) Meta-analysis of cytokine alterations in schizophrenia: clinical status and antipsychotic effects. Biol Psychiatry 70: 663–671. [DOI] [PMC free article] [PubMed] [Google Scholar]
- 18. Dimitrov DH, Lee S, Yantis J, Valdez C, Paredes RM, et al. (2013) Differential correlations between inflammatory cytokines and psychopathology in veterans with schizophrenia: Potential role for IL-17 pathway. Schizophr Res 151: 29–35. [DOI] [PubMed] [Google Scholar]
- 19. Sugino H, Futamura T, Mitsumoto Y, Maeda K, Marunaka Y (2009) Atypical antipsychotics suppress production of proinflammatory cytokines and up-regulate interleukin-10 in lipopolysaccharide-treated mice. Prog Neuropsychopharmacol Biol Psychiatry 33: 303–307. [DOI] [PubMed] [Google Scholar]
- 20. Bocchio Chiavetto L, Boin F, Zanardini R, Popoli M, Michelato A, et al. (2002) Association between promoter polymorphic haplotypes of interleukin-10 gene and schizophrenia. Biol Psychiatry 51: 480–484. [DOI] [PubMed] [Google Scholar]
- 21. Yu L, Yang MS, Zhao J, Shi YY, Zhao XZ, et al. (2004) An association between polymorphisms of the interleukin-10 gene promoter and schizophrenia in the Chinese population. Schizophr Res 71: 179–183. [DOI] [PubMed] [Google Scholar]
- 22. Shirts BH, Bamne M, Kim JJ, Talkowski M, Wood J, et al. (2006) A comprehensive genetic association and functional study of TNF in schizophrenia risk. Schizophr Res 83: 7–13. [DOI] [PubMed] [Google Scholar]
- 23. Peng HY, Ku YC, Shu BC, Lung FW (2008) Association between Interleukin-10 Gene Promoter Haplotype and Schizophrenia in a Han-Chinese Study. Int J Biomed Sci 4: 185–191. [PMC free article] [PubMed] [Google Scholar]
- 24. Ozbey U, Tug E, Namli M (2009) Interleukin-10 gene promoter polymorphism in patients with schizophrenia in a region of East Turkey. World J Biol Psychiatry 10: 461–468. [DOI] [PubMed] [Google Scholar]
- 25. Almoguera B, Riveiro-Alvarez R, Lopez-Castroman J, Dorado P, Lopez-Rodriguez R, et al. (2011) ATA homozigosity in the IL-10 gene promoter is a risk factor for schizophrenia in Spanish females: a case control study. BMC Med Genet 12: 81. [DOI] [PMC free article] [PubMed] [Google Scholar]
- 26. Jun TY, Pae CU, Kim KS, Han H, Serretti A (2003) Interleukin-10 gene promoter polymorphism is not associated with schizophrenia in the Korean population. Psychiatry Clin Neurosci 57: 153–159. [DOI] [PubMed] [Google Scholar]
- 27. Jun TY, Pae CU, Chae JH, Bahk WM, Kim KS, et al. (2002) Report on IL-10 gene polymorphism at position -819 for major depression and schizophrenia in Korean population. Psychiatry Clin Neurosci 56: 177–180. [DOI] [PubMed] [Google Scholar]
- 28. Paul-Samojedny M, Kowalczyk M, Suchanek R, Owczarek A, Fila-Danilow A, et al. (2010) Functional polymorphism in the interleukin-6 and interleukin-10 genes in patients with paranoid schizophrenia-a case-control study. J Mol Neurosci 42: 112–119. [DOI] [PubMed] [Google Scholar]
- 29. Lung FW, Yang MC, Shu BC (2011) The interleukin 10 promoter haplotype ACA and the long-form variant of the DRD4 uVNTR polymorphism are associated with vulnerability to schizophrenia. Psychiatry Res 188: 294–296. [DOI] [PubMed] [Google Scholar]
- 30. Schizophrenia Psychiatric Genome-Wide Association Study C (2011) Genome-wide association study identifies five new schizophrenia loci. Nat Genet 43: 969–976. [DOI] [PMC free article] [PubMed] [Google Scholar]
- 31. Moher D, Liberati A, Tetzlaff J, Altman DG (2009) Group P (2009) Preferred reporting items for systematic reviews and meta-analyses: the PRISMA statement. PLoS Med 6: e1000097. [DOI] [PMC free article] [PubMed] [Google Scholar]
- 32. Attia J, Thakkinstian A, D'Este C (2003) Meta-analyses of molecular association studies: methodologic lessons for genetic epidemiology. J Clin Epidemiol 56: 297–303. [DOI] [PubMed] [Google Scholar]
- 33. Thakkinstian A, McElduff P, D'Este C, Duffy D, Attia J (2005) A method for meta-analysis of molecular association studies. Stat Med 24: 1291–1306. [DOI] [PubMed] [Google Scholar]
- 34. Bland JM, Altman DG (1995) Multiple significance tests: the Bonferroni method. BMJ 310: 170. [DOI] [PMC free article] [PubMed] [Google Scholar]
- 35. Verhagen M, van der Meij A, van Deurzen PA, Janzing JG, Arias-Vasquez A, et al. (2010) Meta-analysis of the BDNF Val66Met polymorphism in major depressive disorder: effects of gender and ethnicity. Mol Psychiatry 15: 260–271. [DOI] [PubMed] [Google Scholar]
- 36. Zintzaras E (2010) Impact of Hardy-Weinberg equilibrium deviation on allele-based risk effect of genetic association studies and meta-analysis. Eur J Epidemiol 25: 553–560. [DOI] [PubMed] [Google Scholar]
- 37. Higgins JP, Thompson SG (2002) Quantifying heterogeneity in a meta-analysis. Stat Med 21: 1539–1558. [DOI] [PubMed] [Google Scholar]
- 38. Egger M, Davey Smith G, Schneider M, Minder C (1997) Bias in meta-analysis detected by a simple, graphical test. BMJ 315: 629–634. [DOI] [PMC free article] [PubMed] [Google Scholar]
- 39. Rood MJ, Keijsers V, van der Linden MW, Tong TQ, Borggreve SE, et al. (1999) Neuropsychiatric systemic lupus erythematosus is associated with imbalance in interleukin 10 promoter haplotypes. Ann Rheum Dis 58: 85–89. [DOI] [PMC free article] [PubMed] [Google Scholar]
- 40. Crawley E, Kay R, Sillibourne J, Patel P, Hutchinson I, et al. (1999) Polymorphic haplotypes of the interleukin-10 5′ flanking region determine variable interleukin-10 transcription and are associated with particular phenotypes of juvenile rheumatoid arthritis. Arthritis Rheum 42: 1101–1108. [DOI] [PubMed] [Google Scholar]
- 41. Edwards-Smith CJ, Jonsson JR, Purdie DM, Bansal A, Shorthouse C, et al. (1999) Interleukin-10 promoter polymorphism predicts initial response of chronic hepatitis C to interferon alfa. Hepatology 30: 526–530. [DOI] [PubMed] [Google Scholar]
- 42. Ghasemi H, Ghazanfari T, Yaraee R, Owlia P, Hassan ZM, et al. (2012) Roles of IL-10 in ocular inflammations: a review. Ocul Immunol Inflamm 20: 406–418. [DOI] [PubMed] [Google Scholar]
Associated Data
This section collects any data citations, data availability statements, or supplementary materials included in this article.
Supplementary Materials
Funnel plot of rs1800896.
(DOC)
Funnel plot of rs1800871.
(DOC)
Funnel plot of rs1800872.
(DOC)
Funnel plot of six haplotypes of rs1800896- rs1800871-rs1800872.
(DOC)
Results of sensitivity analysis.
(DOC)
PRISMA Checklist.
(DOC)
PRISMA Flow Diagram.
(DOC)