

Abstract
Glycomics, a comprehensive study of glycans expressed in biological systems, is emerging as a simple yet highly sensitive diagnostic tool for disease onset and progression. This study aimed to use glycomics to investigate glycan markers that would differentiate patients with gastric cancer (GC) from those with non-atrophic gastritis (NAG). Patients with duodenal ulcer (DU) were also included because they are thought to represent a biologically different response to infection with Helicobacter pylori, a bacterial infection that can cause either GC or DU. We collected 72 serum samples from patients in Mexico City that presented with NAG, DU, or GC. N-glycans were released from serum samples using the generic method with PNGase F and were analyzed by MALDI FT-ICR MS. The corresponding glycan compositions were calculated based on accurate mass. ANOVA based statistical analysis was performed to identify potential markers for each sub-group. Nineteen glycans were significantly different among the diagnostic groups. Generally, decreased levels of high-mannose type glycans, glycans with one complex type antenna, bigalactosylated biantennary glycans, and increased levels of non-galactosylated biantennary glycans were observed in gastric cancer cases. Altered levels of serum glycans were also observed in DU, but differences were generally in the same direction as GC. Serum glycan profiles may provide biomarkers to differentiate GC cases from controls with NAG. Further studies will be needed to validate these findings as biomarkers and identify the role of protein glycosylation in GC pathology.
INTRODUCTION
Gastric cancer (GC) is the second most common cause of cancer-related death, with nearly 1 million cases and over 700,000 deaths each year worldwide (1-4). Although the incidence of gastric cancer in industrialized countries has declined markedly over the past 50 years, it remains a major cause of morbidity and mortality, particularly in less developed countries in Asia, Eastern Europe, and Latin America (5). Two main histologic groups of gastric cancer have been recognized, the intestinal (well-differentiated) type and the diffuse type (6). Intestinal type cancer is more common, particularly in the elderly, and it progresses through a series of histologic stages that begins with gastritis and progresses over decades to atrophy (loss of glands), intestinal metaplasia, dysplasia, and finally adenocarcinoma (7).
The observation that gastric cancer may have an environmental etiology, and that it is associated with chronic gastritis, were brought together by the discovery of H. pylori in 1983 (8). Helicobacter pylori infects the gastric epithelium of approximately 50% of the world’s population and uniformly causes non-atrophic gastritis (NAG), which in some cases progresses to atrophic gastritis and gastric adenocarcinoma. Seroepidemiologic observations now convincingly demonstrate that H. pylori infection is associated with an approximately 6-fold increased risk of gastric cancer (9). These studies have been supported by in vivo experiments in animal models (10, 11), and by large intervention trials to evaluate the effects of H. pylori eradication in prevention of gastric cancer (12). Interestingly, H. pylori infection also causes peptic ulcer disease, but while gastric cancer and peptic ulcer are both associated with H. pylori, they are inversely associated with one another (13). Although the reasons for this are not well understood, patients with ulcer disease provide a valuable comparison group because they appear to have a different host response to H. pylori infection than patients that develop gastric cancer or those who remain asymptomatically infected.
Gastric cancer produces no specific symptoms in its early stages when it is surgically curable, and most cases present with locally advanced or metastatic disease, which in the United States has a 5-year survival of less than 26.9% (14). Therefore, early detection and preventive strategies offer the best opportunity to decrease mortality from gastric cancer. Moreover, since most of those infected with H. pylori do not develop cancer or peptic ulcer, and since universal intervention against H. pylori is not practical, and may even be harmful (15), there is a need for biomarkers to identify the subpopulation of those infected with H. pylori who are most at risk for development of gastric cancer. The best currently available biomarker for gastric cancer is a decrease in the ratio of serum pepsinogens I and II (PGI/PGII), which is an indication of atrophic gastritis. However, while the PGI/PGII ratio is a sensitive and specific measure of gastric atrophy (16), it is a very poor predictor of gastric cancer. This is best illustrated by a meta-analysis of 42 individual studies involving nearly 300,000 participants in population based screening, which showed that the positive predictive value of PGI/PGII was only 0.77-1.25%, so that 600 individuals would have to be screened to detect one case of gastric cancer (17). Accuracy may be improved by using PGI/PGII together with serologic evidence of H. pylori infection (18, 19), but still the positive predictive value is low, and novel biomarkers are needed.
An alternative approach to proteins, which have been the main focus of biomarker studies for decades, is detection of changes in protein glycosylation (20, 21). Glycans are complex bio-oligomers consisting of up to ten monosaccharide residues that participate in key biological processes, such as cell-cell interactions, protein folding, and the targeting of degradative 22-29) as many studies suggest that glycans play key roles in numerous diseases, including cancer and inflammatory diseases (28, 30-32). Mass spectrometry (MS) analysis of glycans provides sensitive and accurate detection in many complex biological matrices, including human serum (33, 34). The majority of serum proteins are glycosylated, and changes in glycosylation are important indicators of health (35). Matrix-assisted laser desorption/Ionization (MALDI) Fourier transform-ion cyclotron resonance (FT-ICR) has been shown to be a fast and accurate method for glycan detection (30, 36-39), where enzymatic release of glycans yields complex mixtures that can be detected and identified by MS (30-32, 36, 40-49). Here we sought to evaluate the utility of MS for detection of native N-glycans in serum as biomarkers to distinguish patients with gastric cancer (GC) from those with non-atrophic gastritis (NAG); patients with duodenal ulcer (DU) were also included since they appear to represent a different biological response to H. pylori infection.
MATERIALS and METHODS
Sample Collection
Patients
Human sera were obtained from patients attending the Gastroenterology Unit of the Mexico General Hospital, Secretaria de Salud and the Oncology Hospital, Instituto Mexicano del Seguro Social, both in Mexico City, from October 1999 to July 2002 (50). Patients were at least 30 years old and sought attention due to gastroduodenal symptoms or because of probable GC, and were scheduled for endoscopy and gastric biopsy for diagnostic purposes. All participants signed informed consent to participate in the protocol, which was approved by the Research and Ethics Committee of the Hospital General de Mexico, Secretaria de Salud, or the Oncology Hospital at Instituto Mexicano del Seguro Social.
Clinical and histopathologic diagnosis
Gastric biopsies were obtained systematically from six defined locations in the gastric antrum, corpus, and transitional zone, and also from the location of a lesion, if one was identified during endoscopy (50). Biopsies from each location were formalin fixed, paraffin embedded, and stained with Hematoxylin and Eosin for histopathologic evaluation and classification according to the updated Sydney system by a single experienced pathologist (51). Final diagnosis was that of the most severe histologic lesion or based on endoscopy findings in the cases of duodenal ulcer.
Serum samples and H. pylori serology
A 5 mL blood sample was drawn from each patient, and serum was obtained and frozen at −80° C until tested. Serum samples were tested by ELISA for IgG antibodies against H. pylori whole cell antigens as previously described (52).
Glycan Release from Human Serum
Rapid and reproducible N-glycan profiling was performed using previously described methods (46). Briefly, 50 μL of serum was added to an equal volume of aqueous 200 mM ammonium bicarbonate containing 10 mM dithiothreitol solution. The mixture was thermally denatured by alternating between a 100 °C and 25 °C water bath for 12 cycles of 10 sec each. Next, 2 μL of PNGase F (New England Biolabs, Ipswich, MA) was added and the mixture was incubated in a microwave reactor (CEM, Matthews, NC) for 10 min at 20 watts and 60 °C. Finally, 400 μL of cold ethanol was added and the mixture was placed at −80 °C for 1 hr to precipitate the deglycosylated proteins. Following centrifugation, released N-glycans were isolated in the supernatant fraction and dried using a vacuum evaporator.
Purification and Enrichment of N-Glycans
The purification of released N-glycans were performed by graphitized carbon solid-phase extraction using an automated GX-274 ASPEC liquid handler (Gilson, Middleton, WI)(46). Initially, the graphitized carbon cartridges (GCC) were washed with a solution of 80% acetonitrile (ACN) in 0.10% trifluoroacetic acid (v/v). Then, GCC were conditioned with pure water. After loading aqueous N-glycan solutions onto the cartridge, GCC were washed with pure water at a flow rate of approximately 1 mL/min to remove salts and buffer. Purified and enriched serum N-glycans were eluted into three fractions containing 6-mL solutions of 10%, 20%, and 40% acetonitrile in 0.05% trifluoroacetic acid (v/v) in water, respectively. The three fractions were then dried using vacuum evaporator and analyzed separately by mass spectrometry.
Mass Spectrometric N-Glycan Analysis by MALDI FT-ICR MS
Mass spectrometric analysis was performed using methods described previously (30, 31, 46, 49). Briefly, the mass spectrometric analysis was performed using a MALDI-FT-ICR MS instrument (HiResMALDI, IonSpec Corporation, Irvine, CA) equipped with a 7.0 T superconducting magnet and a pulsed Nd:YAG laser. 2,5-dihydroxybenzoic acid (DHB) was used as the ionizing matrix for both positive and negative mode MS and a cation dopant (NaCl) was used for neutral oligosaccharide analyses in the positive mode. Five replicate spectrometric analyses were performed for each serum sample.
Bioinformatics
The raw mass spectra were imported into an in-house program, the Glycolyzer, which performs a high mass accuracy spectra calibration using six N-glycan compositions that are abundant, span the mass range, and are found in all spectra (53). The calibrated spectra were then exported as text files and loaded into the FTICRMS package in R 2.14.2 (54) for additional processing (peak identification, baseline identification, data transformation, and normalization) and statistical analysis.
Peaks were identified in each spectrum using finding five consecutive data points, which when fit with a least-squares quadratic function had a coefficient of determination R2 ≥ 0.98. This approach was previously validated (62) and identifies unique peaks that form a parabolic function. A baseline level was calculated for each spectrum by using a method specifically designed for MALDI FT-ICR spectra, the BXR algorithm (55). Peaks at a given mass were divided into signal peaks and noise peaks by a threshold of 3.798194 times the estimated baseline level at that mass, which is roughly equivalent to being 4.5 standard deviations above the mean for data following a normal distribution (56).
A logarithmic transformation was used on the glycan signals prior to statistical analysis. In each fraction separately, all masses that were signal peaks in all 360 spectra (N=72 × 5 replicates per sample) were used as the normalization peaks. In each spectrum, the logarithmic values of these peaks were averaged and that value subtracted from each detected peak in that spectrum. Post-normalization, the replicates for each glycan and each patient were combined into a single value using the maximum of the five replicate intensities for each glycan in each patient.
For each glycan, the following four-way analysis of variance (ANOVA) model was constructed:
Samples were processed in 6 batches (with 12 samples each) and the samples were selected according to 4 age categories (30–39, 40–49, 50–59, 60–90). We initially considered intestinal and diffuse gastric cancer as separate diagnostic categories, but since no statistically significant differences were observed, we combined them in order to obtain more statistical power, Thus, the final analysis was performed using a three-category diagnostic variable (NAG, DU, GC). The batches were exactly balanced with respect to diagnosis and roughly balanced with respect to sex and age groups. Between 20 and 50 glycans were detected in each fraction, so multiple testing correction using the method of Benjamini and Hochberg (57) was applied to control the false discovery rate (FDR) in each fraction at 10%. A glycan was declared significantly different among the three diagnostic groups if the FDR-adjusted p-value of the F-test was less than 0.1. Once diagnosis was declared statistically significant, differences among the three diagnosis classes were identified by the Tukey-Kramer method (58).
RESULTS and DISCUSSION
Clinical sample
A subset of serum samples was selected from patients with NAG (N=18), DU (N=18), and GC (N=36), which included equal numbers of patients with the intestinal and diffuse histologic forms of gastric cancer. Patients with DU were included because they are unlikely to develop GC and thus might be useful to identify a glycan signature that is protective. Patients with NAG and DU were age and sex matched, but this was not possible for GC patients because they are typically older and predominantly male (Table 1). The overall seroprevalence of H. pylori was 75% (Table 1). Since patients with NAG are generally not thought to have disease associated with H. pylori, which uniformly causes gastritis, and since the prevalence of H. pylori in Mexico and other Latin American countries is very high (59), NAG patients in effect served as healthy controls.
Table 1.
Patient demographics and clinical profiles
| Diagnostic Category |
N | Mean Age | Sex | H. pylori (+) | |
|---|---|---|---|---|---|
| M | F | ||||
| Non-Atrophic Gastritis |
18 | 46 | 10 | 8 | 15 |
| Duodenal Ulcer | 18 | 53 | 9 | 9 | 16 |
| Gastric Cancer | |||||
| Intestinal | 18 | 68 | 12 | 6 | 8 |
| Diffuse | 18 | 57 | 12 | 6 | 15 |
| Total | 72 | 56 | 43 | 29 | 54 |
Serum N-glycan profile
Figure 1 shows representative MALDI spectra of the serum N-glycans identified in serum of patients with GC, including neutral glycans from the 10% (A) and 20% (B) ACN fractions analyzed by positive mode MALDI MS, and acidic glycans obtained from 40% ACN fractions (C) analyzed in negative mode. Neutral glycans consisting of only Hex and HexNAc and mono-fucosylated complex type glycans were dominant in the 10% and 20% fractions, while glycans containing sialic acid residues were dominant in the 40% ACN fraction. The full list of isolated serum glycans is shown in Supplementary Table 1. The majority of the glycans found were complex and high mannose type N-glycans in the range of Hexose (Hex)3-10: N-Acetylhexosamine (HexNAc)2-6: Fucose (Fuc)0-3: Sialic Acid (NeuAc)0-2 as typically observed in serum glycan studies (32, 43, 44, 47). Interestingly, four masses were observed that would correspond to fucosylated high mannose type glycans with the compositions HexNAc2: Hex6-9 Fuc 1. Fucosylated high mannose type glycans have not been reported in serum but have been observed in tissue from colon cancer patients (60) and on a placental protein (61), but the presence of these structures in human serum has not been reported. However, no tandem mass spectra confirming the presence of these unusual structures could be obtained, and we are left only with accurate masses. We have not included these signals for further statistical analysis.
Figure 1. Representative MALDI-FTICR mass spectra of the three different fractions (10% (A), 20% (B) and 40% (C)).

The peaks of highest abundance have been structurally annotated with putative structures in terms of N-acetylglucosamine, mannose, galactose, fucose and N-acetylneuraminic acids. No linkage information is obtained; therefore putative linkages are displayed.
Candidate glycan markers for gastric cancer
Glycan peaks were determined quantitatively in the 10%, 20%, and 40% fractions according to accurate masses, using methods described previously and confirmed by tandem MS (30, 31, 49). Of the serum glycans detected (Supplementary Table 1), only those identified in at least two patients are included in the statistical analysis. ANOVA (56, 62) was used to identify disease-specific glycans. Table 2 lists the mean and 95% confidence intervals for the difference between NAG and each of DU and GC on the raw scale for the unique glycans that showed statistically significant differences (FDR 10%) for diagnosis. Overall, the ANOVA demonstrated significant differences for 19 glycans. Three statistically significant glycans were detected in both 10% and 20% ACN fractions (166.622, 1770.662, and 1786.657), though the results were similar (Table 2).
Table 2.
Statistically significant glycans and corresponding putative structures.
| [M] | ACN | Category Composition |
Putative Structure |
P | Duodenal Ulcer | Gastric Cancer | ||
|---|---|---|---|---|---|---|---|---|
| FDR Adj |
(%) | 95% CI | (%) | 95% CI | ||||
| 1234.426 | 10% | High Mannose 5Hex,2HexNAc |
|
0.093 | −43.6 | −69.6 , 4.5 |
−37.5 | −63.4, 6.6 |
| 1275.455 | 10% | Complex 4Hex,3HexNAc |
|
0.044 | −37.9 | −60.4, − 2.7 |
−33.3 | −54.8, −1.6 |
| 1396.488 | 10% | High Mannose 6Hex,2HexNAc |
|
0.008 | −47.3 | −67.4, − 14.9 |
−45.8 | −64.2, − 18.0 |
| 1421.520 | 10% | Complex 4Hex,3HexNAc,1Fuc |

|
0.025 | −30.2 | −49.7, − 3.1 |
−28.6 | −46.2, −5.2 |
| 1437.510 | 10% | Hybrid 5Hex,3HexNAc |
|
0.008 | −41.6 | −60.9, − 12.8 |
−43.0 | −59.8, − 19.4 |
| 1462.547 | 20% | Complex 3Hex,4HexNAc,1Fuc |
|
0.004 | 16.4 | −24.6, 79.9 |
80.8 | 24.7, 162.0 |
| 1519.587 | 20% | Complex 3Hex,5HexNAc |
|
0.054 | 25.8 | −10.6, 76.9 |
42.8 | 6.7, 91.1 |
| 1558.549 | 10% | High Mannose 7Hex,2HexNAc |
|
0.008 | −32.8 | −54.3, − 1.4 |
−39.3 | −56.5, − 15.3 |
| 1599.587 | 20% | Hybrid 6Hex,3HexNAc |
|
0.044 | −10.5 | −39.9, 33.2 |
35.2 | −3.7, 89.9 |
| 1624.596 | 10% | Complex 4Hex,4HexNAc,1Fuc |

|
0.076 | −18.3 | −40.2, 11.7 |
−24.6 | −42.5, −1.2 |
| 1640.602 | 10% | Complex 5Hex,4HexNAc |
|
0.018 | −14.0 | −38.1, 19.3 |
−31.3 | −48.3, −8.8 |
| 1665.622 | 10% | Complex 3Hex,5HexNAc,1Fuc |
|
0.008 | 29.8 | 2.5, 64.4 | 35.9 | 10.7, 66.7 |
| 1665.622 | 20% | Complex 3Hex,5HexNAc,1Fuc |
|
0.030 | 22.6 | −23.0, 95.3 |
69.9 | 14.2, 152.7 |
| 1720.595 | 10% | High Mannose 8Hex,2HexNAc |

|
0.044 | −21.8 | −44.7, 10.5 |
−29.4 | −47.7, −4.7 |
| 1770.662 | 10% | Complex 4Hex,4HexNAc,2Fuc |
|
0.032 | −5.5 | −28.9, 25.7 |
−23.9 | −40.5, −2.5 |
| 1770.662 | 20% | Complex 4Hex,4HexNAc,2Fuc |
|
0.030 | −33.3 | −53.7, − 3.9 |
−33.8 | −51.5, −9.6 |
| 1786.657 | 10% | Complex 5Hex,4HexNAc,1Fuc |
|
0.008 | −18.1 | −45.1, 22.1 |
−40.5 | −57.9, − 15.9 |
| 1786.657 | 20% | Complex 5Hex,4HexNAc,1Fuc |
|
0.056 | −26.8 | −47.3, 1.5 | −27.7 | −45.3, −4.4 |
| 1843.676 | 10% | Complex 5Hex,5HexNAc |
|
0.072 | −7.5 | −31.7, 25.2 |
−22.9 | −40.7, 0.2 |
| 1882.650 | 10% | High Mannose 9Hex,2HexNAc |
|
0.020 | −20.1 | −45.5, 17.1 |
−35.5 | −53.7, − 10.2 |
| 1948.723 | 10% | Hybrid 6Hex,4HexNAc,1Fuc |
|
0.025 | −26.6 | −46.5, 0.7 | −29.3 | −46.2, −7.0 |
| 2660.913 | 40% | Complex 7Hex,6HexNac,1NeuAc |

|
0.050 | −22.9 | −38.3, 3.7 | 1.3 | −16.4, 22.9 |
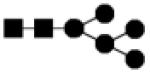
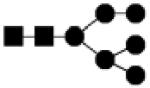
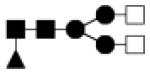
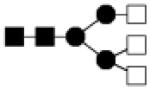
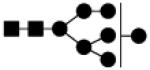
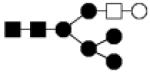
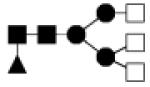
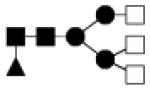
● Mannose (Man) ■ N-acetylglucosamine (GlcNAc) ○Hexose (Hex) □ N-acetylhexosamine (HexNAc) ▲ Fucose (Fuc) ◆ Sialic acid (NeuAc)
Since the results for the intestinal and diffuse forms of GC were similar (Supplementary Figure 1), with no statistically significant differences between the two types of cancer, all GC patients were combined in order to increase statistical power. For both GC and DU, the mean differences with NAG was calculated, together with 95% confidence intervals for the difference obtained using the Tukey-Kramer method. The results plotted on a log2 scale are shown in Figure 2, which represents diagrammatically the data for the unique glycans shown in Table 2. Putative structures corresponding to the molecular masses are provided in Table 2. In total, six glycans were shown to be present at significantly altered levels in the serum of DU cases compared to NAG controls, while the levels of fifteen glycans were shown to be altered significantly with GC. No differences were found between GC and DU, and changes in glycan expression were almost uniformly in the same direction for both DU and GC, suggesting that the different clinical pathways of these two disease states are not associated with different glycan signatures. Most glycans that differed significantly between DU or GC, compared to NAG, showed a decrease in abundance (e.g., 1396.488, 1421.520, 1437.510), though significant increases were sometimes apparent (e.g., 1462.547 and 1519.588) (Table 2). .
Figure 2. Glycans with differential levels in serum from DU and GC relative to NAG according to ANOVA analysis.

Mean difference and 95% confidence intervals are displayed for DU (black) and GC (grey) relative to NAG. The results show on a log2 scale the percent change from Table 2, where % change = [2^(log2 change) − 1] × 100. Only glycans with a statistically significant FDR adjusted p-value (P<0.1) were included. Levels of glycans are significantly altered for DU and/or GC when the 95% C.I. does not span 0. Positive values indicate increased levels in DU and/or GC, while negative values indicate decreased levels in DU and/or GC. The glycans that showed statistical significance in more than one fraction are identified with an asterisk; values for these glycans represent an average result for the 10% and 20% fractions
Differential glycan groups
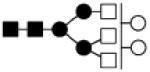
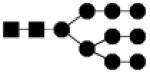
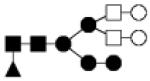
The serum glycans that differed between GC cases and NAG controls may be divided in four groups based on their structural features: high-mannose type glycans, glycans with one complex type antenna, bigalactosylated biantennary glycans and non-galactosylated biantennary glycans. This is further illustrated in Figure 3. While the high-mannose type glycans, glycans with one complex type antenna and bigalactosylated biantennary glycans show decreased levels in GC cases compared to NAG, increased levels of non-galactosylated biantennary glycans are observed in GC cases.
Figure 3.
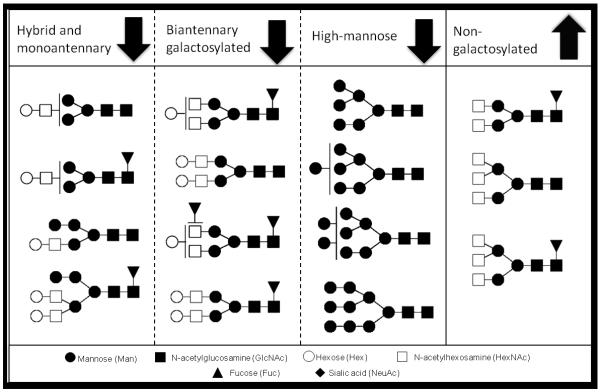
All glycans that show altered levels in serum from GC cases versus NAG controls are grouped according to their structural features. Levels of glycans increase or decrease based on these features.
Recent studies from our group have focused on the development of biomarkers for the detection of several types of cancer, including ovarian (53, 63) and lung(64) cancer. The altered patterns observed with ovarian cancer are very similar to the changes that occur with gastric cancer. Particularly, using MALDI-FTICR-MS analysis it was observed that several neutral glycans (including high mannose type glycans) were decreased in ovarian cancer, with the exception of a small group of non-galactosylated glycans (53). Using nLC-MS technology, decreased levels of neutral glycans, especially the high mannose type glycans, could be confirmed, but increased levels of non-galactosylated glycans were not observed (63). These results suggest that the profile observed is not exclusive for gastric cancer, but is more likely a sign of cancer in general. Indeed, other groups have reported similar differential patterns for gastric cancer as well as lung and ovarian cancer (29, 65-68).
One of the glycan groups that showed differential glycosylation patterns with GC is the group of high mannose glycans. These glycans are biochemically interesting, as they are the precursor glycans for the ‘more mature’ complex and hybrid type glycans. Glycan biosynthesis starts in the endoplasmic reticulum, where a glycan precursor consisting of the glycan core (man3GlcNAc2) decorated with six mannose and three glucose residues is built from monosaccharide. The glycan precursor is then transferred to the protein, and subsequently the glucose residues are removed, to form a high mannose glycan. When the protein is then transferred to the golgi, the mannose residues may be enzymatically removed, allowing the synthesis of hybrid and complex type glycans. Increased levels of high mannose glycans have been associated with tumor cells and tissue (69, 70), and it has been speculated that this is caused by premature termination of the glycosylation synthesis.
In this study, however, GC was associated with lower levels of high-mannose type glycans in serum. The higher abundance serum proteins are most likely produced in the liver or B-cells, but not in the cancer tissue itself, and the glycosylation synthesis may be very effective, thus reducing the number of high mannose type glycans (71). Another possibility is that protein abundances in the serum of cancer patients change. As not every protein is decorated with the same types of glycans, it is possible that the relative abundance of proteins carrying high-mannose type glycans is decreased, thus resulting in the lowered levels of high mannose type glycans observed.
Immunoglobulin G and GC glycosylation patterns
In this and other studies, increased levels of non-galactosylated biantennary glycans have been reported to be associated with cancer. It is well known that these types of glycans are nearly exclusively (95% of the abundance) found on immunoglobulin G, the glycoprotein of highest abundance in serum. Recently, glycosylation patterns of the Fc (constant fragment) portion of IgG was analyzed in GC cases and healthy controls (72). Increased levels of non-galactosylated glycans were observed on IgG, suggesting that the increased levels of these glycans described here are likely due to altered glycosylation on IgG. It is widely known that the N-glycans on the IgG Fc region have an important effect on the structure of the IgG molecule and its binding properties to the Fcγ receptor (73), and the altered glycosylation observed in GC may thus be a way to modify the immune response. Increased levels of non-galactosylated N-glycans on the IgGs have also been associated with autoimmune and other inflammatory diseases. Since chronic inflammation is one of the characteristics of cancer (74), it is likely that the increased levels of non-galactosylated glycans observed in serum of GC cases are related to the inflammatory response. However, further studies are needed to determine which is case and which is consequence.
CONCLUSION
This study shows the differential human serum N-glycosylation patterns in gastric cancer cases compared to controls. Differences were observed in four groups of glycans, namely the high-mannose type glycans, glycans with one complex type antenna, bigalactosylated biantennary glycans and non-galactosylated biantennary glycans. These glycans potentially provide predictive signatures for the detection of gastric cancer. Further studies are needed to identify disease pathways from a glycomics point of view, and provide new leads for the development of biomarkers for the early detection of gastric cancer.
Supplementary Material
ACKNOWLEDGEMENTS
Funding was provided by the National Institutes of Health (R01 CA136647). We are also grateful for the support provided by the Converging Research Center Program (2012K001505 for H. J. An) via the Ministry of Education, Science and Technology.
Funding: Funding was provided by the National Institutes of Health (R01 CA136647). We are also grateful for the support provided by the Converging Research Center Program (2012K001505 for H. J. An) via the Ministry of Education, Science and Technology.
REFERENCES
- 1.Fuchs CS, Mayer RJ. Medical Progress - Gastric-Carcinoma. New Engl J Med. 1995;333:32–41. doi: 10.1056/NEJM199507063330107. [DOI] [PubMed] [Google Scholar]
- 2.Catalano V, Labianca R, Beretta GD, Gatta G, de Braud F, Van Cutsem E. Gastric cancer. Crit Rev Oncol Hemat. 2005;54:209–41. doi: 10.1016/j.critrevonc.2005.01.002. [DOI] [PubMed] [Google Scholar]
- 3.Dicken BJ, Bigam DL, Cass C, Mackey JR, Joy AA, Hamilton SM. Gastric adenocarcinoma - Review and considerations for future directions. Ann Surg. 2005;241:27–39. doi: 10.1097/01.sla.0000149300.28588.23. [DOI] [PMC free article] [PubMed] [Google Scholar]
- 4.Jemal A, Bray F, Center MM, Ferlay J, Ward E, Forman D. Global cancer statistics. CA: a cancer journal for clinicians. 2011;61:69–90. doi: 10.3322/caac.20107. [DOI] [PubMed] [Google Scholar]
- 5.de Martel C, Ferlay J, Franceschi S, Vignat J, Bray F, Forman D, et al. Global burden of cancers attributable to infections in 2008: a review and synthetic analysis. The lancet oncology. 2012;13:607–15. doi: 10.1016/S1470-2045(12)70137-7. [DOI] [PubMed] [Google Scholar]
- 6.Lauren P. The two histological main types of gastric carcinoma: diffuse and so-called intestinal-type carcinoma. Acta Pathol Mic Sc. 1965;64:31–49. doi: 10.1111/apm.1965.64.1.31. [DOI] [PubMed] [Google Scholar]
- 7.Correa P, Houghton J. Carcinogenesis of Helicobacter pylori. Gastroenterol. 2007;133:659–72. doi: 10.1053/j.gastro.2007.06.026. [DOI] [PubMed] [Google Scholar]
- 8.Marshall B, Warren J. Unidentified curved bacilli in the stomach of patients with gastritis and peptic ulceration. Lancet. 1984;i:1311–5. doi: 10.1016/s0140-6736(84)91816-6. [DOI] [PubMed] [Google Scholar]
- 9.Gastric cancer and Helicobacter pylori: a combined analysis of 12 case control studies nested within prospective cohorts. Gut. 2001;49:347–53. doi: 10.1136/gut.49.3.347. [DOI] [PMC free article] [PubMed] [Google Scholar]
- 10.Ohnishi N, Yuasa H, Tanaka S, Sawa H, Miura M, Matsui A, et al. Transgenic expression of Helicobacter pylori CagA induces gastrointestinal and hematopoietic neoplasms in mouse. P Natl Acad Sci USA. 2008;105:1003–8. doi: 10.1073/pnas.0711183105. [DOI] [PMC free article] [PubMed] [Google Scholar]
- 11.Watanabe T, Tada M, Nagai H, Sasaki S, Nakao M. Helicobacter pylori infection induces gastric cancer in mongolian gerbils. Gastroenterol. 1998;115:642–8. doi: 10.1016/s0016-5085(98)70143-x. [DOI] [PubMed] [Google Scholar]
- 12.Fuccio L, Zagari RM, Eusebi LH, Laterza L, Cennamo V, Ceroni L, et al. Meta-analysis: can Helicobacter pylori eradication treatment reduce the risk for gastric cancer? Annals of internal medicine. 2009;151:121–8. doi: 10.7326/0003-4819-151-2-200907210-00009. [DOI] [PubMed] [Google Scholar]
- 13.Parsonnet J, Friedman GD, Vandersteen DP, Chang Y, Vogelman JH, Orentreich N, et al. Helicobacter-Pylori Infection and the Risk of Gastric-Carcinoma. New Engl J Med. 1991;325:1127–31. doi: 10.1056/NEJM199110173251603. [DOI] [PubMed] [Google Scholar]
- 14.Howlader NNA, Krapcho M, Neyman N, Aminou R, Altekruse SF, Kosary CL, Ruhl J, Tatalovich Z, Cho H, Mariotto A, Eisner MP, Lewis DR, Chen HS, Feuer EJ, Cronin KA. Cancer Statistics Review, 1975-2009 (Vintage 2009 Populations) National Cancer Institute; Bethesda, MD: 2009. [Google Scholar]
- 15.Blaser MJ, Falkow S. What are the consequences of the disappearing human microbiota? Nat Rev Microbiol. 2009;7:887–94. doi: 10.1038/nrmicro2245. [DOI] [PMC free article] [PubMed] [Google Scholar]
- 16.Sipponen P, Graham DY. Importance of atrophic gastritis in diagnostics and prevention of gastric cancer: application of plasma biomarkers. Scandinavian journal of gastroenterology. 2007;42:2–10. doi: 10.1080/00365520600863720. [DOI] [PubMed] [Google Scholar]
- 17.Miki K. Gastric cancer screening using the serum pepsinogen test method. Gastric cancer : official journal of the International Gastric Cancer Association and the Japanese Gastric Cancer Association. 2006;9:245–53. doi: 10.1007/s10120-006-0397-0. [DOI] [PubMed] [Google Scholar]
- 18.Ohata H, Kitauchi S, Yoshimura N, Mugitani K, Iwane M, Nakamura H, et al. Progression of chronic atrophic gastritis associated with Helicobacter pylori infection increases risk of gastric cancer. Int J Cancer. 2004;109:138–43. doi: 10.1002/ijc.11680. [DOI] [PubMed] [Google Scholar]
- 19.Sasazuki S, Inoue M, Iwasaki M, Otani T, Yamamoto S, Ikeda S, et al. Effect of Helicobacter pylori infection combined with CagA and pepsinogen status on gastric cancer development among Japanese men and women: A nested case-control study. Cancer Epidemiology Biomarkers & Prevention. 2006;15:1341–7. doi: 10.1158/1055-9965.EPI-05-0901. [DOI] [PubMed] [Google Scholar]
- 20.Swami M. PROTEOMICS A discovery strategy for novel cancer biomarkers. Nat Rev Cancer. 2010;10:597. doi: 10.1038/nrc2922. [DOI] [PubMed] [Google Scholar]
- 21.Reymond MA, Schiegel W. Proteomics in cancer. Adv Clin Chem. 2007;44:103–42. doi: 10.1016/s0065-2423(07)44004-5. [DOI] [PubMed] [Google Scholar]
- 22.Tabares G, Radcliffe CM, Barrabes S, Ramirez M, Aleixandre RN, Hoesel W, et al. Different glycan structures in prostate-specific antigen from prostate cancer sera in relation to seminal plasma PSA. Glycobiology. 2006;16:132–45. doi: 10.1093/glycob/cwj042. [DOI] [PubMed] [Google Scholar]
- 23.Wada Y, Azadi P, Costello CE, Dell A, Dwek RA, Geyer H, et al. Comparison of the methods for profiling glycoprotein glycans - HUPO Human Disease Glycomics/Proteome Initiative multi-institutional study. Glycobiology. 2007;17:411–22. doi: 10.1093/glycob/cwl086. [DOI] [PubMed] [Google Scholar]
- 24.Abd Hamid UM, Royle L, Saldova R, Radcliffe CM, Harvey DJ, Storr SJ, et al. A strategy to reveal potential glycan markers from serum glycoproteins associated with breast cancer progression. Glycobiology. 2008;18:1105–18. doi: 10.1093/glycob/cwn095. [DOI] [PubMed] [Google Scholar]
- 25.Raman R, Raguram S, Venkataraman G, Paulson JC, Sasisekharan R. Glycomics: an integrated systems approach to structure-function relationships of glycans. Nat Methods. 2005;2:817–24. doi: 10.1038/nmeth807. [DOI] [PubMed] [Google Scholar]
- 26.Kolarich D, Lepenies B, Seeberger PH. Glycomics, glycoproteomics and the immune system. Curr Opin Chem Biol. 2012;16:214–20. doi: 10.1016/j.cbpa.2011.12.006. [DOI] [PubMed] [Google Scholar]
- 27.Amano M, Nishimura SI. Large-Scale Glycomics for Discovering Cancer-Associated N-Glycans by Integrating Glycoblotting and Mass Spectrometry. Method Enzymol. 2010;478:109–25. doi: 10.1016/S0076-6879(10)78004-6. [DOI] [PubMed] [Google Scholar]
- 28.Taniguchi N. Toward cancer biomarker discovery using the glycomics approach. Proteomics. 2008;8:3205–8. doi: 10.1002/pmic.200890056. [DOI] [PubMed] [Google Scholar]
- 29.Arnold JN, Saldova R, Galligan MC, Murphy TB, Mimura-Kimura Y, Telford JE, et al. Novel glycan biomarkers for the detection of lung cancer. J Proteome Res. 2011;10:1755–64. doi: 10.1021/pr101034t. [DOI] [PubMed] [Google Scholar]
- 30.An HJ, Miyamoto S, Lancaster KS, Kirmiz C, Li BS, Lam KS, et al. Profiling of glycans in serum for the discovery of potential biomarkers for ovarian cancer. J Proteome Res. 2006;5:1626–35. doi: 10.1021/pr060010k. [DOI] [PubMed] [Google Scholar]
- 31.Kirmiz C, Li BS, An HJ, Clowers BH, Chew HK, Lam KS, et al. A serum glycomics approach to breast cancer biomarkers. Mol Cell Proteomics. 2007;6:43–55. doi: 10.1074/mcp.M600171-MCP200. [DOI] [PubMed] [Google Scholar]
- 32.Leiserowitz GS, Lebrilla C, Miyamoto S, An HJ, Duong H, Kirmiz C, et al. Glycomics analysis of serum: a potential new biomarker for ovarian cancer? Int J Gynecol Cancer. 2008;18:470–5. doi: 10.1111/j.1525-1438.2007.01028.x. [DOI] [PMC free article] [PubMed] [Google Scholar]
- 33.Zaia J. Mass Spectrometry and Glycomics. Omics. 2010;14:401–18. doi: 10.1089/omi.2009.0146. [DOI] [PMC free article] [PubMed] [Google Scholar]
- 34.Zaia J. Mass Spectrometry and the Emerging Field of Glycomics. Chem Biol. 2008;15:881–92. doi: 10.1016/j.chembiol.2008.07.016. [DOI] [PMC free article] [PubMed] [Google Scholar]
- 35.Turner GA. N-glycosylation of serum proteins in disease and its investigation using lectins. Clin Chim Acta. 1992;208:149–71. doi: 10.1016/0009-8981(92)90073-y. [DOI] [PubMed] [Google Scholar]
- 36.An HJ, Ninonuevo M, Aguilan J, Liu H, Lebrilla CB, Alvarenga LS, et al. Glycomics analyses of tear fluid for the diagnostic detection of ocular rosacea. J Proteome Res. 2005;4:1981–7. doi: 10.1021/pr0501620. [DOI] [PubMed] [Google Scholar]
- 37.Franz AH, Molinski TF, Lebrilla CB. MALDI-FTMS characterization of oligosaccharides labeled with 9-aminofluorene. J Am Soc Mass Spectr. 2001;12:1254–61. doi: 10.1016/S1044-0305(01)00313-0. [DOI] [PubMed] [Google Scholar]
- 38.Tseng K, Wang H, Hedrick JL, Lebrilla CB. The catalog approach to the complete structural elucidation of unknown neutral oligosaccharide alditols by MALDI-MS. Glycobiology. 1998;8:1136–7. [Google Scholar]
- 39.Cancilla MT, Penn SG, Lebrilla CB. Alkaline degradation of oligosaccharides coupled with matrix-assisted laser desorption/ionization Fourier transform mass spectrometry: A method for sequencing oligosaccharides. Anal Chem. 1998;70:663–72. doi: 10.1021/ac9711100. [DOI] [PubMed] [Google Scholar]
- 40.Vieira Ana CA, Joo Hyun, Ozcan Sureyya, Kim Jae-Han, Lebrilla Carlito B., Mannis Mark J. Glycomic Analysis of Tear and Saliva in Ocular Rosacea Patients: The Search for a Biomarker. The Ocular Surface. 2012 doi: 10.1016/j.jtos.2012.04.003. in press. [DOI] [PMC free article] [PubMed] [Google Scholar]
- 41.Ruhaak LR, Miyamoto S, Lebrilla CB. Glycomics Analysis of Dried Blood Spots. Glycobiology. 2011;21:1531. [Google Scholar]
- 42.An HJ, Lebrilla CB. Structure Elucidation of Native N- and O-Linked Glycans by Tandem Mass Spectrometry (Tutorial) Mass Spectrom Rev. 2011;30:560–78. doi: 10.1002/mas.20283. [DOI] [PubMed] [Google Scholar]
- 43.Hua S, An HJ, Ozcan S, Ro GS, Soares S, DeVere-White R, et al. Comprehensive native glycan profiling with isomer separation and quantitation for the discovery of cancer biomarkers. Analyst. 2011;136:3663–71. doi: 10.1039/c1an15093f. [DOI] [PMC free article] [PubMed] [Google Scholar]
- 44.de Leoz MLA, Young LJT, An HJ, Kronewitter SR, Kim JH, Miyamoto S, et al. High-Mannose Glycans are Elevated during Breast Cancer Progression. Mol Cell Proteomics. 2011;10 doi: 10.1074/mcp.M110.002717. [DOI] [PMC free article] [PubMed] [Google Scholar]
- 45.Dallas DC, Martin WF, Strum JS, Zivkovic AM, Smilowitz JT, Underwood MA, et al. N-Linked Glycan Profiling of Mature Human Milk by High-Performance Microfluidic Chip Liquid Chromatography Time-of-Flight Tandem Mass Spectrometry. J Agr Food Chem. 2011;59:4255–63. doi: 10.1021/jf104681p. [DOI] [PMC free article] [PubMed] [Google Scholar]
- 46.Kronewitter SR, de Leoz MLA, Peacock KS, McBride KR, An HJ, Miyamoto S, et al. Human Serum Processing and Analysis Methods for Rapid and Reproducible N-Glycan Mass Profiling. J Proteome Res. 2010;9:4952–9. doi: 10.1021/pr100202a. [DOI] [PMC free article] [PubMed] [Google Scholar]
- 47.Chu CS, Ninonuevo MR, Clowers BH, Perkins PD, An HJ, Yin HF, et al. Profile of native N-linked glycan structures from human serum using high performance liquid chromatography on a microfluidic chip and time-of-flight mass spectrometry. Proteomics. 2009;9:1939–51. [Google Scholar]
- 48.An HJ, Kronewitter SR, de Leoz MLA, Lebrilla CB. Glycomics and disease markers. Curr Opin Chem Biol. 2009;13:601–7. doi: 10.1016/j.cbpa.2009.08.015. [DOI] [PMC free article] [PubMed] [Google Scholar]
- 49.de Leoz MLA, An HJ, Kronewitter S, Kim J, Beecroft S, Vinall R, et al. Glycomic approach for potential biomarkers on prostate cancer: Profiling of N-linked glycans in human sera and pRNS cell lines. Dis Markers. 2008;25:243–58. doi: 10.1155/2008/515318. [DOI] [PMC free article] [PubMed] [Google Scholar]
- 50.Camorlinga-Ponce M, Flores-Luna L, Lazcano-Ponce E, Herrero R, Bernal-Sahagun F, Abdo-Francis JM, et al. Age and severity of mucosal lesions influence the performance of serologic markers in Helicobacter pylori-associated gastroduodenal Pathologies. Cancer Epidem Biomar. 2008;17:2498–504. doi: 10.1158/1055-9965.EPI-08-0289. [DOI] [PubMed] [Google Scholar]
- 51.Dixon MF, Genta RM, Yardley JH, Correa P. Classification and grading of gastritis. The updated Sydney System. International Workshop on the Histopathology of Gastritis, Houston 1994. American Journal of Surgical Pathology. 1996;20:1161–81. doi: 10.1097/00000478-199610000-00001. [DOI] [PubMed] [Google Scholar]
- 52.Torres J, Perez-Perez GI, Leal-Herrera Y, Munoz O. Infection with CagA+ Helicobacter pylori strains as a possible predictor of risk in the development of gastric adenocarcinoma in Mexico. Int J Cancer. 1998;78:298–300. doi: 10.1002/(SICI)1097-0215(19981029)78:3<298::AID-IJC6>3.0.CO;2-Q. [DOI] [PubMed] [Google Scholar]
- 53.Kronewitter SR, De Leoz ML, Strum JS, An HJ, Dimapasoc LM, Guerrero A, et al. The glycolyzer: Automated glycan annotation software for high performance mass spectrometry and its application to ovarian cancer glycan biomarker discovery. Proteomics. 2012;12:2523–38. doi: 10.1002/pmic.201100273. [DOI] [PMC free article] [PubMed] [Google Scholar]
- 54.Barkauskas D. FTICRMS: Programs for Analyzing Fourier Transform-Ion Cyclotron Resonance Mass Spectrometry Data R package. 2012. version 0.9. [Google Scholar]
- 55.Barkauskas DA, Rocke DM. A general-purpose baseline estimation algorithm for spectroscopic data. Anal Chim Acta. 2010;657:191–7. doi: 10.1016/j.aca.2009.10.043. [DOI] [PMC free article] [PubMed] [Google Scholar]
- 56.Barkauskas DA, Kronewitter SR, Lebrilla CB, Rocke DM. Analysis of MALDI FT-ICR mass spectrometry data: A time series approach. Anal Chim Acta. 2009;648:207–14. doi: 10.1016/j.aca.2009.06.064. [DOI] [PMC free article] [PubMed] [Google Scholar]
- 57.Benjamini Y, Hochberg Y. Controlling the False Discovery Rate - a Practical and Powerful Approach to Multiple Testing. J Roy Stat Soc B Met. 1995;57:289–300. [Google Scholar]
- 58.RG M. Simultaneous Statistical Inference. Springer; 1981. [Google Scholar]
- 59.Porras C, Nodora J, Sexton R, Ferreccio C, Jimenez S, Dominguez RL, et al. Epidemiology of Helicobacter pylori infection in six Latin American countries (SWOG Trial S0701) Cancer causes & control: CCC. 2013;24:209–15. doi: 10.1007/s10552-012-0117-5. [DOI] [PMC free article] [PubMed] [Google Scholar]
- 60.Balog CI, Stavenhagen K, Fung WL, Koeleman CA, McDonnell LA, Verhoeven A, et al. N-glycosylation of colorectal cancer tissues: a liquid chromatography and mass spectrometry-based investigation. Mol Cell Proteomics. 2012;11:571–85. doi: 10.1074/mcp.M111.011601. [DOI] [PMC free article] [PubMed] [Google Scholar]
- 61.Hoja-Lukowicz D, Ciolczyk D, Bergquist J, Litynska A, Laidler P. High-mannose-type oligosaccharides from human placental arylsulfatase A are core fucosylated as confirmed by MALDI MS. Glycobiology. 2000;10:551–7. doi: 10.1093/glycob/10.6.551. [DOI] [PubMed] [Google Scholar]
- 62.Barkauskas DA, An HJ, Kronewitter SR, de Leoz ML, Chew HK, White RWD, et al. Detecting glycan cancer biomarkers in serum samples using MALDI FT-ICR mass spectrometry data. Bioinformatics. 2009;25:251–7. doi: 10.1093/bioinformatics/btn610. [DOI] [PMC free article] [PubMed] [Google Scholar]
- 63.Hua S, Williams CC, Dimapasoc LM, Ro GS, Ozcan S, Miyamoto S, et al. Isomer-specific chromatographic profiling yields highly sensitive and specific potential N-glycan biomarkers for epithelial ovarian cancer. J Chromatogr A. 2013;1279:58–67. doi: 10.1016/j.chroma.2012.12.079. [DOI] [PMC free article] [PubMed] [Google Scholar]
- 64.Ruhaak LRNU, Stroble C, Taylor SL, Taguchi A, Hanash S, Lebrilla CB, Kim K, Miyamoto S. Enrichment strategies in glycomics based lung cancer biomarker development. PROTEOMICS - Clinical Applications. doi: 10.1002/prca.201200131. In press. [DOI] [PMC free article] [PubMed] [Google Scholar]
- 65.Kim YG, Jeong HJ, Jang KS, Yang YH, Song YS, Chung J, et al. Rapid and high-throughput analysis of N-glycans from ovarian cancer serum using a 96-well plate platform. Anal Biochem. 2009;391:151–3. doi: 10.1016/j.ab.2009.05.015. [DOI] [PubMed] [Google Scholar]
- 66.Bones J, Mittermayr S, O’Donoghue N, Guttman A, Rudd PM. Ultra performance liquid chromatographic profiling of serum N-glycans for fast and efficient identification of cancer associated alterations in glycosylation. Anal Chem. 2010;82:10208–15. doi: 10.1021/ac102860w. [DOI] [PubMed] [Google Scholar]
- 67.Bones J, Byrne JC, O’Donoghue N, McManus C, Scaife C, Boissin H, et al. Glycomic and glycoproteomic analysis of serum from patients with stomach cancer reveals potential markers arising from host defense response mechanisms. J Proteome Res. 2011;10:1246–65. doi: 10.1021/pr101036b. [DOI] [PubMed] [Google Scholar]
- 68.Saldova R, Royle L, Radcliffe CM, Abd Hamid UM, Evans R, Arnold JN, et al. Ovarian cancer is associated with changes in glycosylation in both acute-phase proteins and IgG. Glycobiology. 2007;17:1344–56. doi: 10.1093/glycob/cwm100. [DOI] [PubMed] [Google Scholar]
- 69.de Leoz ML, Young LJ, An HJ, Kronewitter SR, Kim J, Miyamoto S, et al. High-mannose glycans are elevated during breast cancer progression. Mol Cell Proteomics. 2011;10 doi: 10.1074/mcp.M110.002717. M110 002717. [DOI] [PMC free article] [PubMed] [Google Scholar]
- 70.Goetz JA, Mechref Y, Kang P, Jeng MH, Novotny MV. Glycomic profiling of invasive and non-invasive breast cancer cells. Glycoconj J. 2009;26:117–31. doi: 10.1007/s10719-008-9170-4. [DOI] [PubMed] [Google Scholar]
- 71.Diamandis EP. Serum proteomic profiling by matrix-assisted laser desorption-ionization time-of-flight mass spectrometry for cancer diagnosis: next steps. Cancer Res. 2006;66:5540–1. doi: 10.1158/0008-5472.CAN-05-4503. [DOI] [PubMed] [Google Scholar]
- 72.Kodar K, Stadlmann J, Klaamas K, Sergeyev B, Kurtenkov O. Immunoglobulin G Fc N-glycan profiling in patients with gastric cancer by LC-ESI-MS: relation to tumor progression and survival. Glycoconj J. 2012;29:57–66. doi: 10.1007/s10719-011-9364-z. [DOI] [PubMed] [Google Scholar]
- 73.Walker MR, Lund J, Thompson KM, Jefferis R. Aglycosylation of human IgG1 and IgG3 monoclonal antibodies can eliminate recognition by human cells expressing Fc gamma RI and/or Fc gamma RII receptors. The Biochemical journal. 1989;259:347–53. doi: 10.1042/bj2590347. [DOI] [PMC free article] [PubMed] [Google Scholar]
- 74.Hanahan D, Weinberg RA. Hallmarks of cancer: the next generation. Cell. 2011;144:646–74. doi: 10.1016/j.cell.2011.02.013. [DOI] [PubMed] [Google Scholar]
Associated Data
This section collects any data citations, data availability statements, or supplementary materials included in this article.