

Abstract
Parkinson’s disease (PD) patients frequently display loss of body fat mass and increased energy expenditure, and several studies have outlined a relationship between these metabolic abnormalities and disease severity, yet energy metabolism is largely unstudied in mouse models of PD. Here we characterize metabolic and physiologic responses to a high calorie diet (HCD) in mice expressing in neurons a mutant form of human α-synuclein (A53T) that causes dominantly inherited familial forms of the disease. A53T (SNCA) and wild type (WT) littermate mice were placed on a HCD for 12 weeks and evaluated for weight gain, food intake, body fat, blood plasma leptin, hunger, glucose tolerance, and energy expenditure. Results were compared to both SNCA and WT mice on a control diet. Despite consuming similar amounts of food, WT mice gained up to 66% of their original body weight on a HCD whereas SNCA mice gained only 17%. Further, after 12 weeks on a HCD, MRI analysis revealed that WT mice had significantly greater total and visceral body fat compared to SNCA mice (p<0.007). At 24 weeks of age SNCA mice displayed significantly increased hunger compared to WT (p<0.03). At 36 weeks of age, SNCA mice displayed significant hypoleptinemia compared to WT, both on a normal diet and a HCD (p<0.03). The HCD induced insulin insensitivity in WT, but not SNCA mice, as indicated by an oral glucose tolerance test. Finally, SNCA mice displayed greater energy expenditure compared to WT, as measured in a Comprehensive Lab Animal Monitoring System, after 12 weeks on a HCD. Thus, SNCA mice are resistant to HCD-induced obesity and insulin resistance and display reduced body fat, increased hunger, hypoleptinemia and increased energy expenditure. Our findings reveal a profile of metabolic dysfunction in a mouse model of PD that is similar to that of human PD patients, thus providing evidence that α-synuclein pathology is sufficient to drive such metabolic abnormalities and providing an animal model for discovery of the underlying mechanisms and potential therapeutic interventions.
Keywords: Parkinson’s disease, energy metabolism, leptin, insulin, body fat
Introduction
Parkinson’s disease (PD) is a progressive neurodegenerative disease characterized by motor symptoms including a resting tremor, bradykinesia and rigidity. These symptoms are related to degeneration of dopaminergic neurons in the substantia nigra (Crabtree and Zhang, 2012). Pathologically, PD brains show accumulation of α-synuclein in structures termed ‘Lewy bodies’ and loss of dopaminergic neurons in the substantia nigra (Polymeropoulos et al., 1997). Overexpression of mutant α-synuclein is commonly used to induce Parkinsonism-like pathology and symptoms in mouse models of PD (Crabtree & Zhang, 2012; Lin et al., 2012). In addition to the primary motor dysfunctions commonly described in PD, many non-motor symptoms are present and can appear prior to the onset of motor abnormalities. Chief among these are increases in anxiety, autonomic nervous system dysfunction, alterations in normal sleep patterns, dementia, deficits in olfaction and weight loss (Gallagher & Schrag, 2012; Rothman & Mattson, 2012). Though rare, some cases of PD are caused by specific genetic defects including mutations in the genes encoding α-synuclein, Parkin, LRRK2, PINK1 and DJ-1 (Corti et al., 2011). These different mutations may compromise mitochondrial function and/or protein clearance mechanisms in vulnerable neuronal populations (Cookson & Bandman, 2010).
Unintended weight loss is commonly observed in PD patients (Levi et al., 1990; Markus et al., 1993; Chen et al., 2003; Lorefalt et al., 2004). Studies show this weight loss represents loss of body fat mass rather than muscle mass and that weight loss is correlated to increased severity of motor symptoms. This implies that weight loss, or alterations in energy metabolism, may be directly related to the clinical severity of PD (Levi et al., 1990; Markus et al., 1993). A recent study also showed that PD patients who displayed a decreased body mass index (BMI) showed poorer cognitive function and faster rate of cognitive decline than PD patients who displayed a stable BMI, further implying a relationship between disease severity and weight/metabolic stability (Kim et al., 2012).
There are several hypotheses to explain unintended weight loss in PD patients, including decreased energy intake, increased energy expenditure, constipation, changes in physical activity or dysregulation of circulating leptin levels (Lorefalt et al., 2004, 2009; Delikanaki-Skaribas et al., 2009). Using a ventilated hood technique, Levi et al. (1990) measured increased energy expenditure in PD patients compared to control subjects. A similar study of energy expenditure using the doubly labeled water technique also measured increased daily energy expenditure in PD patients who exhibited weight loss compared to those who did not (Delikanaki-Skaribas et al., 2009). Further, one study showed that PD patients who lost weight were found to have an increased energy intake and a lower leptin level than those who did not lose weight, implying that reductions in circulating leptin are responsible for increased appetite and energy intake (Lorefalt et al., 2006, 2009). Other studies have shown hypoleptinemia in PD patients, particularly those experiencing unintended weight loss, raising the possibility that unintended weight loss in PD patients may be due to abnormal leptin signaling (Evidente et al., 2001; Lorefalt et al., 2009). Despite the emergence of a relationship between disease severity and metabolic dysfunction and clinical evidence of a role for altered metabolism in PD, no study to date has evaluated energy metabolism in a mouse model of PD.
In line with data regarding changes in energy expenditure and metabolism, a small number of studies have outlined associations between PD and diabetes. Some studies indicate a greater incidence of diabetes in PD patients compared to the general population or an increased risk of developing PD in diabetic patients (Sandyk et al., 1993; Driver et al., 2008; Hu et al., 2007). However, at least one study showed that the risk of developing incident diabetes was lower for patients with PD than for patients without (Becker et al., 2008). More compellingly, D’Amelio et al. (2009) measured an inverse association between PD and diabetes that preceded the onset of PD, implying that metabolic alterations may appear prior to PD symptoms and may include resistance to the development of glucose intolerance. It is noteworthy that drugs frequently used to treat PD, such as levadopa, are hyperglycemic and may therefore confound clinical associations measured between PD and diabetes in patients under treatment for PD (Sirtori et al., 1972).
However, despite clinical evidence for potential metabolic dysfunction in PD and the probability that such metabolic alterations are related to PD symptoms, no study to date has outlined a metabolic phenotype in a rodent model of PD. The current study employs a high calorie diet (HCD) in a mouse model of PD to outline dramatic alterations in metabolism compared to wild-type (WT) controls including resistance to high calorie diet-induced obesity and insulin resistance, hypoleptinemia, increased hunger and increased energy expenditure. The HCD was chosen as a stimulus known to induce weight gain, increase in body fat, leptin and insulin resistance in normal mice. Results in this mouse model of PD demonstrated a strong metabolic phenotype that mimics that noted clinically in PD patients and may be a useful model for understanding the interactions between α-synuclein pathology and perturbed energy metabolism in PD.
Materials and Methods
Mice and Experimental Timelines
Animal care and experimental procedures followed National Institutes of Health guidelines and were approved by the National Institute on Aging Animal Care and Use Committee. Mice transgenic for the A53T mutation of the human α-synuclein (SNCA) gene under the control of a human Thy1 (thymus cell antigen 1, theta) promoter were purchased from Jackson labs and bred at the National Institute on Aging. Male SNCA mice and wild-type littermates were used in separate cohorts to evaluate plasma leptin and glucose tolerance (n=6) and for Comprehensive Lab Animal Monitoring System (CLAMS) analysis, MRI analysis of fat volume and hunger satiety testing (n=4–6). SNCA mice display deficits in motor function, as shown by a decreased forepaw stride length, as early as 18–20 weeks of age. Motor deficits worsen over their lifespan to include a decrease in hindpaw stride length around 24–25 weeks of age and a reduction in time to fall from the rotarod at 26–30 weeks (Rothman et al., 2013). Although mice have a decreased lifespan and begin to display mortality around 24 weeks of age, roughly 80% survival is noted at 32 weeks; the timeframe for the current study is prior to the precipitous decline in survival for the SNCA mice (Griffioen et al., 2013). A survival rate of 85% was noted in the current study. All mice were kept on a 12:12 light:dark cycle and allowed free access to food and water. Mice were maintained on either standard chow or a high calorie diet (Dyets 101842; Dyets, Inc., Bethlehem, PA, USA; with water containing 11% by weight of a fructose/glucose mix) beginning when they were 12 weeks old (Stranahan et al., 2008). The data from the CLAMS analyses (Figures 1 and 5) were acquired when the mice had been on the diets for 12 weeks (24 week-old mice). Data in Figure 2 (MRI images) were acquired when the SNCA and wild-type mice were 28 weeks old (after being on the diets for 16 weeks). Data for Figure 3 were acquired as indicated on the figure (panel A) and in the legend (panel B). Data for Figure 4 were acquired at baseline (12 week old mice) or after 24 weeks on the diets (36 week-old mice) as indicated in the graphs and/or Figure legend.
Figure 1.

Percentages of fat, protein and carbohydrate in the control diet and the HCD; mice on the high calorie diet received 47% of their caloric intake from fat compared to just 18% for the mice on a normal diet (A). Both SNCA and WT littermates maintained on the control diet did not gain a significant amount of weight; only 7–13% of their original body weight (B). WT mice started on a HCD at 12 weeks of age experienced a 66% rise in body weight compared to baseline whereas SNCA mice maintained on a HCD gained only 17% of their original body weight on average (B). Data obtained from the Comprehensive Lab Animal Monitoring System (CLAMS) obtained after 12 weeks on either a normal or HCD showed no significant differences in food intake between the two strains for either the control diet (C) or HCD (D) for two rounds of the light-dark cycle (48 hours) as demonstrated by shading. Figure 1B was modified from the data used for Supplementary Figure 2 in Griffioen et al., 2012.
Figure 5.

Oxygen consumption (VO2), respiratory exchange ratio (RER) and energy expenditure (E,F) in 24 week old WT and SNCA mice on a regular diet or a HCD. Mice were monitored in the Comprehensive Lab Animal Monitoring System (CLAMS) for two rounds of the light-dark cycle (48 hours) as demonstrated by shading. (A and B). Results show greater oxygen consumption in SNCA mice compared to wild-type littermates for both diets; this increase wasis significant at 7, 14, 15, 17, 18 and 24 hours after the start of the monitoring period for mice on a regular diet (p<0.04) and at 0, 15, 18–20, 25, 31, 33, 38, 44 and 45 hours after the start of the monitoring period for mice on a HCD (p<0.047). (C and D). The RER was not different between the two strains for each diet respectively; RER was significantly greater in WT mice at 45 and 47 hours after the start of the monitoring period on a regular diet and 45 hours after the start of the monitoring period in mice on a HCD (p<0.049). (E and F). Energy expenditure was greater in SNCA mice compared to wild-type littermates on a control diet at 14, 15, 17, 18 and 43 hours after the start of the monitoring period (p<0.03) (E).). After 12 weeks on a HCD, in the greater energy expenditure of SNCA mice relative to wild-type littermates was more pronounced; SNCA mice displayed a significantly higher energy expenditure at 0, 15, 18–20, 25, 31, 33, 38, 40, 44–45 hours after the start of the monitoring period (p<0.04).
Figure 2.
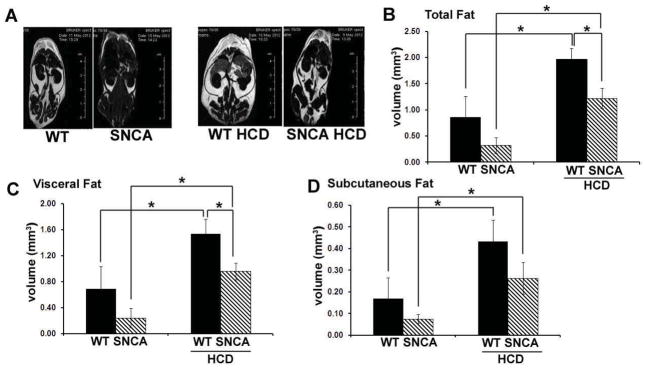
MRI analysis revealed significant differences in body fat between SNCA and wild-type mice at 28 weeks of age (after being on the diets for 16 weeks). Representative RARE images were acquired with contrast parameters that accentuated the fat signal relative to the water signal (A). These images demonstrated greater body fat in WT mice compared to SNCA for both the control and HCD groups. Quantification of total (B), visceral (C) and subcutaneous (D) fat was performed on a set of axial slices centered at the renal artery bifurcation. This analysis revealed a significantly higher total, visceral and subcutaneous fat volumes in the HCD group as compared to mice receiving a control diet, regardless of strain (p<0.008). Further, on a HCD, WT mice exhibited greater total and visceral body fat volumes than SNCA mice (p<0.007).
Figure 3.

SNCA mice were hypoleptinemic and displayed increased hunger. Blood plasma leptin levels were significantly lower in SNCA mice compared to WT littermates at 36 weeks of age, after 24 weeks on the diets (p=0.03) (A). WT plasma leptin levels are also significantly elevated compared to SNCA after HCD (p=0.003) (A). The hunger/satiety test revealed that on a control diet, 24 week old SNCA mice consumed significantly more food within the same period of time after an overnight fast than WT littermates (p<0.03) (B). No differences in food consumption were noted between the strains for mice on the HCD (measured when the mice were 24 weeks old, and had been on the diets for 12 weeks).
Figure 4.

SNCA mice are resistant to high calorie diet-induced insulin resistance. At 12 weeks of age, both SNCA and WT littermates on the control diet displayed normal responses to a glucose bolus, including a rise in glucose and insulin followed by a fall in both with a return to baseline glucose levels by 120 minutes (A&B). At 36 weeks of age, both strains receiving the control diet displayed an increase in glucose and insulin with a return to normal glucose levels, however glucose levels fell more slowly in wild-type mice than in SNCA littermates; blood glucose levels remained significantly elevated over SNCA at 30 and 60 minutes after the bolus injection (p<0.009) (C). Insulin levels in 36 week old mice on the control diet were comparable between the two strains during the whole tolerance test (D). At 36 weeks of age after 24 weeks on a HCD, wild-type mice displayed significantly greater blood glucose levels compared to SNCA at 30, 90 and 120 mins after gavage, indicating an impaired ability to return to normal baseline glucose levels (p<0.028) (E). More strikingly, plasma insulin levels were drastically higher in wild-type mice than in SNCA mice after 12 weeks on a HCD; these differences were significant at all time points tested (p<0.0014) (F). Calculations for the area under the curve (AUC) for the glucose and insulin response curves shown in A–F further demonstrate both alterations in glucose and insulin regulation after a HCD and differences between SNCA and WT littermates (G&H).
Comprehensive Lab Animal Monitoring System
Mice were tested in a comprehensive lab animal monitoring system (CLAMS) at 24 weeks of age after 12 weeks on a HCD (n=4 SNCA; n=4 WT) and results were compared to age-matched mice on a normal diet (n=4 SNCA; n=4 WT). Mice were placed in CLAMS cages for 48 hours to complete monitoring of two light-dark phase cycles. CLAMS was used to evaluate food consumption and energy expenditure. Energy expenditure and the respiratory exchange ratio (RER) were calculated from the gas exchange data [energy expenditure =(3.815 +1.232 *RER) *VO2] and expressed as kJ/kg/h. RER is the ratio of VCO2 to VO2, which changes depending on the energy source the animal is using. When carbohydrates are the only substrate being oxidized, the RER will be 1.0, and it will be 0.7 when only fatty acids are oxidized. Feeding was measured by recording the difference in the scale measurement of the center feeder from one time point to another.
Magnetic resonance imaging (MRI)
At 28 weeks of age and 16 weeks on either a normal or HCD, mice were sacrificed, decapitated and imaged in a Bruker Biospec 7 Tesla 30 cm MRI scanner (Bruker Biospin, Ettlingen, Germany) with a 72 mm diameter transmit-receive birdcage coil. In each experiment, two mice were inserted into the scanner side-by-side, in a feet-first, prone orientation. During scanning, the mice were cooled with a stream of cold air from a vortex tube (Exair, Inc., Cincinnati, Ohio) to minimize decomposition. A heavily T1-weighted fast spin echo (RARE) sequence yielding bright-fat images was used. 3D data sets were acquired in axial orientation with a field of view of 72 × 36 × 80 mm (left-right × anterior-posterior × head-foot) and matrix size 256 × 128 × 128. As a result, the voxel size (spatial resolution) was 281 × 281 × 625 microns. The spectral bandwidth in both sequences was 100 kHz (391 Hz/pixel) and the number of averages was 2.
For the RARE sequence, the RARE factor (i.e. number of spin echoes per shot or number of k-space lines per segment) was 8, the repetition time (TR) was 125 ms, the actual echo time (TE) was 11.4 ms and the effective echo time (TEeff) was 46.3 ms. The excitation pulse was a 1 ms sinc3 pulse with a flip angle of 90 degrees. The refocusing pulse was a bandwidth-matched sinc3 pulse with a flip angle of 180 degrees. Each RARE scan took 8 minutes 32 seconds to acquire.
A semi-manual image analysis pipeline was developed to delineate and compute the volumes of total and visceral fat regions using Slicer v. 4.1 (Pieper et al., 2006; Pieper et al., 2004; Fedorov et al., 2012). First, a region of interest centered at the axial level of renal artery bifurcation was defined. Gradient anisotropic diffusion filtering was then applied to reduce background noise that may produce false detection of fat. Next, fat voxels were identified using intensity thresholding. For each slice, a semi-manual editing tool was used to delineate the visceral cavity. All previously detected fat voxels lying inside the cavity were labeled as visceral fat. This procedure was carried out interactively on a total of 7 slices centered at the renal artery bifurcation for each subject. Finally, the volumes of total and visceral fat were calculated in mm3.
Leptin ELISA
Mice were sacrificed at 12, 24 and 36 weeks of age (n=6 SNCA; n=6 WT; each time point) as well as at 36 weeks of age after 12 weeks on a HCD (n=6 SNCA; n=6 WT) and trunk blood was gathered in heparinized tubes. Blood samples were then centrifuged at 12,500 rpm for 12 minutes at 4°C and plasma supernatant was removed and stored at −80°. Leptin was quantified using a commercially-available ELISA kit (R&D Systems; Minneapolis, MN).
Hunger/satiety test
Mice were tested for hunger/satiation at 24 weeks of age using a previously described paradigm (Adebakin et al., 2012). Mice were maintained on a normal diet (n=4 SNCA; n=3 WT) or given a HCD for 12 weeks (n=6 SNCA; n=4 WT). Prior to the test all mice were housed individually and fasted overnight for 12 h. Water was available ad libitum. The following morning (3 h after beginning of the light phase, 10.00am), mice were given a pre-weighed amount of food and food intake was monitored every 30 minutes for 2 hours.
Oral glucose tolerance test
Glucose tolerance and insulin resistance were measured using a standard oral glucose tolerance test at 12 and 36 weeks of age in SNCA and WT littermates (n=6 SNCA; n=6 WT) as well as in an age-matched 36 week-old cohort that received 12 weeks of HCD (n=6 SNCA; n=6 WT) (Iwai et al., 2010; Furuta et al., 2010; Irimia et al., 2010). Briefly, mice were fasted for 4 hours and blood was drawn from the tail and gathered using a heparinized micro-hematocrit capillary tube (Fisher Scientific, Pittsburgh, PA) and clotisol (Agri-med, St. Louis, MO) was used to stop the bleeding. Mice were then administered glucose (2g/kg) via gavage and blood samples were drawn at 15, 30, 60, 90 and 120 minutes after glucose administration. For all time points, whole-blood glucose concentration was quantified at the time of blood draw using a Freestyle Glucose meter (Abbott Laboratories, Abbott Park, IL). Blood samples were then centrifuged at 12,500 rpm for 12 minutes at 4°C and plasma supernatant was removed and stored at −80°. Insulin was quantified using a commercially-available ELISA kit (Crystal Chem Inc., Downers Grove, IL).
Statistics
All data are expressed as mean ± standard error. For food intake data, a single t-test taken at the end of the testing period was used to probe for a difference between WT and SNCA for each diet. Two-way ANOVA was used to test for an effect of diet (normal, HCD) and strain (WT, SNCA) on weight gain at the 12 week time point and body fat volume for total, visceral and subcutaneous fat separately. For body fat volume data, corrected post-hoc t-tests were also performed to probe for differences between individual groups. For leptin, hunger, the oral glucose tolerance test, and energy expenditure, t-tests were used to identify significant differences between the two strains at each time point. Significance was defined as p<0.05 and analyses were carried out using GraphPad version 5 (Graph-Pad Software, Inc., San Diego, CA, USA).
Results
SNCA mice are resistant to high calorie diet-induced obesity
In the present study, mice were fed a diet high in simple sugars and saturated fats and their drinking water was supplemented with high-fructose corn syrup (Fig. 1A). This diet has been shown to increase fasting blood glucose levels and serum cholesterol and triglycerides in normal mice and exacerbates dysfunction of the autonomic nervous system in SNCA mice (Stranahan et al., 2008; Griffioen et al., 2012). Our results show that, starting at 12 weeks of age, wild-type mice gain on average 66% of their baseline body weight during 12 weeks on a HCD (Fig. 1B). In contrast, SNCA mice gained on average only 17% of their original body weight during 12 weeks on the HCD. A two-way ANOVA revealed a significant effect of diet, strain and a significant interaction effect (p<0.02, df=1, F>6.04) for body weight at the 12 week time point (Fig 1B). Notably, this is likely not due to differences in food intake; the CLAMS system indicated that after 12 weeks on a HCD there were no significant differences in food or caloric intake between the two strains for either diet (Figs 1C & 1D). Both SNCA and wild-type littermates maintained on the control diet gained only 7–13% of their original body weight; a non-significant increase. Figure 1B was modified from the data used for Supplementary Figure 2 in Griffioen et al., 2013. Figures 1C & 1D represent cumulative food intake data during the 48 hour period the mice in the current study were being evaluated in the CLAMS metabolic chamber.
SNCA mice have less body fat than wild-type littermates
To quantify whether differences in body weight between SNCA and WT littermates on a HCD were due to differences in body fat volume, mice were imaged in a Bruker Biospec 7 Tesla 30 cm MRI scanner at 28 weeks of age after sacrifice and decapitation. Measurement of total, visceral and subcutaneous fat was performed on a set of axial slices centered about the renal artery bifurcation. In this way, these results represent an estimate of intra-abdominal fat deposit, which is known to be associated with elevated risk of impaired glucose tolerance and development of type 2 diabetes (Boyko et al., 2000; Hayashi et al., 2003). For mice on a normal diet, total, visceral and subcutaneous fat volumes were approximately twice as great in WT mice as in SNCA littermates (Fig 2). For both strains, significantly greater total, visceral and subcutaneous body fat volumes were measured for the HCD group as compared to mice receiving a control diet (p<0.008; Fig 2). WT mice on a HCD displayed significantly greater total and visceral body fat volume than SNCA mice on the same diet (p<0.007; Figs 2B & 2C). Two-way ANOVA revealed a significant effect of diet and strain for total, visceral and subcutaneous fat with no interaction effect (p<0.003, df=1, F>12.49).
SNCA mice are hypoleptinemic and display increased hunger compared to wild-type littermates
Blood plasma leptin was measured using a standard ELISA technique in both SNCA and WT littermates at ages 12, 24 and 36 weeks and also at 36 weeks after 12 weeks on the HCD. WT mice displayed an age-associated increase in leptin levels with a dramatic rise in circulating leptin after 12 weeks on the HCD (Fig 3A). In contrast, SNCA mice were hypoleptinemic and displayed greater hunger on a control diet. At 36 weeks of age, SNCA mice displayed significantly lower blood plasma leptin levels compared to WT littermates (p=0.03). After a HCD, WT mice displayed nearly twice the leptin level found in mice receiving a control diet and SNCA mice displayed a nearly 10-fold increase in leptin levels compared to the control diet. Nevertheless, WT plasma leptin levels were significantly elevated in WT compared to SNCA mice after 12 weeks on a HCD (p=0.003).
To test hunger/satiety, mice were fasted overnight; food was weighed before being returned to the cage and consumption was monitored. The hunger/satiety test revealed that at 24 weeks of age on a control diet, SNCA mice consumed significantly more food within the same time period after an overnight fast than WT littermates (p<0.03). No differences in food consumption were noted between the strains for mice on the HCD.
SNCA mice are resistant to high calorie diet-induced insulin resistance
The oral glucose tolerance test was used to probe for glucose tolerance and insulin resistance at 12 and 36 weeks of age and at 36 weeks of age after 12 weeks on a HCD. Baseline values for blood glucose and insulin levels were obtained followed by administration of a bolus of glucose via gavage. Blood samples were drawn from the tail at 15, 30, 60, 90 and 120 minutes and glucose and insulin were quantified as previously described. At 12 weeks of age, both SNCA and WT littermates displayed normal responses to a glucose bolus; blood glucose and insulin levels rose followed by a fall in both with a return to baseline glucose levels by 120 minutes (Fig 4A & 4B). At 36 weeks of age, both strains continued to display a normal response to glucose bolus. SNCA mice and WT littermates at 36 weeks of age displayed an increase in glucose and insulin after the bolus administration of glucose with a return to normal glucose levels. However, at 36 weeks, WT mice took longer return to baseline glucose levels compared to SNCA mice; WT blood glucose levels remained significantly elevated relative to those measured in SNCA mice at 30 and 60 minutes after the bolus injection (p<0.009) (Fig 4C). Insulin levels remained comparable between the two strains during the duration of the tolerance test in 36 week old mice (Fig 4D). After 12 weeks on a HCD, and at 36 weeks of age, WT mice displayed significantly (p<0.028) higher blood glucose levels compared to SNCA at 30, 90 and 120 mins after bolus gavage application of glucose (Fig 4E). Further, plasma insulin levels were significantly (p<0.0014) higher in WT mice compared to SNCA after 12 weeks on a HCD both at baseline (0 minis) and after the bolus gavage of glucose for all time points tested (Fig 4F). Calculations of the area under the curve (AUC) for both the glucose and insulin response curves shown in Figures 4A–4F further illustrate differences between the two strains (Figs 4G & 4H); at 12 weeks of age no differences in AUC are noted for either glucose or insulin, at 36 weeks of age the AUC for the glucose curve is significantly larger in WT mice and after 12 weeks on a HCD, the AUC for both glucose and insulin is significantly greater in WT mice compared to SNCA (p<0.02).
SNCA mice display increased oxygen consumption and energy expenditure on a high calorie diet
Oxygen consumption (VO2), the respiratory exchange ratio (RER) and energy expenditure were measured in 24 week old SNCA mice and wild-type littermates receiving a normal diet or HCD. Mice were monitored in the CLAMS for two rounds of the light-dark cycle (48 hours) and energy expenditure and RER (VCO2/VO2) were calculated from the gas exchange data [energy expenditure =(3.815 +1.232 *RER) *VO2] and expressed as kJ/kg/h (Fig 5). SNCA mice consumed more oxygen than their WT littermates on both a control diet and HCD. Specifically, significantly greater oxygen consumption was noted at 7, 14, 15, 17, 18 and 24 hours after the start of the monitoring period for a normal diet (p<0.04) and at 0, 15, 18–20, 25, 31, 33, 38, 44 and 45 hours after the start of the monitoring period for mice on a HCD (p<0.047) (Figs 5A & 5B). Greater oxygen consumption was were also reflected in greater carbon dioxide release, as evidenced by the fact that while VO2 was increased in SNCA mice, the RER was similar for the two strains on each diet (Figs 5C & 5D). Finally, because energy expenditure is calculated as a function of RER and VO2, [energy expenditure =(3.815 +1.232 *RER) *VO2] results showed some time points where energy expenditure was significantly (p<0.03) greater for SNCA mice compared to WT littermates on a control diet, specifically at 14, 15, 17, 18 and 43 hours after the start of the 48 hour monitoring period (Fig 5E). The greater energy expenditure of SNCA mice compared to WT littermates was more pronounced after 12 weeks on a HCD (Fig 5F). SNCA mice on a HCD displayed significantly (p<0.04) greater energy expenditure compared to WT littermates on a HCD at 0, 15, 18–20, 25, 31, 33, 38, 40, and 44–45 hours after the start of the monitoring period.
Discussion
This study demonstrates clinically-relevant metabolic dysfunction in a mouse model of PD. Results showed that mice over-expressing the A53T α-synuclein mutation under the control of the Thy1 promoter were resistant to both high fat diet-induced obesity and high fat diet-induced insulin resistance, displayed hypoleptinemia, greater hunger and lower body fat volume as well as higher oxygen consumption and energy expenditure. These robust metabolic abnormalities closely mirror those seen in clinical cases of PD, including unintended weight loss, decreased risk of developing type 2 diabetes, hypoleptinemia, loss of body fat mass, and increased energy expenditure (Lorefalt et al., 2004, 2009; Delikanaki-Skaribas et al., 2009; Cai et al., 2012). Further, as several studies indicate an association between metabolic function and PD symptoms, pharmaceutical targeting of metabolic systems may be a compelling avenue for the development of novel treatments for PD.
Generally, leptin administration decreases food intake and increases energy expenditure in animals. Short-term fasting (12–24 hours) results in a drop in leptin concentrations, while long-term weight loss generally leads to a decline in leptin concentrations in proportion to the amount of fat loss (Maffei et al., 1995; Pratley et al., 1997). We found that SNCA mice display both lower leptin levels and greater hunger compared to WT mice, in line with what is known regarding leptin and hunger. Because the main source of peripheral leptin is adipose tissue, increased leptin levels are related to increased body fat. Interestingly, lower leptin levels and greater hunger in SNCA mice compared to WT were present in mice on a normal diet (Figure 3), for which no significant differences in total and visceral body fat volume were present (Figure 2). Further, at 24 weeks of age, SNCA mice displayed greater hunger and energy expenditure, however leptin levels are not yet significantly different between the two strains (Figs (Figures 3 and 5). This could imply that changes in leptin are downstream from changes in energy expenditure and hunger. It should be noted however that: 1) there is a trend towards greater body fat in WT mice compared to SNCA on a normal diet; and 2) at 24 weeks of age there is also a trend towards increased leptin in WT compared to SNCA. mice. These effects could imply that the accumulation of fat and changes in circulating leptin are occurring simultaneously. Studies show that increases in the deposits of adipose tissue can cause a reduction in transport of leptin across the blood-brain barrier and an increase in circulating/peripheral leptin levels (Signore et al., 2008).
The effects of leptin are largely mediated through specific receptors expressed in hypothalamic nuclei involved in the regulation of food intake and energy expenditure (Tartaglia et al., 1995). Both leptin and leptin receptor knockout mice are hyperphagic, obese and insulin resistant and studies show these effects are mediated via the action of leptin on neurons (Cohen et al., 2001). Data gathered in the current study showed that low leptin levels in SNCA mice on a HCD are associated with normal glucose and insulin processing during the oral glucose tolerance test (Figure 4). In other words, it appears likely that the ability of SNCA mice to maintain lower body fat volume and leptin levels while on a HCD may be directly related to their ability to maintain normal glucose signaling on this diet. While some studies outline an increased risk of developing PD in diabetic patients, it is possible that these studies were clouded by the fact that drugs used to treat PD may interfere with insulin or glycemic control (Sandyk et al., 1993; Driver et al., 2008; Hu et al., 2007; D’Amelio et al., 2009).
The current study provides a thorough outline of a strong metabolic phenotype in a mouse model of PD- a phenotype that appears to mimic what is noted in man. However, our study focused solely on only one mouse model of PD and further studies using other mouse models, particularly studies that compare genetic and non-genetic approaches to modeling PD, will be highly useful. The mouse model of PD utilized in the current study displays some pathological and functional alterations that are highly relevant for PD such as age-related development of motor dysfunction as determined by gait analysis and rotarod testing; accumulation of mutant α-synuclein in neurons in the brainstem and midbrain and abnormal autonomic control of heart rate). However, as with many animal models of disease, some phenotypes are not present, such as degeneration of midbrain dopamine neurons. The current study did not measure behavioral outcomes - motor, olfactory, cognitive or anxiogenic. Many tests of motor function in mice, specifically rotarod, are greatly affected by differences in body weight, which are noted here, and these could lead to difficulty in outlining a relationship between metabolism and motor function (McFadyen et al., 2003). Nonetheless, it is important to begin to establish a relationship between disease severity and energy metabolism in PD, as is beginning to be done in clinical studies (Levi et al., 1990; Markus et al., 1993; Kim et al., 2012). A relationship between nigrostriatal dysfunction and metabolism would also provide more information on PD and energy metabolism; a high fat diet exacerbates nigrostriatal dysfunction in a neurotoxin-based rat model of PD (Morris et al., 2010).
Several important experimental and clinical questions are raised by the current study, particularly considering that it is the first of its kind to outline a clinically relevant metabolic phenotype in a mouse model of PD. Most notably, this work raises the question of whether metabolic abnormalities are related to disease progression. The mouse model used in the current study displays motor deficits including decreased latency to fall from the rotarod and decreased stride length, beginning around 18 weeks of age (Rothman et al., 2013) and it is not known whether administration of the HCD affected these motor symptoms. Further, the study only utilized one mouse model of PD, based on overexpression of α-synuclein. It is not known whether other genetic or non-genetic models of PD will display this phenotype, and if not, it would indicate that mutations in α-synuclein are specifically responsible for metabolic abnormalities in PD. The etiology of the metabolic changes measured here has not yet been explored. However, given the neuronal specificity of the Thy-1 promoter, it is hypothesized that a central mechanism, potentially hypothalamic control of appetite and metabolism, is responsible. Data from our lab show a lack of α-synuclein expression in muscle and liver in SNCA mice, further lending credence to the hypothesis that a central, rather than peripheral, mechanism for the observed abnormalities is active (S. Rothman, unpublished data). Finally, unintended weight loss is widely observed in clinical studies of PD and is generally thought to be linked to expenditure negative energy balance in the disease. A number of factors have been implicated, including resting tremor, anorexia, dysphagia, reduced sense of smell and taste and reduced gastrointestinal motility. While some of these factors (i.e. energy expenditure and anorexia) were explored in the current study, others warrant further attention, perhaps chief among them gastrointestinal motility. Thus, Hallet et al. (2012), detected expression of human α-synuclein protein in axonal fibers and occasionally in cell bodies of the enteric nervous system in Thy1-α-synuclein mice along with distention and blockage of the gastrointestinal tract, potentially indicating that mutations in α-synuclein could directly affect digestion.
Results presented here provide a strong basis for the study of energy metabolism and glucose tolerance in mouse models of PD. Clinical studies of PD are beginning to outline a relationship between motor symptoms and metabolic markers such as BMI and body weight, while many studies are sorting PD patients between ‘weight loss’ and ‘weight stable’ categories. It would be valuable to begin to classify rodent models of PD in this manner to begin to determine a source of these metabolic abnormalities and, potentially, to identify patients who may benefit from therapeutics that target metabolic pathways.
Highlights.
Mutant α-synuclein causes resistance to high calorie diet-induced obesity
α-synuclein mutant mice are resistant to high calorie diet-induced insulin resistance
α-synuclein mutant mice display lower body fat, hypoleptinemia and increased hunger
On a high calorie diet, α-synuclein mutant mice display increased energy expenditure
Acknowledgments
This research was supported entirely by the Intramural Research Program of the NIH, National Institute on Aging. The authors thank Catherine Crews and Charles Reitz for assistance with management of the mouse colonies.
Abbreviations
- BMI
body mass index
- CLAMS
comprehensive lab animal monitoring system
- HCD
high calorie diet
- MRI
magnetic resonance imaging
- PD
Parkinson’s disease
- RARE
heavily T1-weighted fast spin echo
- RER
respiratory exchange ratio
- SNCA
thy1 α-synuclein mice
- WT
wild type
Footnotes
Publisher's Disclaimer: This is a PDF file of an unedited manuscript that has been accepted for publication. As a service to our customers we are providing this early version of the manuscript. The manuscript will undergo copyediting, typesetting, and review of the resulting proof before it is published in its final citable form. Please note that during the production process errors may be discovered which could affect the content, and all legal disclaimers that apply to the journal pertain.
References
- Adebakin A, Bradley J, Gümüsgöz S, Waters EJ, Lawrence CB. Impaired satiation and increased feeding behaviour in the triple-transgenic Alzheimer’s disease mouse model. PLoS One. 2012;7(10):e45179. doi: 10.1371/journal.pone.0045179. [DOI] [PMC free article] [PubMed] [Google Scholar]
- Becker C, Brobert GP, Johansson S, Jick SS, Meier CR. Diabetes in patients with idiopathic Parkinson’s disease. Diabetes Care. 2008;31:1808–12. doi: 10.2337/dc08-0479. [DOI] [PMC free article] [PubMed] [Google Scholar]
- Boyko EJ, Fujimoto WY, Leonetti DL, Newell-Morris L. Visceral adiposity and risk of type 2 diabetes: a prospective study among Japanese Americans. Diabetes Care. 2000;23:465–71. doi: 10.2337/diacare.23.4.465. [DOI] [PubMed] [Google Scholar]
- Cai H, Cong WN, Ji S, Rothman S, Maudsley S, Martin B. Metabolic dysfunction in Alzheimer’s disease and related neurodegenerative disorders. Curr Alzheimer Res. 2012;9:5–17. doi: 10.2174/156720512799015064. [DOI] [PMC free article] [PubMed] [Google Scholar]
- Cookson MR, Bandmann O. Parkinson’s disease: insights from pathways. Hum Mol Genet. 2010;19:R21–7. doi: 10.1093/hmg/ddq167. [DOI] [PMC free article] [PubMed] [Google Scholar]
- Crabtree DM, Zhang J. Genetically engineered mouse models of Parkinson’s disease. Brain Res Bull. 2012;88:13–32. doi: 10.1016/j.brainresbull.2011.07.019. [DOI] [PMC free article] [PubMed] [Google Scholar]
- Chen H, Zhang S, Hernan M, Willert W, Ascherio A. Weight loss in Parkinson’s disease. Ann Neurol. 2003;53:676–9. doi: 10.1002/ana.10577. [DOI] [PubMed] [Google Scholar]
- Cohen P, Zhao C, Cai X, Montez JM, Rohani SC, Feinstein P, Mombaerts P, Friedman JM. Selective deletion of leptin receptor in neurons leads to obesity. J Clin Invest. 2001;108:1113–21. doi: 10.1172/JCI13914. [DOI] [PMC free article] [PubMed] [Google Scholar]
- Corti O, Lesage S, Brice A. What genetics tells us about the causes and mechanisms of Parkinson’s disease. Physiol Rev. 2011;91:1161–218. doi: 10.1152/physrev.00022.2010. [DOI] [PubMed] [Google Scholar]
- D’Amelio M, Ragonese P, Callari G, Di Benedetto N, Palmeri B, Terruso V, Salemi G, Famoso G, Aridon P, Savettieri G. Diabetes preceding Parkinson’s disease onset. A case-control study. Parkinsonism Relat Disord. 2009;15:660–4. doi: 10.1016/j.parkreldis.2009.02.013. [DOI] [PubMed] [Google Scholar]
- Delikanaki-Skaribas E, Trail M, Wong WW, Lai EC. Daily energy expenditure, physical activity, and weight loss in Parkinson’s disease patients. Mov Disord. 2009;24:667–71. doi: 10.1002/mds.22372. [DOI] [PubMed] [Google Scholar]
- Driver JA, Smith A, Buring JE, Gaziano JM, Kurth T, Logroscino G. Prospective cohort study of type 2 diabetes and the risk of Parkinson’s disease. Diabetes Care. 2008;31:2003–5. doi: 10.2337/dc08-0688. [DOI] [PMC free article] [PubMed] [Google Scholar]
- Evidente VG, Caviness JN, Adler CH, Gwinn-Hardy KA, Pratley RE. Serum leptin concentrations and satiety in Parkinson’s disease patients with and without weight loss. Mov Disord. 2001;16:924–7. doi: 10.1002/mds.1165. [DOI] [PubMed] [Google Scholar]
- Furuta Y, Horiguchi M, Sugaru E, Ono-Kishino M, Otani M, Sakai M, Masui Y, Tsuchida A, Sato Y, Takubo K, Hochigai H, Kimura H, Nakahira H, Nakagawa T, Taiji M. Chronic administration of DSP-7238, a novel, potent, specific and substrate-selective DPP IV inhibitor, improves glycaemic control and beta-cell damage in diabetic mice. Diabetes Obes Metab. 2010;12:421–30. doi: 10.1111/j.1463-1326.2009.01180.x. [DOI] [PubMed] [Google Scholar]
- Fedorov A, Beichel R, Kalpathy-Cramer J, Finet J, Fillion-Robin JC, Pujol S, Bauer C, Jennings D, Fennessy F, Sonka M, Buatti J, Aylward SR, Miller JV, Pieper S, Kikinis R. 3D Slicer as an image computing platform for the Quantitative Imaging Network. Magn Reson Imag. 2012 doi: 10.1016/j.mri.2012.05.001. in press. [DOI] [PMC free article] [PubMed] [Google Scholar]
- Gallagher DA, Schrag A. Psychosis, apathy, depression and anxiety in Parkinson’s disease. Neurobiol Dis. 2012;46:581–9. doi: 10.1016/j.nbd.2011.12.041. [DOI] [PubMed] [Google Scholar]
- Griffioen KJ, Rothman SM, Ladenheim B, Wan R, Vranis N, Hutchison E, Okun E, Cadet JL, Mattson MP. Dietary energy intake modifies brainstem autonomic dysfunction caused by mutant α-synuclein. Neurobiol Aging. 2013;34:928–35. doi: 10.1016/j.neurobiolaging.2012.07.008. [DOI] [PMC free article] [PubMed] [Google Scholar]
- Hallett PJ, McLean JR, Kartunen A, Langston JW, Isacson O. Alpha-synuclein overexpressing transgenic mice show internal organ pathology and autonomic deficits. Neurobiol Dis. 2012 doi: 10.1016/j.nbd.2012.04.009. in press. [DOI] [PMC free article] [PubMed] [Google Scholar]
- Hayashi T, Boyko EJ, Leonetti DL, McNeely MJ, Newell-Morris L, Kahn SE, Fujimoto WY. Visceral adiposity and the risk of impaired glucose tolerance: a prospective study among Japanese Americans. Diabetes Care. 2003;26:650–5. doi: 10.2337/diacare.26.3.650. [DOI] [PubMed] [Google Scholar]
- Hu G, Jousilahti P, Bidel S, Antikainen R, Tuomilehto J. Type 2 diabetes and the risk of Parkinson’s disease. Diabetes Care. 2007;30:842–7. doi: 10.2337/dc06-2011. [DOI] [PubMed] [Google Scholar]
- Irimia JM, Meyer CM, Peper CL, Zhai L, Bock CB, Previs SF, McGuinness OP, DePaoli-Roach A, Roach PJ. Impaired glucose tolerance and predisposition to the fasted state in liver glycogen synthase knock-out mice. J Biol Chem. 2010;285:12851–61. doi: 10.1074/jbc.M110.106534. [DOI] [PMC free article] [PubMed] [Google Scholar]
- Iwai M, Kanno H, Tomono Y, Inaba S, Senba I, Furuno M, Mogi M, Horiuchi M. Direct renin inhibition improved insulin resistance and adipose tissue dysfunction in type 2 diabetic KK-A(y) mice. J Hypertens. 2010;28:1471–81. doi: 10.1097/HJH.0b013e32833bc420. [DOI] [PubMed] [Google Scholar]
- Kim HJ, Oh ES, Lee JH, Moon JS, Oh JE, Shin JW, Lee KJ, Baek IC, Jeong SH, Song HJ, Sohn EH, Lee AY. Relationship between changes of body mass index (BMI) and cognitive decline in Parkinson’s disease (PD) Arch Gerontol Geriatr. 2012;55:70–2. doi: 10.1016/j.archger.2011.06.022. [DOI] [PubMed] [Google Scholar]
- Levi S, Cox M, Lugon M, Hodkinson M, Tomkins A. Increased energy expenditure in Parkinson’s disease. BMJ. 1990;301:1256–7. doi: 10.1136/bmj.301.6763.1256. [DOI] [PMC free article] [PubMed] [Google Scholar]
- Lorefält B, Lin X, Parisiadou L, Sgobio C, Liu G, Yu J, Sun L, Shim H, Gu XL, Luo J, Long CX, Ding J, Mateo Y, Sullivan PH, Wu LG, Goldstein DS, Lovinger D, Cai H. Conditional expression of Parkinson’s disease-related mutant α-synuclein in the midbrain dopaminergic neurons causes progressive neurodegeneration and degradation of transcription factor nuclear receptor related 1. J Neurosci. 2012;32:9248–64. doi: 10.1523/JNEUROSCI.1731-12.2012. [DOI] [PMC free article] [PubMed] [Google Scholar]
- Lorefalt B, Ganowiak W, Pålhagen S, Toss G, Unosson M, Granérus A-K. Factors of importance for weight loss in elderly patients with Parkinson’s disease. Acta Neurolog Scand. 2004;110:180–7. doi: 10.1111/j.1600-0404.2004.00307.x. [DOI] [PubMed] [Google Scholar]
- Lorefält B, Toss G, Granérus AK. Weight loss, body fat mass, and leptin in Parkinson’s disease. Mov Disord. 2009;24:885–90. doi: 10.1002/mds.22466. [DOI] [PubMed] [Google Scholar]
- Lorefält B, Ganowiak W, Wissing U, Granérus A-K, Unosson M. Food habits and intake of nutrients in elderly patients with Parkinson’s disease. Gerontology. 2006;52:160–8. doi: 10.1159/000091825. [DOI] [PubMed] [Google Scholar]
- Maffei M, Halaas J, Ravussin E, et al. Leptin levels in human and rodent: measurement of plasma leptin and ob RNA in obese and weight-reduced subjects. Nat Med. 1995;1:1155–1161. doi: 10.1038/nm1195-1155. [DOI] [PubMed] [Google Scholar]
- Markus HS, Tomkins AM, Stern GM. Increased prevalence of undernutrition in Parkinson’s disease and its relationship to clinical disease parameters. J Neural Transm Park Dis Dement Sect. 1993;5:117–25. doi: 10.1007/BF02251202. [DOI] [PubMed] [Google Scholar]
- McFadyen MP, Kusek G, Bolivar VJ, Flaherty L. Differences among eight inbred strains of mice in motor ability and motor learning on a rotorod. Genes Brain Behav. 2003;2:214–219. doi: 10.1034/j.1601-183x.2003.00028.x. [DOI] [PubMed] [Google Scholar]
- Morris JK, Bomhoff GL, Stanford JA, Geiger PC. Neurodegeneration in an animal model of Parkinson’s disease is exacerbated by a high-fat diet. Am J Physiol Regul Integr Comp Physiol. 2010;299:R1082–90. doi: 10.1152/ajpregu.00449.2010. [DOI] [PMC free article] [PubMed] [Google Scholar]
- Pieper S, Lorensen B, Schroeder W, Kikinis R. The NA-MIC Kit: ITK, VTK, Pipelines, Grids and 3D Slicer as an Open Platform for the Medical Image Computing Community. Proceedings of the 3rd IEEE International Symposium on Biomedical Imaging: From Nano to Macro. 2006;1:698–701. [Google Scholar]
- Pieper S, Halle M, Kikinis R. 3D SLICER. Proceedings of the 1st IEEE International Symposium on Biomedical Imaging: From Nano to Macro. 2004;1:632–5. [Google Scholar]
- Polymeropoulos MH, Lavedan C, Leroy E, Ide SE, Dehejia A, Dutra A, Pike B, Root H, Rubenstein J, Boyer R, Stenroos ES, Chandrasekharappa S, Athanassiadou A, Papapetropoulos T, Johnson WG, Lazzarini AM, Duvoisin RC, Di Iorio G, Golbe LI, Nussbaum RL. Mutation in the alpha-synuclein gene identified in families with Parkinson’s disease. Science. 1997;276:2045–7. doi: 10.1126/science.276.5321.2045. [DOI] [PubMed] [Google Scholar]
- Pratley RE, Nicolson M, Bogardus C, Ravussin E. Plasma leptin responses to fasting in Pima Indians. Am J Physiol. 1997;273:E644–E649. doi: 10.1152/ajpendo.1997.273.3.E644. [DOI] [PubMed] [Google Scholar]
- Rothman SM, Griffioen KJ, Vranis N, Ladenheim B, Cong WN, Cadet JL, Haran J, Martin B, Mattson MP. Neuronal Expression of Familial Parkinson’s Disease A53T α-Synuclein Causes Early Motor Impairment, Reduced Anxiety and Potential Sleep Disturbances in Mice. Journal of Parkinson’s Disease. 2013;3:215–29. doi: 10.3233/JPD-120130. [DOI] [PubMed] [Google Scholar]
- Rothman SM, Mattson MP. Sleep disturbances in Alzheimer’s and Parkinson’s diseases. Neuromol Med. 2012;14:194–204. doi: 10.1007/s12017-012-8181-2. [DOI] [PMC free article] [PubMed] [Google Scholar]
- Sandyk R. The relationship between diabetes mellitus and Parkinson’s disease. Int J Neurosci. 1993;69:125–30. doi: 10.3109/00207459309003322. [DOI] [PubMed] [Google Scholar]
- Signore AP, Zhang F, Weng Z, Gao Y, Chen J. Leptin neuroprotection in the CNS: mechanisms and therapeutic potentials. J Neurochem. 2008;106:1977–90. doi: 10.1111/j.1471-4159.2008.05457.x. [DOI] [PMC free article] [PubMed] [Google Scholar]
- Sirtori CR, Bolme P, Azarnoff DL. Metabolic responses to acute and chronic L-DOPA administration in patients with parkinsonism. N Engl J Med. 1972;287:729–33. doi: 10.1056/NEJM197210122871501. [DOI] [PubMed] [Google Scholar]
- Stranahan AM, Norman ED, Lee K, Cutler RG, Telljohann RS, Egan JM, Mattson MP. Diet-induced insulin resistance impairs hippocampal synaptic plasticity and cognition in middle-aged rats. Hippocampus. 2008;18:1085–8. doi: 10.1002/hipo.20470. [DOI] [PMC free article] [PubMed] [Google Scholar]
- Tartaglia LA, Dembski M, Weng X, Deng N, Culpepper J, Devos R, Richards GJ, Campfield LA, Clark FT, Deeds J, Muir C, Sanker S, Moriarty A, Moore KJ, Smutko JS, Mays GG, Wool EA, Monroe CA, Tepper RI. Identification and expression cloning of a leptin receptor, OB-R. Cell. 1995;83:1263–71. doi: 10.1016/0092-8674(95)90151-5. [DOI] [PubMed] [Google Scholar]