

Abstract
Low bone mineral density (BMD) has been reported in recipients of pediatric hematopoietic cell transplantation (HCT), but it is unclear whether age at HCT plays a role. The objective of this cross-sectional study was to determine if patients treated with HCT before age 10 years have long-term BMD deficits compared to patients transplanted at an older age and to sibling controls. The study included 151 HCT recipients (87 males), age at study 24.7±8.6 years treated with HCT for hematologic malignancies at age 10.9±6.4 years, and 92 healthy sibling controls (49 males), age at study 22.3±8.0 years. Dual-energy x-ray absorptiometry was performed to measure BMD Z-scores for total body (TBMD), lumbar spine (LBMD), and femoral neck (FNBMD, for subjects ≥20 years at study visit). Patients <10 years at HCT had significantly lower TBMD and FNBMD Z-scores (by 0.5 and 0.8 SD, respectively) compared to controls (P=0.003 and P=0.0001, respectively) and patients >18 years at HCT (P=0.04 and P=0.004, respectively) at an average of 14 years after HCT. In conclusion, this study identified young age at transplant as an important risk factor for bone deficits in young adulthood, suggesting that efforts to reduce bone loss should focus on this patient population.
Key terms: osteoporosis, DXA scan, bone mineral density, bone marrow transplantation, lean body mass, children
INTRODUCTION
Reduced bone mineral density (BMD) has been increasingly recognized as a complication of hematopoietic cell transplantation (HCT) in children, although the data remain limited to a few retrospective studies1–7 and one prospective study8. Most of these studies used dual-energy x-ray absorptiometry (DXA) to measure total body BMD (TBMD) Z-score (the number of SDs from the mean)9 and/or lumbar spine BMD (LBMD) Z-score, which are the preferred measures in children2, 3, 5–7, 9, with average BMD Z-scores ranging from −0.3 to −1.02–5, 7, 8. This shift in the distribution of BMD Z-scores resulted in a high proportion of children having BMD Z-scores less than −1 (33%) and less than −2 (21%)4, 5, 8. Bone quality is also impaired in children after HCT with reductions in both trabecular and cortical dimensions documented by quantitative computed tomography (QCT)1, 4. Detection of BMD deficits already during childhood is significant because childhood and adolescence are critical periods for establishing adequate bone mass for the rest of a person’s life10, 11. In this context, identification of risk factors in children undergoing HCT takes on heightened importance, but has been limited by small sample size of most pediatric studies.
Post-transplant bone loss results from decreased bone formation (caused by reduced osteoblast activity) and increased bone resorption (due to increased osteoclast activity) within 100 days after pediatric HCT8, 12. Consequently, LBMD Z-score decreases on average by 0.5 SD within the first 6 months after HCT and, in about a third of the children, remains below the pre-HCT baseline after 1 year8. Potential underlying causes of this post-HCT bone loss are numerous, including poor nutritional status, inadequate calcium and/or vitamin D intake, reduced physical activity, growth hormone deficiency (GHD), hypogonadism, reduced lean body mass (LBM), corticosteroid treatment, exposure to total body irradiation (TBI), cranial radiation (CRT), graft-versus-host disease (GVHD) or its treatment, direct effects of conditioning regimens on bone marrow stromal cells, or cytokine release after HCT1, 8, 13–16. Some of these potential causes persist long after HCT.
The impact of age at HCT is currently unknown. Skeletal weight increases dramatically up to age 25 years with the greatest increase in LBMD and TBMD occurring between the ages of 10 and 16 years17, 18. Thus, children who were transplanted at a younger age would be expected to have a chance to regain BMD in a rapid period of bone acquisition during puberty and to have better BMD outcome than children transplanted at an older age. This uncertainty about long-term impact of HCT on BMD in the youngest patients complicates a decision about initiating therapeutic interventions when low BMD is diagnosed.
The goal of this study was to examine the association of age at HCT with BMD Z-scores. We hypothesized that younger age at HCT is associated with higher BMD Z-scores at long-term follow-up. A secondary goal was to examine the association between BMD Z-scores and measures of body composition and other potential risk factors.
MATERIALS AND METHODS
Participants
All HCT recipients ≤21 years at diagnosis, ≥10 years old at study entry, ≥2 years post-HCT performed to treat hematologic malignancies between 1975 and 2008 at the University of Minnesota or the Fred Hutchinson Cancer Research Center/Seattle Children’s Hospital were identified. Of 557 eligible patients, 26 were excluded due to active GVHD or lack of remission; 84 could not be located. Of the remaining 447 patients, contact was attempted with the first 339 randomly selected individuals and consent for participation was obtained from 154 (45%). Of those, 3 were subsequently excluded due to previously undiagnosed diabetes (n=1), severe hypertension (n=1), or multiple medical problems (n=1), leaving the final study population of 151 patients. Allogeneic HCT was performed in 116 (77%) and autologous in 35 (23%) patients; 12 patients had more than one HCT. All patients received myeloablative preparative regimens, 116 (77%) including TBI and 35 (23%) consisting of chemotherapy only, the majority of those busulfan based. Of patients who received TBI, 31 (21%) also received CRT either before or concurrent with TBI.
The control group consisted of eligible healthy siblings who were ≥10 years old at study entry and who had never had a malignancy or HCT. Based on a pre-determined frequency matched enrollment scheme, siblings were recruited to represent the age and sex distribution of HCT recipients. Having a sibling was not a requirement for participation. A siblings control population was chosen to obtain greater similarity to HCT recipients in genetics, lifestyle, and environment/geographical trends.
This study was approved by the Institutional Review Boards at Seattle Children’s Hospital and the University of Minnesota Medical Center. Assent was obtained from minors and consent obtained from their parents or guardian(s).
Study procedures
All HCT recipients and controls prospectively underwent a physical examination, including Tanner staging of pubertal development by trained pediatric providers, measurement of height, weight, body mass index (BMI), and a DXA scan (GE Healthcare Lunar Prodigy scanner; Madison, WI, USA) using enCORE software version 9.3 at the University of Minnesota and version 8.1 at Seattle Children’s Hospital. DXA measures included Z-scores for total body BMD (TBMD, not excluding head), posterior anterior lumbar spine at L2-L4 (LBMD), femoral neck (FNBMD; only for subjects ≥20 years at study visit), and body composition (percent fat mass, total fat mass, LBM). The two GE Healthcare Lunar Prodigy DXA scanners were cross-calibrated using a custom-built phantom allowing calibration of bone, fat, and lean tissue mass. Data from the two scanners were corrected for differences between them. Sex- and age-specific BMD Z-scores were calculated using enCORE reference data based on healthy, ambulatory subjects from the general population who were free from chronic diseases affecting bone and not taking bone-altering medications.
Laboratory testing included free thyroxine (free T4) by competitive immunoassay and total testosterone by liquid chromatography/tandem mass spectrometry. Chemiluminescent immunoassay was performed to measure follicle stimulating hormone (FSH), luteinizing hormone (LH), and insulin-like growth factor-1 (IGF-1). Hypothyroidism was defined by treatment with thyroid hormone replacement at the time of examination or free T4 < 0.7 ng/dL (9 pmol/L). Hypergonadotropic hypogonadism was defined by FSH > 40 IU/L in females or LH > 10 IU/L and testosterone below normal for Tanner stage in males19. Growth hormone (GH) stimulation test using clonidine and arginine was performed in patients <18 years at evaluation20, 21. In patients ≥18 years, growth hormone releasing hormone (GHRH) and arginine or arginine alone (after GHRH ceased being manufactured) were used 22. GHD was defined as a stimulated GH level <10 μg/L after clonidine/arginine23, <4.1 μg/L after GHRH-arginine 22, and <0.4 μg/L after arginine22. GH testing was not performed in sibling controls. Dietary intake of calcium and vitamin D over the past 4 weeks were evaluated using the Youth/Adolescent Questionnaire24. Television/computer screen time was assessed by the Modifiable Activity Questionnaire and used as a measure of leisure activity over the past year25.
Statistical analysis
Descriptive statistics are shown as frequencies and percents, or as mean ± standard deviation (SD) for unadjusted analyses, or as adjusted average ± standard error (SE) for adjusted analyses. For unadjusted comparisons of patients by age at HCT, P values are from one-way ANOVA or Fisher’s exact test. Otherwise, all analyses had the form of multivariate linear, logistic, or multinomial regression, depending on the outcome. Analyses involving both HCT recipients and controls used generalized estimating equations (GEE) with robust standard errors to account for sibling relationships between them. Analyses involving only HCT recipients used independent-observations analyses.
Analyses testing the association between BMD Z-score and risk factors in HCT recipients were adjusted for Tanner stage and height Z-score. The following risk factors were considered: age at HCT, gender, BMI percentile, percent fat mass, LBM adjusted for height, IGF-1 SDs, calcium intake, vitamin D intake, screen time, hypothyroidism, hypogonadism, GHD, cumulative dose of steroids, conditioning regimens (chemotherapy, TBI, CRT), history of acute GVHD grades II–IV, and history of chronic GVHD (limited or extensive).
In exploratory analyses, each of the TBMD and LBMD Z-scores was associated with height Z-score, with the association following a straight line with a change in the line’s slope at height Z-score = −0.5. Thus in analyses adjusting for height Z-score, height Z-score was entered linearly with a change in slope at height Z-score = −0.5. Height Z-score and BMI percentile were calculated using 2000 CDC growth charts. All analyses were done using the SAS system (v. 9.2; SAS Institute, Cary, NC). All P-values are two-sided and <0.05 is considered statistically significant.
RESULTS
Participant characteristics
Participants included 151 HCT recipients and 92 sibling controls aged 10–50.5 years and 10.5–48 years at study visit respectively. Age at most recent HCT was 6 months-25.2 years (84% were <18 years at HCT), and time since HCT was 2.6–31.5 years. The long-term follow up and wide range of ages at HCT provided an opportunity to examine the impact of age at time of HCT on BMD Z-scores. Table 1 and Table 2 show characteristics of the study population.
Table 1.
Characteristics of study participants.
| Characteristic | Controls | Age (yr) at HCT | Pairwise P values | ||||
|---|---|---|---|---|---|---|---|
|
| |||||||
| <10 [A] | 10–18 [B] | >18 [C] | A vs B | A vs C | B vs C | ||
| n | 92 | 76 | 51 | 24 | - | - | - |
| Male | 49 (53) | 47 (62) | 26 (51) | 14 (58) | 0.29 | 0.84 | 0.55 |
| Race | |||||||
| Non-black | 90 (98) | 71 (93) | 51 (100) | 23 (96) | 0.082 | 1.00 | 0.32 |
| Black | 2 (2) | 5 (7) | 0 (0) | 1 (4) | |||
| Age at study (yr) | 22.3±8.0 | 20.5±6.4 | 26.6±7.6*** | 34.1±8.4*** | <0.0001 | <0.0001 | 0.0002 |
| Age at HCT (yr) | - | 5.5±2.7 | 14.3±2.2 | 20.8±1.8 | <0.0001 | <0.0001 | <0.0001 |
| Time since HCT (yr) | - | 15.0±6.2 | 12.2±7.4 | 13.3±7.7 | 0.024 | 0.27 | 0.54 |
| Tanner stagea | 0.024 | 0.38 | 0.73 | 0.003 | 0.055 | 1.00 | |
| I | 2 (2) | 6 (8) | 0 (0) | 0 (0) | |||
| II–III | 5 (6) | 11 (15) | 1 (2) | 0 (0) | |||
| IV–V | 79 (92) | 55 (77) | 47 (98) | 21 (100) | |||
| Median | 5 | 5 | 5 | 5 | |||
| Missing, n | 6 | 4 | 3 | 3 | |||
| Height Z-score | 0.4±0.9 | −1.2±1.2*** | −0.3±1.1*** | 0.1±1.2 | <0.0001 | <0.0001 | 0.15 |
| BMI percentile | 62±26 | 47±34*** | 58±33 | 68±28 | 0.06 | 0.003 | 0.17 |
| Screen time (≥2 hr) | 52 (66) | 56 (79) | 31 (70) | 12 (67) | 0.22 | 0.22 | 0.84 |
| IGF-1 SDs | −0.6±0.9 | −1.2±1.1* | −1.3±0.9*** | −1.4±1.1*** | 0.51 | 0.40 | 0.77 |
| GH deficiency | - | 11 (19) | 5 (11) | 1 (4) | 0.26 | 0.12 | 0.36 |
| Hypothyroidism | 1 (1) | 36 (47)*** | 11 (22)** | 4 (17)** | 0.0042 | 0.013 | 0.72 |
| Hypogonadism | 1 (1) | 8 (11)* | 11 (22)** | 4 (17)* | 0.093 | 0.36 | 0.67 |
| Calcium intakeb | 1090±498 | 1022±546 | 964±422 | 954±313 | 0.68 | 0.52 | 0.83 |
| Vitamin D intakec | 270±179 | 266±199 | 227±161 | 277±159 | 0.24 | 0.91 | 0.28 |
Data are presented as average ± SD, adjusted average ± SE for adjusted characteristics, or n (%).
P value refers to the difference, between groups, in the distribution of Tanner stage among the available categories.
expressed in mg/day,
expressed in IU/day,
P <0.05,
P <0.01,
P <0.001 indicate significant difference between a given age-at-HCT group and controls. The P values are provided for the purposes of exploratory comparisons.
Table 2.
Diagnosis and treatment characteristics in HCT recipients.
| Characteristic | Age (yr) at HCT | Pairwise P values | ||||
|---|---|---|---|---|---|---|
|
| ||||||
| <10 [A] | 10–18 [B] | >18 [C] | A vs B | A vs C | B vs C | |
| n | 76 | 51 | 24 | - | - | - |
| Malignancy | ||||||
| Lymphoid | 36 (47) | 17 (33) | 3 (13) | 0.14 | 0.0039 | 0.09 |
| Myeloid | 38 (50) | 28 (55) | 12 (50) | 0.72 | 1.00 | 0.81 |
| Type of transplant | 0.65a | 0.18a | 0.083a | |||
| Autologous | 17 (22) | 9 (18) | 9 (38) | |||
| Allogeneic | 59 (78) | 42 (82) | 15 (62) | |||
| Conditioning regimen | 0.09a | 0.014a | 0.46a | |||
| Chemotherapy | 12 (16) | 15 (29) | 8 (33) | |||
| Chemo+TBI | 42 (55) | 28 (55) | 15 (63) | |||
| Chemo+TBI+CRT | 22 (29) | 8 (16) | 1 (4) | |||
| TBI | 64 (84) | 36 (71) | 16 (67) | 0.08 | 0.08 | 0.79 |
| TBI+CRT | 22 (29) | 8 (16) | 1 (4) | 0.09 | 0.012 | 0.26 |
| Acute GVHD | 36 (47) | 22 (43) | 11 (46) | 0.72 | 1.00 | 1.00 |
| Chronic GVHD | 20 (26) | 16 (31) | 7 (29) | 0.55 | 0.80 | 1.00 |
| Cumulative dose of steroids (mg/m2)b | 3587±3971 | 5166±6808 | 5667±7035 | 0.22 | 0.34 | 0.83 |
Data are presented as average ± SD, or n (%).
P value refers to the difference, between groups, in the distribution of the outcome among the available categories,
expressed as total dose in milligrams of prednisone equivalent received during and after HCT. Diagnoses included acute myeloid leukemia (AML, n=54), acute lymphoblastic leukemia (ALL, n=47), chronic myeloid leukemia (CML, n=15), myelodysplastic syndrome (MDS, n=13), Hodgkin’s disease (HD, n=12), and non-Hodgkin lymphoma (NHL, n=10). CRT, cranial radiation, GVHD, graft versus host disease, Acute GVHD: any grade II–IV GVHD. Chronic GVHD: any chronic GVHD, TBI, total body irradiation. Lymphoid malignancy: ALL and NHL, myeloid malignancy: AML+CML+MDS.
Bone mineral density
As shown in Fig. 1, the age-at HCT groups differed in TBMD and FNBMD Z-scores. Patients <10 years at HCT had BMD Z-scores significantly lower compared to those >18 years at HCT and controls (by 0.5 SD on average for TBMD and 0.8 SD for FNBMD for both group comparisons). Time since transplant was similar for patients <10 and >18 years at HCT (Table 1). Patients who were 10–18 years at HCT had intermediate Z-scores between the other two age-at-HCT groups (Fig. 1) and a higher proportion of them had TBMD Z-score ≥ −1 compared to controls (Table 3). Although there were no significant differences between age-at-HCT groups in mean LBMD Z-scores (Fig. 1), prevalence of LBMD Z-scores ≤ −1 was significantly higher in patients <10 at HCT than in controls (Table 3).
Fig. 1. Total body, lumbar spine, and femoral neck BMD Z-scores adjusted for height Z-scores according to age at HCT.
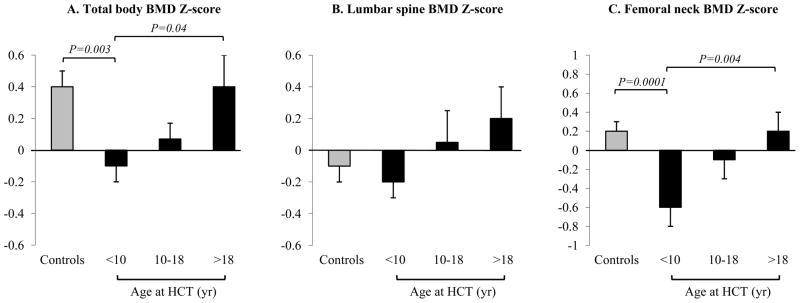
Data are shown as adjusted average ± SE. Femoral neck BMD Z-scores were obtained only in HCT recipients and controls ≥20 years at study visit. Patients <10 years at HCT show the greatest BMD deficits.
Table 3.
DXA measures.
| Characteristic | Controls | Age (yr) at HCT | Pairwise P values | ||||
|---|---|---|---|---|---|---|---|
|
| |||||||
| <10 [A] | 10–18 [B] | >18 [C] | A vs B | A vs C | B vs C | ||
| n | 92 | 76 | 51 | 24 | - | - | - |
| Percent fat mass | 26.4±10.7 | 29.2±10.1* | 35.3±9.3*** | 33.4±11.0** | 0.0013 | 0.16 | 0.43 |
| Total fat massa | 17.8±1.1 | 17.5±1.3 | 24.8±2.0** | 23.4±2.2* | 0.0007 | 0.03 | 0.65 |
| Lean body massa | 44.9±0.7 | 43.8±0.7 | 42.3±1.1 | 43.9±1.4 | 0.25 | 0.91 | 0.37 |
| TBMD Z-score ≤ −1 | 6 (7) | 11 (15) | 9 (18)* | 2 (8) | 0.63 | 0.43 | 0.29 |
| LBMD Z-score ≤ −1 | 13 (14) | 21 (28)* | 8 (16) | 4 (17) | 0.13 | 0.26 | 0.97 |
Data are presented as average ± SD, adjusted average ± SE for adjusted characteristics, or n (%).
expressed in kg, adjusted for height (cm),
P <0.05,
P <0.01,
P <0.001 indicate significant difference between a given age-at-HCT group and controls. The P values are provided for the purposes of exploratory comparisons.
Compared to patients >18 at HCT, those <10 years at HCT were younger at study entry, had lower height Z-score, lower BMI percentile, lower total fat mass adjusted for height, higher prevalence of hypothyroidism, and higher proportion exposed to TBI+CRT (Tables 1–3). All patients (except one in the 10–18 age group) were euthyroid at the study visit.
Risk factors associated with lower BMD in HCT recipients
Table 4 shows risk factors that were significantly associated with lower BMD Z-scores, including age at HCT, female sex, lower BMI percentile, lower LBM, lower IGF-1 SDs, GHD, lower calcium intake, lower vitamin D intake, and CRT. The age-at-HCT effect remained significant after adjusting the analysis further for sex and time since HCT (estimated effect of a 1-year increase in age-at-HCT 0.04, SE 0.013, P=0.002). The addition of CRT to chemotherapy and TBI lowered TBMD Z-score by an average of 0.5 compared to receiving chemotherapy only or chemotherapy+TBI.
Table 4.
Factors significantly associated with BMD in HCT recipients.
| Total BMD Z-score | |||
|---|---|---|---|
| Risk factor | Comparison | Estimate (SE) | P value |
| Age at HCT | 1 year increase | 0.03 (0.016) | 0.0354 |
| Gender | Male vs. Female | 0.52 (0.167) | 0.0024 |
| BMI Percentile | 1 % increase | 0.01 (0.003) | 0.0391 |
| Lean body mass adjusted for height | 1 kg increase | 0.04 (0.012) | 0.0004 |
| IGF-1 SDs | 1 unit increase | 0.20 (0.100) | 0.0472 |
| GHD | Yes vs. No | −0.77 (0.262) | 0.0041 |
| Calcium intake (mg/day) | 100 mg/day increase | 0.06 (0.018) | 0.0016 |
| Vitamin D intake (IU/day) | 100 IU/day increase | 0.16 (0.047) | 0.0007 |
| CRT | Yes vs. No | −0.50 (0.205) | 0.0160 |
| Lumbar BMD Z-score | |||
|---|---|---|---|
| Risk factor | Comparison | Estimate (SE) | P value |
| Gender | Male vs. Female | 0.48 (0.191) | 0.0134 |
| Lean body mass adjusted for height | 1 kg increase | 0.03 (0.014) | 0.0430 |
| Vitamin D intake (IU/day) | 100 IU/day increase | 0.13 (0.054) | 0.0189 |
Each of these risk factors was considered separately in an analysis adjusting for Tanner stage, height Z-score, and height Z-score spline at −0.5. Preliminary analyses using a loess smoother showed straight-line relationships between each BMD measure and height Z- score but with a change of the straight line’s slope at height Z-score = −0.5. Thus to adjust for height Z-score, the slope of each outcome on height Z-score was allowed to change at height Z-score = −0.5. GHD, growth hormone deficiency. This table includes only risk factors with P < 0.05, the methods section lists all risk factors considered.
To investigate possible explanations for the higher risk of lower BMD in females, male and female HCT recipients were compared according to body composition, screen time, calcium and vitamin D intake, prevalence of hypothyroidism, hypogonadism, and GHD. Compared to males, females had higher percent fat mass, higher total fat mass adjusted for height, lower LBM adjusted for height, lower calcium intake, and a trend toward a higher prevalence of hypothyroidism (Table 5). Although differences in body composition and calcium intake were statistically significant, they were similar to gender differences observed in controls except for LBM, where the differences for female vs. male HCT recipients were greater than in controls (P=0.0007). After adjusting for LBM and hypothyroidism, female patients still had lower TBMD Z-score by 0.4 (P=0.02) and LBMD Z-score by 0.5 (P=0.009) than males.
Table 5.
Characteristics of HCT recipients by gender
| Characteristic | Male | Female | P value |
|---|---|---|---|
| n | 87 | 64 | |
| Percent fat mass | 27.5 ± 9.1 | 38.1 ± 8.6 | <0.0001 |
| Total fat mass (kg) adjusted for height | 17.0 ± 1.2 | 25.2 ± 1.5 | <0.0001 |
| Lean body mass (kg) adjusted for height | 42.8 ± 0.7 | 37.9 ± 0.9 | <0.0001 |
| Calcium intake (mg/day) | 1062 ± 507 | 881 ± 403 | 0.0219 |
| Vitamin D intake (IU/day) | 265 ± 169 | 238 ± 197 | 0.40 |
| Hypothyroidism | 24 (28) | 27 (42) | 0.0814 |
| Hypogonadism | 10 (11) | 13 (20) | 0.17 |
Data are presented as average ± SD, adjusted average ± SE for adjusted characteristics, or n (%).
DISCUSSION
This study found that children transplanted at a younger age (<10 years) have lower TBMD and FNBMD Z-scores at an average of 14 years after HCT compared to patients transplanted at an older age (and to controls). Also, a larger proportion of those transplanted at age <10 years have LBMD Z-score ≤ −1 compared to controls. This is contrary to our hypothesis and studies in survivors of childhood cancer (who did not have HCT), showing that children <10 years at diagnosis have higher BMD than children >10 years at diagnosis26, 27. This suggests that HCT during childhood interrupts a critical period of bone acquisition during this time period and that an early insult to bone cells or stromal microenvironment has more lasting effects in younger patients. Our study’s finding that FNBMD is preferentially affected is consistent with long-term studies in adult HCT recipients28–30. Some of these differences in vulnerability to HCT effects may be due to different bone architecture at different skeletal sites, i.e., predominantly trabecular bone in the lumbar spine and cortical bone in the femoral neck.
While it is encouraging that mean BMD Z-scores in HCT recipients were >−2 (lower limit of normal), the difference of 0.5 SD in TBMD Z-score and 0.8 SD at the femoral neck is likely to be clinically significant. Based on logistic regression results in a study by Clark et al.31, in a general pediatric population the risk of fracture increases by an estimated 37% for a 0.5 SD decrease in size-adjusted bone mineral content, which is comparable to a Z-score reduction of 0.5. In HCT recipients, fracture incidence is currently unknown because either fractures were not recorded in the published studies or fracture data were based on patient recall. In a study performed 3–16 years after pediatric HCT, 8 out of 55 patients (15%) reported fractures after transplant1. Self-report underestimates the incidence of vertebral fractures, which are common in children after HCT (about 20%)32 yet frequently asymptomatic and therefore unrecognized for a long time in up to 80% of patients32, 33. This is important since vertebral fractures are indicators of poor bone quality and strength33. Studies in adults have shown that even a small reduction in BMD increases the risk of fractures in patients with impaired bone architecture33, 34. In addition, patients after HCT may have impaired balance and thus a greater risk of falling as a result of neurotoxic effects of chemotherapy35. All these factors must be considered when estimating fracture risk in this patient population.
There are several potential explanations for this study’s age-specific differences in BMD outcome. Even though time since transplant was similar in those who received HCT at age <10 years and at >18 years, the first group was also younger at evaluation. However, at the proximal femur, 75–80% of adult peak BMD is achieved by age 12–13 years11 and all patients who had FNBMD measured, including controls, were ≥20 years. Higher prevalence of hypothyroidism in the group <10 years at HCT is consistent with other studies that found a strong association between young age at HCT and thyroid dysfunction, likely due to higher sensitivity of the thyroid gland to radiation in younger patients36, 37. It is difficult to determine if hypothyroidism and lower BMD Z-score are causally related in this cohort because all patients (except one) were euthyroid at the study visit. It is more likely that hypothyroidism reflects therapeutic exposure that has also contributed to impaired bone mineralization. In fact, patients <10 years at HCT differed significantly from other age-at-HCT groups in both diagnosis and exposure to TBI+CRT versus chemotherapy-only or chemotherapy+TBI conditioning.
A secondary goal of this study was to examine the association between BMD Z-scores and measures of body composition and other potential risk factors. This study found that lower BMI percentile, lower LBM, lower IGF-1 SDs, lower calcium and vitamin D intake as well as female sex, GHD, and CRT were associated with lower BMD Z-scores. The latter two factors may reflect strong association between GHD and CRT38. This study does not provide a clear explanation for the gender differences in BMD Z-scores but suggests that lower LBM (after accounting for the expected sex difference) and a higher rate of hypothyroidism may contribute to lower BMD in females. A recent study of childhood cancer survivors who did not undergo HCT also identified female sex as a risk factor for higher prevalence of fractures among aging female survivors35. TBI has been shown to be a risk factor for bone loss1. In the present study, TBI did not show a significant association with BMD Z-scores, although a larger proportion of patients <10 years at HCT received TBI alone or TBI+CRT compared to patients >18 years at HCT.
This study has several limitations. Since the population was predominantly white, the findings may not generalize to other racial groups. The cross-sectional design did not allow evaluation of BMD recovery over time. While DXA has several advantages, including low radiation exposure, ease of administration, and availability of body composition data, it does not provide information about bone architecture or strength. Although there was no direct measure of physical activity, screen time has been validated as a surrogate measure39, 40. Data on fractures were not collected, nor were radiographs of the thoracolumbar spine performed. Undetected compression fractures could have falsely increased LBMD, masking the difference between HCT recipients and controls.
In summary, this study identified young age at transplant as an important risk factor for bone deficits in young adulthood, suggesting that efforts to reduce bone loss should focus on this patient population. Patients should be screened periodically, particularly if other risk factors are present and offered appropriate intervention including optimization of calcium and vitamin D intake, exercise to improve body composition, and, when appropriate, GH supplementation.
Acknowledgments
Grant support: This study was supported by the National Institutes of Health (NIH): NCI grant RO1CA112530 to K.S.B., and the National Center for Research Resources (NCRR) Grants 1UL1RR033183 to the University of Minnesota Clinical and Translational Science Institute, and the General Clinical Research Center Program M01-RR00400, and to the University of Washington Clinical and Translational Science Institute, NCRR 1 ULI TR000423. The contents of this study are solely the responsibility of the authors and do not necessarily represent the official views of the CTSI or the NIH.
Footnotes
Conflict of interest: The authors declare no conflict of interest.
References
- 1.Mostoufi-Moab S, Ginsberg JP, Bunin N, Zemel B, Shults J, Leonard MB. Bone density and structure in long-term survivors of pediatric allogeneic hematopoietic stem cell transplantation. J Bone Miner Res. 2012;27(4):760–9. doi: 10.1002/jbmr.1499. [DOI] [PMC free article] [PubMed] [Google Scholar]
- 2.Bhatia S, Ramsay NK, Weisdorf D, Griffiths H, Robison LL. Bone mineral density in patients undergoing bone marrow transplantation for myeloid malignancies. Bone Marrow Transplant. 1998;22(1):87–90. doi: 10.1038/sj.bmt.1701275. [DOI] [PubMed] [Google Scholar]
- 3.Nysom K, Holm K, Michaelsen KF, Hertz H, Jacobsen N, Muller J, et al. Bone mass after allogeneic BMT for childhood leukaemia or lymphoma. Bone Marrow Transplant. 2000;25 (2):191–6. doi: 10.1038/sj.bmt.1702131. [DOI] [PubMed] [Google Scholar]
- 4.Kaste SC, Shidler TJ, Tong X, Srivastava DK, Rochester R, Hudson MM, et al. Bone mineral density and osteonecrosis in survivors of childhood allogeneic bone marrow transplantation. Bone Marrow Transplant. 2004;33(4):435–41. doi: 10.1038/sj.bmt.1704360. [DOI] [PubMed] [Google Scholar]
- 5.Perkins JL, Kunin-Batson AS, Youngren NM, Ness KK, Ulrich KJ, Hansen MJ, et al. Long-term follow-up of children who underwent hematopoeitic cell transplant (HCT) for AML or ALL at less than 3 years of age. Pediatr Blood Cancer. 2007;49(7):958–63. doi: 10.1002/pbc.21207. [DOI] [PubMed] [Google Scholar]
- 6.Carpenter PA, Hoffmeister P, Chesnut CH, 3rd, Storer B, Charuhas PM, Woolfrey AE, et al. Bisphosphonate therapy for reduced bone mineral density in children with chronic graft-versus-host disease. Biol Blood Marrow Transplant. 2007;13(6):683–90. doi: 10.1016/j.bbmt.2007.02.001. [DOI] [PubMed] [Google Scholar]
- 7.Daniels MW, Wilson DM, Paguntalan HG, Hoffman AR, Bachrach LK. Bone mineral density in pediatric transplant recipients. Transplantation. 2003;76(4):673–8. doi: 10.1097/01.TP.0000076627.70050.53. [DOI] [PubMed] [Google Scholar]
- 8.Petryk A, Bergemann TL, Polga KM, Ulrich KJ, Raatz SK, Brown DM, et al. Prospective study of changes in bone mineral density and turnover in children after hematopoietic cell transplantation. J Clin Endocrinol Metab. 2006;91(3):899–905. doi: 10.1210/jc.2005-1927. [DOI] [PubMed] [Google Scholar]
- 9.Bachrach LK, Sills IN. Clinical report-bone densitometry in children and adolescents. Pediatrics. 2011;127(1):189–94. doi: 10.1542/peds.2010-2961. [DOI] [PubMed] [Google Scholar]
- 10.Baxter-Jones AD, Faulkner RA, Forwood MR, Mirwald RL, Bailey DA. Bone mineral accrual from 8 to 30 years of age: an estimation of peak bone mass. J Bone Miner Res. 2011;26(8):1729–39. doi: 10.1002/jbmr.412. [DOI] [PubMed] [Google Scholar]
- 11.Jackowski SA, Kontulainen SA, Cooper DM, Lanovaz JL, Baxter-Jones AD. The timing of BMD and geometric adaptation at the proximal femur from childhood to early adulthood in males and females: a longitudinal study. J Bone Miner Res. 2011;26(11):2753–61. doi: 10.1002/jbmr.468. [DOI] [PubMed] [Google Scholar]
- 12.Polgreen LE, Rudser K, Deyo M, Smith A, Baker KS, Petryk A. Changes in biomarkers of bone resorption over the first six months after pediatric hematopoietic cell transplantation. Pediatr Transplant. 2012;16(8):852–7. doi: 10.1111/j.1399-3046.2012.01780.x. [DOI] [PMC free article] [PubMed] [Google Scholar]
- 13.Lee WY, Baek KH, Rhee EJ, Tae HJ, Oh KW, Kang MI, et al. Impact of circulating bone-resorbing cytokines on the subsequent bone loss following bone marrow transplantation. Bone Marrow Transplant. 2004;34(1):89–94. doi: 10.1038/sj.bmt.1704535. [DOI] [PubMed] [Google Scholar]
- 14.Inaba H, Yang J, Kaste SC, Hartford CM, Motosue MS, Chemaitilly W, et al. Longitudinal changes in body mass and composition in survivors of childhood hematologic malignancies after allogeneic hematopoietic stem-cell transplantation. J Clin Oncol. 2012;30(32):3991–7. doi: 10.1200/JCO.2011.40.0457. [DOI] [PMC free article] [PubMed] [Google Scholar]
- 15.Taskinen M, Kananen K, Valimaki M, Loyttyniemi E, Hovi L, Saarinen-Pihkala U, et al. Risk factors for reduced areal bone mineral density in young adults with stem cell transplantation in childhood. Pediatr Transplant. 2006;10(1):90–7. doi: 10.1111/j.1399-3046.2005.00405.x. [DOI] [PubMed] [Google Scholar]
- 16.Tauchmanova L, Colao A, Lombardi G, Rotoli B, Selleri C. Bone loss and its management in long-term survivors from allogeneic stem cell transplantation. J Clin Endocrinol Metab. 2007;92(12):4536–45. doi: 10.1210/jc.2006-2870. [DOI] [PubMed] [Google Scholar]
- 17.Schonau E. Problems of bone analysis in childhood and adolescence. Pediatr Nephrol. 1998;12(5):420–9. doi: 10.1007/s004670050479. [DOI] [PubMed] [Google Scholar]
- 18.Boot AM, de Ridder MA, Pols HA, Krenning EP, de Muinck Keizer-Schrama SM. Bone mineral density in children and adolescents: relation to puberty, calcium intake, and physical activity. J Clin Endocrinol Metab. 1997;82(1):57–62. doi: 10.1210/jcem.82.1.3665. [DOI] [PubMed] [Google Scholar]
- 19.Mackie EJ, Radford M, Shalet SM. Gonadal function following chemotherapy for childhood Hodgkin’s disease. Med Pediatr Oncol. 1996;27(2):74–8. doi: 10.1002/(SICI)1096-911X(199608)27:2<74::AID-MPO2>3.0.CO;2-Q. [DOI] [PubMed] [Google Scholar]
- 20.Martinez AS, Domene HM, Ropelato MG, Jasper HG, Pennisi PA, Escobar ME, et al. Estrogen priming effect on growth hormone (GH) provocative test: a useful tool for the diagnosis of GH deficiency. J Clin Endocrinol Metab. 2000;85(11):4168–72. doi: 10.1210/jcem.85.11.6928. [DOI] [PubMed] [Google Scholar]
- 21.Petryk A, Baker KS, Frohnert B, Moran A, Chow L, Sinaiko AR, et al. Blunted response to a growth hormone stimulation test is associated with unfavorable cardiovascular risk factor profile in childhood cancer survivors. Pediatr Blood Cancer. 2012 doi: 10.1002/pbc.24308. [DOI] [PMC free article] [PubMed] [Google Scholar]
- 22.Biller BM, Samuels MH, Zagar A, Cook DM, Arafah BM, Bonert V, et al. Sensitivity and specificity of six tests for the diagnosis of adult GH deficiency. J Clin Endocrinol Metab. 2002;87(5):2067–79. doi: 10.1210/jcem.87.5.8509. [DOI] [PubMed] [Google Scholar]
- 23.Consensus guidelines for the diagnosis and treatment of growth hormone (GH) deficiency in childhood and adolescence: summary statement of the GH Research Society. GH Research Society. J Clin Endocrinol Metab. 2000;85(11):3990–3. doi: 10.1210/jcem.85.11.6984. [DOI] [PubMed] [Google Scholar]
- 24.Rockett HR, Wolf AM, Colditz GA. Development and reproducibility of a food frequency questionnaire to assess diets of older children and adolescents. Journal of the American Dietetic Association. 1995;95(3):336–40. doi: 10.1016/S0002-8223(95)00086-0. [DOI] [PubMed] [Google Scholar]
- 25.Wolf AM, Hunter DJ, Colditz GA, Manson JE, Stampfer MJ, Corsano KA, et al. Reproducibility and validity of a self-administered physical activity questionnaire. International journal of epidemiology. 1994;23(5):991–9. doi: 10.1093/ije/23.5.991. [DOI] [PubMed] [Google Scholar]
- 26.Athanassiadou F, Tragiannidis A, Rousso I, Katsos G, Sidi V, Papageorgiou T, et al. Bone mineral density in survivors of childhood acute lymphoblastic leukemia. Turk J Pediatr. 2006;48(2):101–4. [PubMed] [Google Scholar]
- 27.Henderson RC, Madsen CD, Davis C, Gold SH. Longitudinal evaluation of bone mineral density in children receiving chemotherapy. J Pediatr Hematol Oncol. 1998;20(4):322–6. doi: 10.1097/00043426-199807000-00008. [DOI] [PubMed] [Google Scholar]
- 28.Buchs N, Helg C, Collao C, Chapuis B, Slosman D, Bonjour JP, et al. Allogeneic bone marrow transplantation is associated with a preferential femoral neck bone loss. Osteoporos Int. 2001;12(10):880–6. doi: 10.1007/s001980170041. [DOI] [PubMed] [Google Scholar]
- 29.Kananen K, Volin L, Tahtela R, Laitinen K, Ruutu T, Valimaki MJ. Recovery of bone mass and normalization of bone turnover in long-term survivors of allogeneic bone marrow transplantation. Bone Marrow Transplant. 2002;29(1):33–9. doi: 10.1038/sj.bmt.1703317. [DOI] [PubMed] [Google Scholar]
- 30.Schulte CM, Beelen DW. Bone loss following hematopoietic stem cell transplantation: a long-term follow-up. Blood. 2004;103(10):3635–43. doi: 10.1182/blood-2003-09-3081. [DOI] [PubMed] [Google Scholar]
- 31.Clark EM, Ness AR, Bishop NJ, Tobias JH. Association between bone mass and fractures in children: a prospective cohort study. J Bone Miner Res. 2006;21(9):1489–95. doi: 10.1359/jbmr.060601. [DOI] [PMC free article] [PubMed] [Google Scholar]
- 32.Taskinen M, Saarinen-Pihkala UM, Hovi L, Vettenranta K, Makitie O. Bone health in children and adolescents after allogeneic stem cell transplantation: high prevalence of vertebral compression fractures. Cancer. 2007;110(2):442–51. doi: 10.1002/cncr.22796. [DOI] [PubMed] [Google Scholar]
- 33.Ross PD, Davis JW, Epstein RS, Wasnich RD. Pre-existing fractures and bone mass predict vertebral fracture incidence in women. Annals of internal medicine. 1991;114(11):919–23. doi: 10.7326/0003-4819-114-11-919. [DOI] [PubMed] [Google Scholar]
- 34.Seeman E. The structural and biomechanical basis of the gain and loss of bone strength in women and men. Endocrinol Metab Clin North Am. 2003;32(1):25–38. doi: 10.1016/s0889-8529(02)00078-6. [DOI] [PubMed] [Google Scholar]
- 35.Wilson CL, Dilley K, Ness KK, Leisenring WL, Sklar CA, Kaste SC, et al. Fractures among long-term survivors of childhood cancer: A report from the Childhood Cancer Survivor Study. Cancer. 2012;118(23):5920–8. doi: 10.1002/cncr.27626. [DOI] [PMC free article] [PubMed] [Google Scholar]
- 36.Ishiguro H, Yasuda Y, Tomita Y, Shinagawa T, Shimizu T, Morimoto T, et al. Long-term follow-up of thyroid function in patients who received bone marrow transplantation during childhood and adolescence. J Clin Endocrinol Metab. 2004;89(12):5981–6. doi: 10.1210/jc.2004-0836. [DOI] [PubMed] [Google Scholar]
- 37.Bailey HK, Kappy MS, Giller RH, Gralla J. Time-course and risk factors of hypothyroidism following allogeneic hematopoietic stem cell transplantation (HSCT) in children conditioned with fractionated total body irradiation. Pediatr Blood Cancer. 2008;51 (3):405–9. doi: 10.1002/pbc.21634. [DOI] [PubMed] [Google Scholar]
- 38.Adan L, Trivin C, Sainte-Rose C, Zucker JM, Hartmann O, Brauner R. GH deficiency caused by cranial irradiation during childhood: factors and markers in young adults. J Clin Endocrinol Metab. 2001;86(11):5245–51. doi: 10.1210/jcem.86.11.8056. [DOI] [PubMed] [Google Scholar]
- 39.Serrano-Sanchez JA, Marti-Trujillo S, Lera-Navarro A, Dorado-Garcia C, Gonzalez-Henriquez JJ, Sanchis-Moysi J. Associations between screen time and physical activity among Spanish adolescents. PloS one. 2011;6(9):e24453. doi: 10.1371/journal.pone.0024453. [DOI] [PMC free article] [PubMed] [Google Scholar]
- 40.Polgreen LE, Petryk A, Dietz AC, Sinaiko AR, Leisenring W, Goodman P, et al. Modifiable risk factors associated with bone deficits in childhood cancer survivors. BMC pediatrics. 2012;12:40. doi: 10.1186/1471-2431-12-40. [DOI] [PMC free article] [PubMed] [Google Scholar]