Abstract
Objectives
Amylase concentration in respiratory secretions was reported to be a potentially useful marker for aspiration and pneumonia. The aim of this study was to determine accuracy of α-amylase in diagnosing microaspiration in critically ill patients.
Methods
Retrospective analysis of prospectively collected data collected in a medical ICU. All patients requiring mechanical ventilation for at least 48 h, and included in a previous randomized controlled trial were eligible for this study, provided that at least one tracheal aspirate was available for α-amylase measurement. As part of the initial trial, pepsin was quantitatively measured in all tracheal aspirates during a 48-h period. All tracheal aspirates were frozen, allowing subsequent measurement of α-amylase for the purpose of the current study. Microaspiration was defined as the presence of at least one positive tracheal aspirate for pepsin (>200 ng.mL−1). Abundant microaspiration was defined as the presence of pepsin at significant level in >74% of tracheal aspirates.
Results
Amylase was measured in 1055 tracheal aspirates, collected from 109 patients. Using mean α-amylase level per patient, accuracy of α-amylase in diagnosing microaspiration was moderate (area under the receiver operator curve 0.72±0.05 [95%CI 0.61–0.83], for an α-amylase value of 1685 UI.L−1). However, when α-amylase levels, coming from all samples, were taken into account, area under the receiver operator curve was 0.56±0.05 [0.53–0.60]. Mean α-amylase level, and percentage of tracheal aspirates positive for α-amylase were significantly higher in patients with microaspiration, and in patients with abundant microaspiration compared with those with no microaspiration; and similar in patients with microaspiration compared with those with abundant microaspiration. α-amylase and pepsin were significantly correlated (r2 = 0.305, p = 0.001).
Conclusion
Accuracy of mean α-amylase in diagnosing microaspiration is moderate. Further, when all α-amylase levels were taken into account, α-amylase was inaccurate in diagnosing microaspiration, compared with pepsin.
Introduction
Despite the increased use of non-invasive ventilation, and high-flow nasal oxygen in patients with acute respiratory failure, intubation is still frequently performed in critically ill patients [1]. This procedure is associated with several complications, including ventilator-associated pneumonia (VAP), and tracheal ischemic lesions [2]. Although the incidence of VAP has probably decreased in the United States [3], this infection is still common in other countries [4], [5]. In addition, VAP is associated with prolonged duration of mechanical ventilation, and an overall attributable mortality of 13% [6]–[8].
Microaspiration of contaminated oropharyngeal and gastric secretions occur in a large proportion of intubated patients, and is a key factor in the pathogenesis of VAP [9]. Diagnosis of microaspiration in intubated critically-ill patients is important, in order to evaluate the efficiency of preventive measures aiming at decreasing the incidence of microaspiration, and VAP [10], [11]. Therefore, to test the efficiency of a new device aiming at preventing microaspiration, and VAP, it would be easier to first perform preliminary studies to evaluate the efficiency of such a device in preventing microaspiration before conduction large multicenter studies to test its impact on VAP incidence.
Several markers have been used to diagnose microaspiration of contaminated oropharyngeal, and gastric secretions in intubated critically ill patients, including technetium 99 m [12], blue dye [13], bile acids [14], and pepsin [9], [15]. However, several limitations of these markers preclude their routine use for clinical or experimental studies. Technetium 99 m is the gold standard for diagnosing microaspiration [12]. However, radioactive effects of this marker, and the need to transport the patient to the radiology department are major limitations for its routine use [10]. Blue dye is the most frequently used marker for aspiration [13], [16]. However, this marker is qualitative, and does not allow accurate quantification of the quantity of secretions aspirated in critically ill patients. Quantifying microaspirated secretions is important in this population, because the occurrence of lower respiratory infection is tightly correlated to the quantity of aspirated bacteria [17]. A pilot study, performed in 19 critically ill patients, found significantly higher concentration of bile acids in tracheal aspirates of patients with suspected VAP compared with those without VAP [14]. Further, the same group reported higher cocnentrations of bile acid in oropharyngeal secretions of patients with VAP compared with those without VAP [18]. However, further large studies are required to evaluate the accuracy of bile acids in diagnosing microaspiration and VAP. Pepsin was validated by several animal and human studies as an accurate marker of microaspiration of gastric content [9], [19]–[21]. However, this marker has a short window of detection of approximately 2 hours. In addition, pepsin does not allow diagnosing microaspiration of oropharyngeal secretions. Therefore, an accurate and easy to measure marker for microaspiration is still needed in critically ill patients.
Recently, α-amylase concentration in tracheal secretions, and bronchoalveolar lavage (BAL) was reported to be a potentially interesting marker to diagnose microaspiration and bacterial pneumonia [22], [23]. This marker is easy to measure in routine, and is not expensive. Moreover, α-amylase does not present the above-discussed limitations of other markers of microaspiration. However, to our knowledge, no study has evaluated the accuracy of amylase in diagnosing microaspiration compared to any other marker for microaspiration. Therefore, we conducted this retrospective study to determine the accuracy of amylase in diagnosing microaspiration, compared with pepsin.
Patients and Methods
Ethical Aspects
This retrospective study was performed in a single 10-bed medical ICU during an 11-month period. Patients included in this study were all included in a prior randomized study (ClinicalTrial.gov NCT01082666) [24] that was approved by the institutional review board (IRB) of the Lille university hospital. The current study was also approved by the same IRB. Written consent was obtained from the patients or their proxies for the current study.
Inclusion and Exclusion Criteria
All patients included in our prior randomized controlled trial were eligible for this study, provided that at least one tracheal aspirate was available for α-amylase measurement. The only exclusion criterion was the impossibility of measurement of α-amylase, due to lack of sufficient quantity of tracheal secretions.
The initial randomized study [24] aimed to determine the impact of continuous control of cuff pressure on microaspiration of gastric contents. Patients >18 years, intubated and expected to require mechanical ventilation for at least 48 h were eligible for that study. Patients were excluded if they (a) were already enrolled in another trial, (b) had a contraindication for semirecumbent position, (c) had a contraindication for enteral nutrition, (d) had already undergone mechanical ventilation for >48 h at the time of screening for eligibility, (e) were admitted to the ICU with prior tracheostomy.
Study Population
All study patients were intubated and mechanically ventilated for at least 48 hours. All tracheal tubes used in this study were high-volume low-pressure, and polyvinyl chloride-cuffed. Tracheal tube size was 7.5, and 8 in women and men; respectively. Tracheal cuff pressure was kept around 25 cmH2O using manual manometer or a pneumatic device.
Study patients received enteral nutrition according to a written protocol, including residual gastric volume measurement, and feeding interruption when gastric residual is >200 mL. Sucralfate was used for stress ulcer prophylaxis. Proton pump inhibitors were used to treat documented oesophagitis or gastric ulcer. Continuous subglottic suctioning was not utilized. Sedation was based on a written protocol including remifentanil and midazolam. Ramsay score was used to evaluate consciousness. The target Ramsay score was determined by the physicians. The bedside nurse adjusted sedative infusion to obtain target sedation level. A minimal positive end expiratory pressure of 5 cm H2O was applied to all patients. In all patients, tracheal suctioning was routinely performed by nurses using an open tracheal suction system. This procedure was performed 8 times daily or more if clinically indicated. Patients remained in semirecumbent position. Head-of-bed elevation was measured and adjusted by nurses 8 times daily (Target 45°). An Angle Indicator, designed to clearly display whether the head-of-bed was adequately elevated, was placed on side rails of all beds.
Alpha Amylase and Pepsin Measurements
As part of the initial randomized controlled trial, pepsin was quantitatively measured in all tracheal aspirates during the 48 h following randomization. All tracheal aspirates were stored at −20°C which allowed subsequent measurement of α-amylase for the purpose of the current study [23].
Total amylase activity (salivary and pancreatic isoenzyme activity) and specific pancreatic amylase were measured in tracheal aspirates using commercially available kits (α-amylase EPS, and α-amylase EPS pancreatic respectively, from Roche Diagnostics, GmbH, Mannheim, Germany). Salivary amylase activity was calculated by the difference between total and pancreatic amylase activity.
Quantitative pepsin measurement was performed by an ELISA technique [24]. Briefly, polystyrene flat bottom microtiter plates were coated overnight at room temperature with 100 µl/well from each supernatant diluted two-fold in the coating buffer (PBS 0.1 M, pH 7.4). After wash steps, 100 µl of goat anti-pepsin antiserum (Interchim, Montluçon, France) diluted at 1∶2000 in PBS 0.1 M, pH 7.4 were added per well and incubated for two hours at 37°C. After washing, 100 µl/well of conjugate solution (alkaline phosphatase-labelled rabbit anti-goat IgG antiserum diluted at 1∶2000 in PBS 0.1 M, pH 7.4) were added and incubated for 1 hour at 37°C. The phosphatase alkaline activity was revealed by using p-nitrophenylphosphate as substrate. The concentration of pepsin in the tracheal aspirates was calculated from a standard calibration curve. Pepsin (EC 3.4.23.1) standards (25–400 ng/ml) were prepared by serial dilutions of a stock porcine gastric mucosa pepsin solution (100 µg/ml) (Merck, Darmstadt, Germany) in the coating buffer. The concentration of the stock solution used for standards was determined by means of the extinction coefficient of pepsin (EmM = 51.3 at 278 nm). Pepsin was considered as positive at 200 ng/mL (25×8). Tracheal aspirates were very thick in several patients. Therefore all samples were first diluted using N-acetylcysteine (1/4), followed by dilution with coating buffer (1/2).
Definitions and Data Collection
The primary objective of this study is to determine the accuracy of amylase in diagnosing microaspiration, compared with pepsin, in intubated critically ill patients.
Secondary objectives of this study were to determine the correlation between α-amylase and pepsin, and to compare α-amylase level and percentage of tracheal aspirates positive for α-amylase between patients with no microspiration, patients with microaspiration, and those with abundant microaspiration.
Microaspiration was defined as the presence of pepsin at significant level (>200 ng/mL) in at least one tracheal aspirate. Abundant microaspiration was defined as the presence of pepsin at significant level in more than 74% of tracheal aspirates (75th quartile of percentage of tracheal aspirates positive for pepsin in study patients).
A tracheal aspirate was considered as positive for α-amylase if the level of α-amylase was >1688 UI.L−1 (Youden’s index, defined as the best sensitivity and specificity for α-amylase to diagnose microaspiration).
All data were prospectively collected. The following data were collected at ICU admission: age, male gender, simplified acute physiology score II, logistic organ dysfunction (LOD) score [25], comorbidities (diabetes mellitus, chronic heart failure, COPD, cirrhosis, chronic renal failure, immunosuppression, gastroesophaheal reflux), and causes for ICU admission. The following data were collected during ICU stay: duration of prior intubation, size of tracheal tube, and LOD score at randomization; cuff pressure, head-of bed elevation, quantity of enteral nutrition, vomiting, prokinetic drugs, proton pump inhibitor use, sedation, Ramsay score, Glasgow coma score, paralytic agent use, ventilatory mode, and positive end expiratory pressure during the 48 h following randomization.
Statistical Methods
SPSS software (SPSS, Chicago, IL) was used for data analysis. Differences were considered significant if p<0.05. All P values were two-tailed. Categorical variables were described as frequencies (%). Normally distributed (Shapiro-wilk test) and skewed continuous variables were described as mean ± SD and median (interquartile range), respectively.
Patients were classified in three groups: no microaspiration, microaspiration, and abundant microaspiration. χ2 test, and Kruskal-Wallis test were used to compare qualitative and continuous variables between the three groups; respectively. If a significant difference was found between the three groups, further analyses were performed between each two groups. Appropriate corrections (Bonferoni) were made for multiple comparisons. For comparisons between each two groups, χ2 test or Fisher exact test were used to compare qualitative variables, as appropriate. Student t-test or Mann-Whitney U-test were used to compare normally distributed and skewed continuous variables, respectively.
To determine the accuracy of α-amylase in diagnosing microaspiration, the area under the receiver-operating characteristic curve ± SD was calculated. In addition, sensitivity, specificity, negative and positive predictive values were calculated. The cut-off value for α-amylase was the Youden’s index. These analyses were performed using the mean α-amylase values per patient. In addition, a second analysis was performed using α-amylase values coming from all samples, with adjustment for repeated measurements. This was done by using a generalized mixed model with the patient as random effect and the repeated measurements of α-amylase and microaspiration as independent and dependent variables, respectively.
Correlation between α-amylase and pepsin was analyzed by a Spearman test, and concordance was assumed by kappa coefficient.
Results
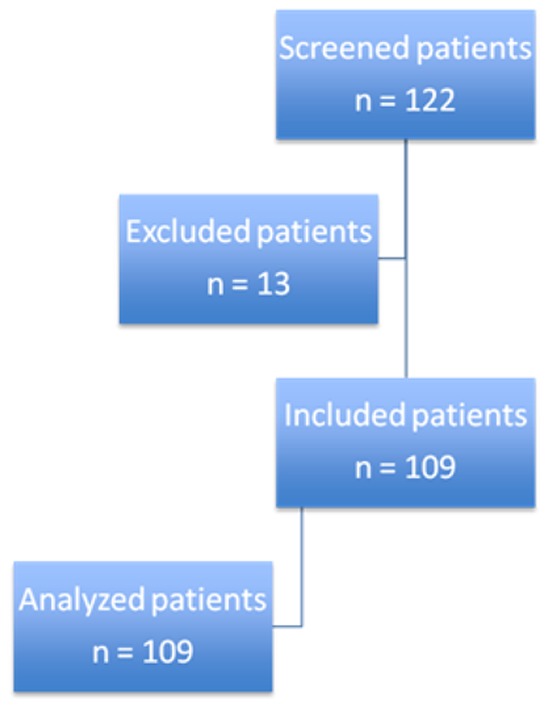
Amylase was measured in 1055 tracheal aspirates, representing 89.3% of the 1181 tracheal aspirates analyzed in the randomized trial. These tracheal aspirates were collected from 109 patients, representing 89% of the 122 patients included in the first trial. No sufficient quantity of tracheal secretions was available for α-amylase measurement in 126 specimens (11.2%) (Figure 1). No significant difference was found in patient characteristics between included patients, and those excluded because of insufficient quantity of secretions (data not shown). The median [IR] number of tracheal aspirates analyzed was 11 [8], [14] per patient. No significant difference was found in number of tracheal aspirates between patients with no microaspiration, patients with microaspiration, and those with abundant microaspiration.
Figure 1. Study flowchart.
Microaspiration was diagnosed in 55 (50%), and abundant microaspiration in 27 (24%) out of the 109 study patients. Patient characteristics are presented in Tables 1, and 2.
Table 1. Patient characteristics at ICU admission.
| No microaspiration n = 27 | Microaspiration n = 55 | Abundant microaspiration n = 27 | P value | |
| Age | 59 (50–68) | 58 (50–70) | 66 (53–77) | 0.244 |
| Male gender | 18 (66) | 35 (63) | 22 (81) | 0.225 |
| SAPS II | 39 (30–54) | 46 (34–52) | 44 (35–46) | 0.340 |
| LOD score | 4 (2–7) | 5 (4–7) | 5 (4–7) | 0.135 |
| Comorbidities | ||||
| Diabetes mellitus | 4 (14) | 8 (14) | 3 (11) | 0.899 |
| Chronic heart failure | 2 (7) | 2 (3) | 1 (3) | 0.378 |
| COPD | 10 (37) | 10 (18) | 12 (44)# | 0.030 |
| Cirrhosis | 3 (11) | 3 (5) | 3 (11) | 0.562 |
| Chronic renal failure | 0 (0) | 1 (1) | 1 (3) | 0.598 |
| Immunosupression | 8 (29)§ | 10 (18) | 1(3) | 0.042 |
| Gastroesphageal reflux | 2 (7) | 3 (5) | 0 (0) | 0.390 |
| Causes for ICU admission* | ||||
| Shock | 13 (48) | 19 (34) | 7 (25) | 0.226 |
| ARDS | 9 (33) | 7 (12) | 5 (18) | 0.084 |
| Community-acquired pneumonia | 6 (22) | 16 (29) | 5 (18) | 0.546 |
| Hospital-acquired pneumonia | 8 (29) | 8 (14) | 2 (7) | 0.076 |
| Healthcare-associated pneumonia | 3 (11) | 1 (1) | 4 (14) | 0.072 |
| Neurologic failure | 1 (3) | 13 (23) | 6 (22) | 0.076 |
| Acute exacerbation of COPD | 3 (11) | 4 (7) | 5 (18) | 0.311 |
| Congestive heart failure | 1 (3) | 0 (0) | 1(3) | 0.354 |
Data are n (%) or median (interquartile range).
SAPS: simplified acute physiology score; LOD: logistic organ dysfunction; COPD: chronic obstructive pulmonary disease; ICU: intensive care unit, ARDS: acute respiratory distress syndrome.
p<0.05 versus microaspiration,
p<0.05 versus abundant microaspiration.
*Several patients had more than one cause for ICU admission.
Table 2. Patient characteristics during ICU stay.
| No microaspiration n = 27 | Microaspiration n = 55 | Abundant microaspiration N = 27 | p value | |
| At inclusion | ||||
| Duration of prior intubation, d | 2 (1–2) | 1 (1–2) | 1 (0–2) | 0.364 |
| Size of tracheal tube | 8.0 (7.5–8) | 8.0 (7.5–8) | 8.0 (8–8) | 0.318 |
| LOD score | 4 (1–6) | 5 (3–8) | 4 (2–6) | 0.373 |
| During the 48 h following inclusion | ||||
| Pcuff, cmH2O | 24 (23–27) | 25 (22–26) | 22 (22–25) | 0.269 |
| Head of bed elevation, angle achieved | 43 (37–45) | 42 (36–45) | 37 (35–40) | 0.237 |
| Quantity of enteral nutrition, mL/d | 750 (750–1000) | 750 (750–1000) | 750 (500–1000) | 0.984 |
| Vomiting | 5 (18) | 6 (10) | 8 (29) | 0.109 |
| Prokinetic drugs | 5 (18) | 7 (12) | 8 (29) | 0.178 |
| Proton pump inhibitor use | 6 (22) | 17 (30) | 7 (25) | 0.694 |
| Sedation | 18 (66) | 32 (58) | 15 (55) | 0.674 |
| Ramsay score | 3 (2–4) | 4 (2–4) | 2 (2–4) | 0.166 |
| Glasgow score | 10 (5–15) | 7 (3–12) | 9 (6–14) | 0.280 |
| Paralytic agent use | 3 (11) | 3 (5) | 3 (11) | 0.562 |
| Ventilatory mode | 0.962 | |||
| ACV | 20 (74) | 42 (76) | 20 (74) | |
| PSV | 7 (25) | 13 (23) | 7 (25) | |
| Positive end expiratory pressure | 7.5 (5–8) | 6 (5–8) | 5 (5–8) | 0.445 |
Data are n (%) or median (interquartile range).
LOD: logistic organ dysfunction; Pcuff: cuff pressure; ACV: assist control ventilation, PSV: pressure support ventilation.
Patient Characteristics
A significant difference was found between the three groups with regards to percentage of patients with COPD, and immunosuppression. The rate of COPD was significantly higher in patients with abundant microaspiration compared with those with microaspiration (p = 0.017, OR [95% CI] 3.6 [1.2–10]). The rate of immunosuppression was significantly lower in patients with abundant microaspiration compared with those with no microaspiration (p = 0.024, OR [95% CI] 0.09 [0.11–0.79]). No significant difference was found in COPD, or immunosuppression rate between other study groups. Other patient characteristics were similar in the three groups.
Accuracy of α-amylase in Diagnosing Microaspiration and Abundant Microaspiration
Using the mean α-amylase level per patient, the area under the receiver operator curve for the accuracy of α-amylase in diagnosing microaspiration was 0.72±0.05, [95% CI 0.61–0.83] (Figure 2). α-amylase value providing the best sensitivity and specificity to diagnose microaspiration was 1685 UI.L−1. This value provided the following characteristics for α-amylase in diagnosing microaspiration: sensitivity 0.87 (0.78–0.93), specificity 0.29 (0.13–0.50), positive predictive value 0.79, and negative predictive value 0.44.
Figure 2. Accuracy of mean α-amylase in diagnosing microaspiration.
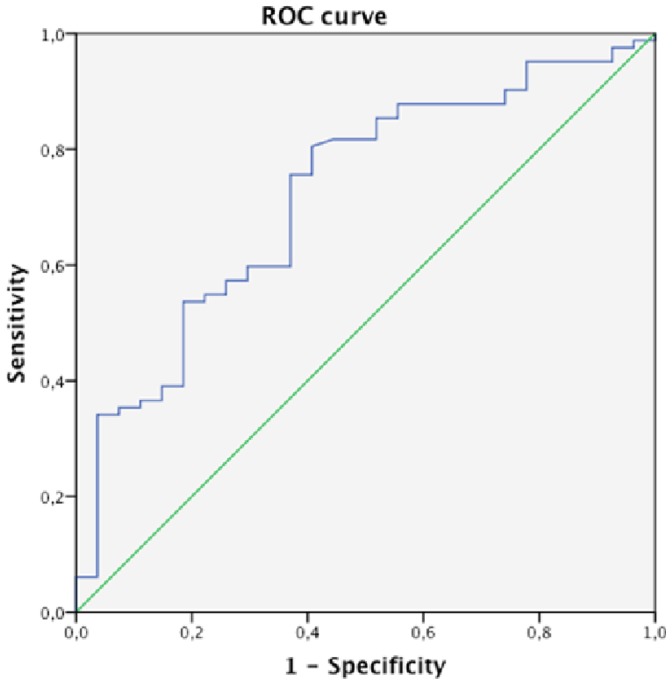
Area under the receiver operator curve 0.72±0.05 [95% CI 0.61–0.83].
Using all α-amylase levels, coming from all tracheal aspirates, and adjusting for repeated measurements, the area under the receiver operator curve for the accuracy of α-amylase in diagnosing microaspiration was 0.56±0.05, [95% CI 0.53–0.60] (Figure 3).
Figure 3. Accuracy of all α-amylase levels, coming from all tracheal aspirates, in diagnosing microaspiration.
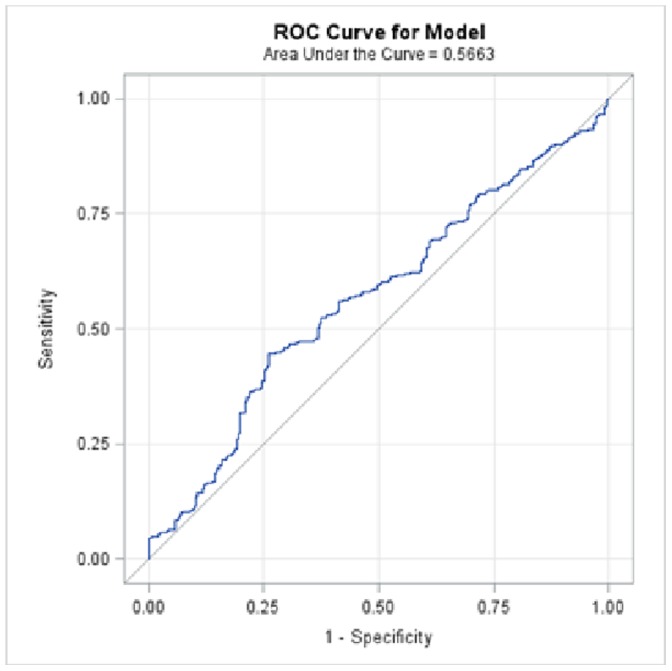
Area under the receiver operator curve 0.56±0.05 [95% CI 0.53–0.60].
Comparison of α-amylase Level between Different Study Groups
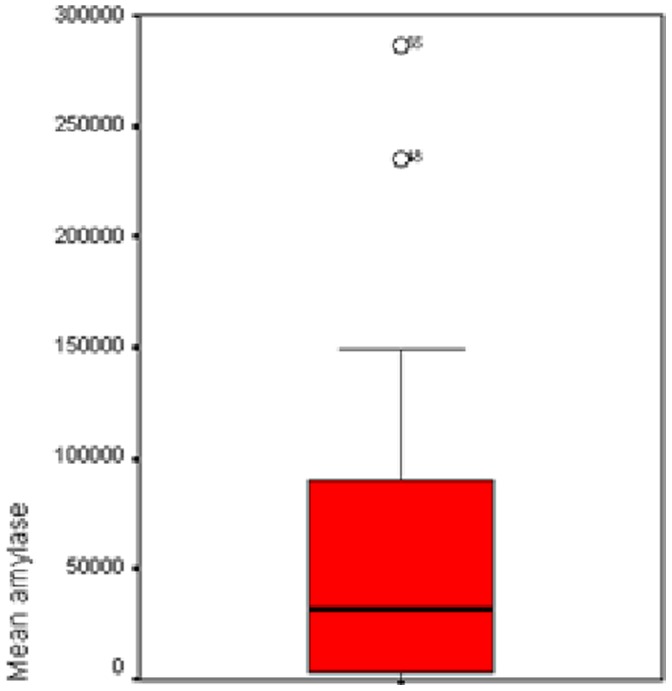
A significant difference was found in mean α-amylase level (Figures 4–6), and percentage of tracheal aspirates positive for α-amylase between the three groups. Mean α-amylase level, and percentage of tracheal aspirates positive for α-amylase were significantly higher in patients with microaspiration, and in patients with abundant microaspiration compared with those with no microaspiration. No significant difference was found in mean α-amylase level, or in percentage of tracheal aspirates positive for α-amylase between patients with microaspiration compared with those with abundant microaspiration (Table 3).
Figure 4. Mean α-amylase levels in patients with no microaspiration.
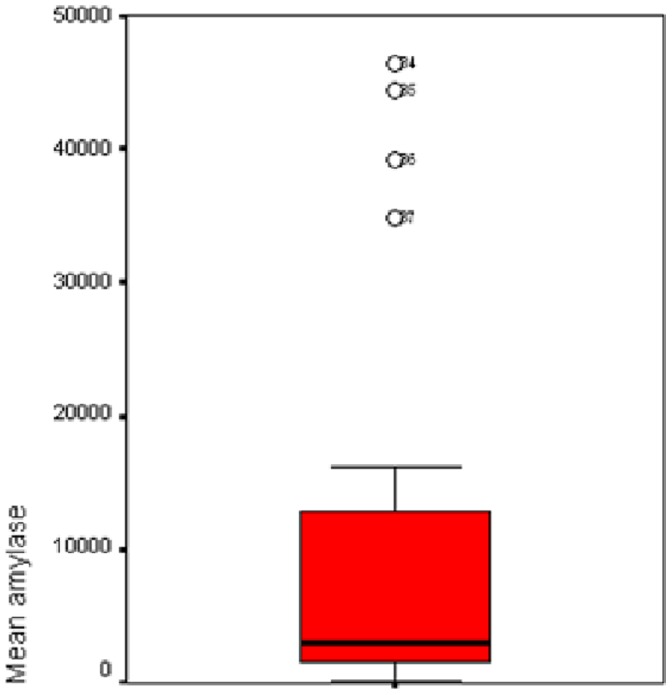
Figure 6. Mean α-amylase levels in patients with abundant microaspiration.
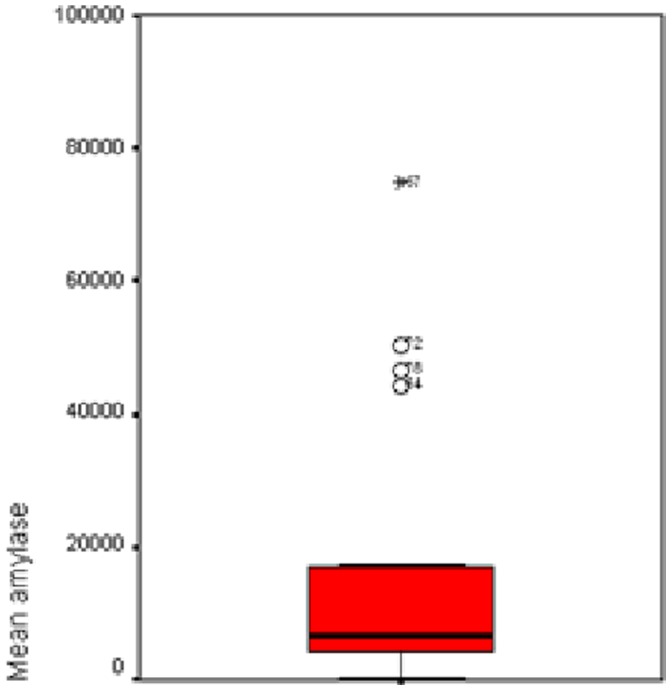
Table 3. Alpha amylase results.
| No microaspiration n = 27 | Microaspiration n = 55 | Abundant microaspiration n = 27 | p value | |
| Mean α-amylase | ||||
| Median (IQR) | 3075 (1526–12796)# , § | 22190 (4799–81443) | 9771 (2100–60672) | 0.001 |
| Mini-Max | 120–172466 | 146–635068 | 86–475660 | |
| % of tracheal aspirateswith α-amylase >1685 UI/* | ||||
| Median (IQR) | 62 (9–100)# , § | 100 (83–100) | 100 (31–100) | 0.011 |
| Mini-Max | 0–100 | 0–100 | 0–100 | |
p<0.05 versus microaspiration.
p<0.05 versus abundant microaspiration.
*Youden’s index.
Figure 5. Mean α-amylase levels in patients with microaspiration.
Correlation between α-amylase and Pepsin
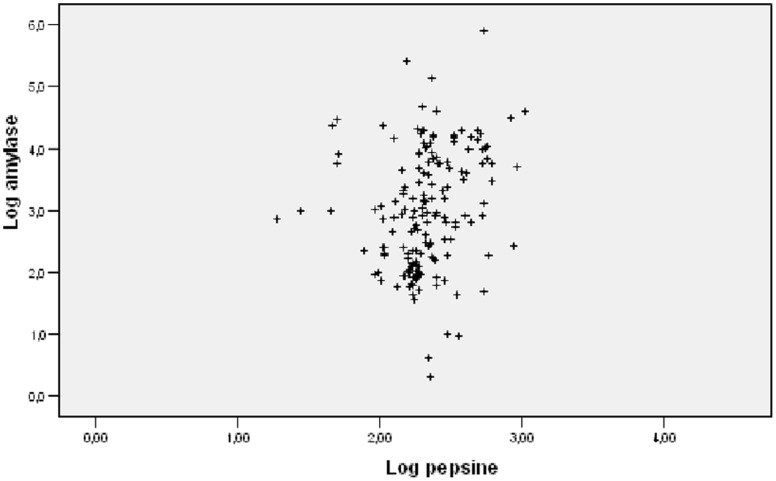
α-amylase was significantly correlated to pepsin levels (r2 = O.305, P = 0.001) (Figure 7).
Figure 7. Correlation between α-amylase and pepsin.
r2 = O.305, P = 0.001.
Discussion
The main findings of our study are the following: (1) accuracy of α-amylase in diagnosing microaspiration was moderate using the mean amylase level per patient, and low using all amylase levels. (2) Mean α-amylase level, and percentage of tracheal aspirates were significantly higher in patients with microaspiration, and in patients with abundant microaspiration compared with those with no microaspiration. (3) No significant difference was found in mean α-amylase level, and percentage of tracheal aspirates between patients with microaspiration and those with abundant microaspiration. (4) α-amylase was significantly correlated with pepsin, although this correlation was weak.
To the best of our knowledge, our study is the first to evaluate accuracy of α-amylase in diagnosing microaspiration in a large number of tracheal aspirates of critically-ill patients. Recently, two observational studies suggested that α-amylase measurement could be helpful in diagnosing aspiration pneumonia [22], and microaspiration [23] in critically-ill patients. Weiss and colleagues measured α-amylase in 296 BAL specimen from 280 patients with at least one risk factor for aspiration [22]. BAL amylase concentration increased with number of preintubation risk factors for aspiration. In addition, BAL amylase was significantly higher in patients with bacterial pneumonia. However, the ability of amylase in predicting bacterial pneumonia was moderate (area under the receiver operator curve 0.67 [95% CI 0.65–0.75]). Filloux and colleagues determined accuracy of α-amylase in diagnosing microaspiration in 26 patients intubated for >48 h (at high risk group), and 12 non intubated patients requiring BAL for different reasons (no microaspiration group) [23]. Tracheal amylase was significantly lower in the control group compared with the intubated group, and amylase gradually increased from tracheal, to subglottic, and oral samples. Interestingly, the cut-off value for α-amylase to diagnose microaspiration found in our study (1685 UI.L−1) was in line with that reported by these authors (1832 UI.L−1), in spite of different definition used for microaspiration.
The advantages in using α-amylase as a marker for microaspiration, compared with other markers are that α-amylase measurement is rapid, easy to perform, and cheap. However, the main drawback in using this marker is that microaspiration of gastric contents is not detected by α-amylase. The gastropulmonary route for entry of bacteria into the lower respiratory tract could be important in some patients [26]. The role of the stomach in microaspiration of contaminated secretions and subsequent VAP has been debated for a long period of time [27]. However, a prospective study using phenotyping of all bacterial strains isolated in oral, gastric, tracheal secretions, and BAL found both routes to be important in the pathogenesis of VAP [28].
Several factors could explain the poor performance of α-amylase in diagnosing microaspiration, and in differentiating abundant microaspiration from microaspiration. First, whilst α-amylase is a marker for microaspiration of oropharyngeal secretions, pepsin is a marker for microaspiration of gastric contents. In some patients, microaspiration of oropharyngeal secretions without microaspiration of gastric contents could have occurred. Second, the viscosity of oropharyngeal secretions and gastric contents is clearly different. Previous studies found viscosity to be an important factor influencing microaspiration of subglottic secretions through tracheal cuff [29]. Third, the detection window is different between these two markers, up to 72 hours for α-amylase [22] versus few hours for pepsin [9]. Therefore, the use of pepsin as a gold standard in our study has probably negatively affected the accuracy of α-amylase in diagnosing microaspiration.
Whilst COPD was associated with significantly higher rates of abundant microaspiration, immunosuppression was associated with significantly lower rates of microaspiration. COPD was identified as a risk factor for altered interaction between breathing and deglutition, resulting in deglutition abnormalities, and a higher risk for aspiration in this population [30], [31]. We compared factors that might have influenced microaspiration between patients with immunosuppression and those without immunosuppression (data not shown). The only significant difference between the two groups was younger age in immunosuppressed patients compared with those without immunosuppression. Advanced age was previously identified as a risk factor for aspiration and subsequent pneumonia [32]–[34]. However, the association between COPD, immunosuppression, and microaspiration was only found in univariate analysis, and a cause-to-effect relationship could not be confirmed.
Our study has some limitations. First, it was a retrospective single-center study. However, all data were prospectively collected. Second, markers for microaspiration were not measured during the whole period of mechanical ventilation. However, these measurements were performed during 48 h, representing 25% of median total duration of mechanical ventilation in study patients. Third, whilst the definition of microaspiration as the presence of pepsin at significant level in at least one tracheal aspirate is probably accurate, this definition only applies to microaspiration of gastric contents. Therefore, if another gold standard had been used, a better accuracy of α-amylase in diagnosing microaspiration could have been found. Further, the cut-off of 1688 UI.L−1 was based on the best sensitivity and specificity of α-amylase for diagnosing microaspiration in the same population. This might have artificially strengthened the results. However, we have repeated our analyses comparing % of tracheal aspirates positive for amylase between different study groups, using the cut-off reported by the above-discussed study [23]. The same results were obtained (data not shown), confirming that our cut-off of 1688 UI.L−1 is probably accurate. Fourth, we defined abundant microaspiration as the presence of pepsin in >74% of tracheal aspirates. Whilst this cut-off is the 75th quartiles of % of tracheal aspirate positive for pepsin in study patients, this level was not validated by other studies. However, it is important to differentiate microaspiration from abundant microaspiration, because the occurrence of VAP is tightly correlated to the quantity of aspirated bacteria [17].
Conclusion
Compared with pepsin, the accuracy of α-amylase in diagnosing microaspiration is low. Further prospective studies should compare α-amylase with other markers specific for microaspiration of oropharyngeal secretions, such as technetium 99, in order to determine the accuracy of amylase in diagnosing microaspiration.
Funding Statement
The authors have no support or funding to report.
References
- 1. Esteban A, Frutos-Vivar F, Muriel A, Ferguson ND, Peñuelas O, et al. (2013) Evolution of Mortality over Time in Patients Receiving Mechanical Ventilation. Am J Respir Crit Care Med 188: 220–230. [DOI] [PubMed] [Google Scholar]
- 2. Touat L, Fournier C, Ramon P, Salleron J, Durocher A, et al. (2013) Intubation-related tracheal ischemic lesions: incidence, risk factors, and outcome. Intensive Care Med 39: 575–582. [DOI] [PubMed] [Google Scholar]
- 3. Dudeck MA, Horan TC, Peterson KD, Allen-Bridson K, Morrell G, et al. (2013) National Healthcare Safety Network report, data summary for 2011, device-associated module. Am J Infect Control 41: 286–300. [DOI] [PMC free article] [PubMed] [Google Scholar]
- 4. Rosenthal VD, Rodrigues C, Álvarez-Moreno C, Madani N, Mitrev Z, et al. (2012) Effectiveness of a multidimensional approach for prevention of ventilator-associated pneumonia in adult intensive care units from 14 developing countries of four continents: findings of the International Nosocomial Infection Control Consortium. Crit Care Med 40: 3121–3128. [DOI] [PubMed] [Google Scholar]
- 5.European Center for Disease Prevention and Control: Annual Epidemiological Report (2011) Reporting on 2009 surveillance data and 2010 epidemic intelligence data. European Centre for Disease Prevention and Control network. Available: http://www.ecdc.europa.eu (n.d.). Accessed 2014 Feb 12.
- 6. Melsen WG, Rovers MM, Bonten MJM (2009) Ventilator-associated pneumonia and mortality: a systematic review of observational studies. Crit Care Med 37: 2709–2718. [DOI] [PubMed] [Google Scholar]
- 7.Melsen WG, Rovers MM, Groenwold RH, Bergmans DC, Camus C, et al.. (2013) Attributable mortality of ventilator-associated pneumonia: a meta-analysis of individual patient data from randomised prevention studies. Lancet Infect Dis. doi:10.1016/S1473-3099(13)70081-1. [DOI] [PubMed]
- 8. Jaillette E, Nseir S (2011) Relationship between inhaled β2-agonists and ventilator-associated pneumonia: a cohort study. Crit Care Med 39: 725–730. [DOI] [PubMed] [Google Scholar]
- 9. Metheny NA, Clouse RE, Chang Y-H, Stewart BJ, Oliver DA, et al. (2006) Tracheobronchial aspiration of gastric contents in critically ill tube-fed patients: frequency, outcomes, and risk factors. Crit Care Med 34: 1007–1015. [DOI] [PMC free article] [PubMed] [Google Scholar]
- 10. Nseir S, Zerimech F, Jaillette E, Artru F, Balduyck M (2011) Microaspiration in intubated critically ill patients: diagnosis and prevention. Infect Disord Drug Targets 11: 413–423. [DOI] [PubMed] [Google Scholar]
- 11. Jaoude PA, Knight PR, Ohtake P, El-Solh AA (2010) Biomarkers in the diagnosis of aspiration syndromes. Expert Rev Mol Diagn 10: 309–319. [DOI] [PMC free article] [PubMed] [Google Scholar]
- 12. Heyland DK, Drover JW, MacDonald S, Novak F, Lam M (2001) Effect of postpyloric feeding on gastroesophageal regurgitation and pulmonary microaspiration: results of a randomized controlled trial. Crit Care Med 29: 1495–1501. [DOI] [PubMed] [Google Scholar]
- 13. Beuret P, Philippon B, Fabre X, Kaaki M (2012) Effect of tracheal suctioning on aspiration past the tracheal tube cuff in mechanically ventilated patients. Ann Intensive Care 2: 45. [DOI] [PMC free article] [PubMed] [Google Scholar]
- 14. Wu Y-C, Hsu P-K, Su K-C, Liu L-Y, Tsai C-C, et al. (2009) Bile acid aspiration in suspected ventilator-associated pneumonia. Chest 136: 118–124. [DOI] [PubMed] [Google Scholar]
- 15. Nseir S, Zerimech F, De Jonckheere J, Alves I, Balduyck M, et al. (2010) Impact of polyurethane on variations in tracheal cuff pressure in critically ill patients: a prospective observational study. Intensive Care Med 36: 1156–1163. [DOI] [PubMed] [Google Scholar]
- 16. Lucangelo U, Zin WA, Antonaglia V, Petrucci L, Viviani M, et al. (2008) Effect of positive expiratory pressure and type of tracheal cuff on the incidence of aspiration in mechanically ventilated patients in an intensive care unit. Crit Care Med 36: 409–413. [DOI] [PubMed] [Google Scholar]
- 17. Nseir S, Marquette C-H (2003) Diagnosis of hospital-acquired pneumonia: postmortem studies. Infect Dis Clin North Am 17: 707–716. [DOI] [PubMed] [Google Scholar]
- 18. Tsai H-C, Lin F-C, Chen Y-C, Chang S-C (2012) The role of total bile acid in oral secretions in ventilator-associated pneumonia. J Crit Care 27: 526.e1–6. [DOI] [PubMed] [Google Scholar]
- 19. Metheny NA, Dahms TE, Chang Y-H, Stewart BJ, Frank PA, et al. (n.d.) Detection of pepsin in tracheal secretions after forced small-volume aspirations of gastric juice. JPEN J Parenter Enteral Nutr 28: 79–84. [DOI] [PMC free article] [PubMed] [Google Scholar]
- 20. Bohman JK, Kor DJ, Kashyap R, Gajic O, Festic E, et al. (2013) Airway pepsin levels in otherwise healthy surgical patients receiving general anesthesia with endotracheal intubation. Chest 143: 1407–1413. [DOI] [PMC free article] [PubMed] [Google Scholar]
- 21. Jaillette E, Zerimech F, De Jonckheere J, Makris D, Balduyck M, et al. (2013) Efficiency of a pneumatic device in controlling cuff pressure of polyurethane-cuffed tracheal tubes: a randomized controlled study. BMC Anesthesiol 13: 50. [DOI] [PMC free article] [PubMed] [Google Scholar]
- 22. Weiss CH, Moazed F, DiBardino D, Swaroop M, Wunderink RG (2013) Bronchoalveolar lavage amylase is associated with risk factors for aspiration and predicts bacterial pneumonia. Crit Care Med 41: 765–773. [DOI] [PubMed] [Google Scholar]
- 23. Filloux B, Bedel A, Nseir S, Mathiaux J, Amadéo B, et al. (2013) Tracheal amylase dosage as a marker for microaspiration: a pilot study. Minerva Anestesiol. 79(9): 1003–10. [PubMed] [Google Scholar]
- 24. Nseir S, Zerimech F, Fournier C, Lubret R, Ramon P, et al. (2011) Continuous control of tracheal cuff pressure and microaspiration of gastric contents in critically ill patients. Am J Respir Crit Care Med 184: 1041–1047. [DOI] [PubMed] [Google Scholar]
- 25. Le GallJR, Klar J, Lemeshow S, Saulnier F, Alberti C, et al. (1996) The Logistic Organ Dysfunction system. A new way to assess organ dysfunction in the intensive care unit. ICU Scoring Group. JAMA 276: 802–810. [DOI] [PubMed] [Google Scholar]
- 26. Niederman MS, Mantovani R, Schoch P, Papas J, Fein AM (1989) Patterns and routes of tracheobronchial colonization in mechanically ventilated patients. The role of nutritional status in colonization of the lower airway by Pseudomonas species. Chest 95: 155–161. [DOI] [PubMed] [Google Scholar]
- 27. Bonten MJ, Gaillard CA, van Tiel FH, Smeets HG, van der Geest S, et al. (1994) The stomach is not a source for colonization of the upper respiratory tract and pneumonia in ICU patients. Chest 105: 878–884. [DOI] [PubMed] [Google Scholar]
- 28. Garrouste-Orgeas M, Chevret S, Arlet G, Marie O, Rouveau M, et al. (1997) Oropharyngeal or gastric colonization and nosocomial pneumonia in adult intensive care unit patients. A prospective study based on genomic DNA analysis. Am J Respir Crit Care Med 156: 1647–1655. [DOI] [PubMed] [Google Scholar]
- 29. Winklmaier U, Wüst K, Schiller S, Wallner F (2006) Leakage of fluid in different types of tracheal tubes. Dysphagia 21: 237–242. [DOI] [PubMed] [Google Scholar]
- 30. Gross RD, Atwood CW, Ross SB, Olszewski JW, Eichhorn KA (2009) The coordination of breathing and swallowing in chronic obstructive pulmonary disease. Am J Respir Crit Care Med 179: 559–565. [DOI] [PubMed] [Google Scholar]
- 31. Cvejic L, Harding R, Churchward T, Turton A, Finlay P, et al. (2011) Laryngeal penetration and aspiration in individuals with stable COPD. Respirology 16: 269–275. [DOI] [PubMed] [Google Scholar]
- 32. Marik PE (2001) Aspiration pneumonitis and aspiration pneumonia. N Engl J Med 344: 665–671. [DOI] [PubMed] [Google Scholar]
- 33. Bosch X, Formiga F, Cuerpo S, Torres B, Rosón B, et al. (2012) Aspiration pneumonia in old patients with dementia. Prognostic factors of mortality. Eur J Intern Med 23: 720–726. [DOI] [PubMed] [Google Scholar]
- 34. El-Solh AA (2011) Nursing home acquired pneumonia: approach to management. Curr Opin Infect Dis 24: 148–151. [DOI] [PubMed] [Google Scholar]


