

Abstract
The designer self-assembling peptide RADA16-I forms nanofiber matrices which have shown great promise for regenerative medicine and 3-dimensional cell culture. RADA16-I has a β-strand-promoting alternating hydrophobic/charged motif, but arrangement of β-strands into the nanofiber structure has not been previously determined. Here we present a structural model of RADA16-I nanofibers, based on solid-state NMR measurements on samples with different schemes for 13C isotopic labeling. NMR peak positions and line widths indicate an ordered structure composed of β-strands. The NMR data show that the nanofibers are composed of two stacked β-sheets stabilized by a hydrophobic core formed by alanine sidechains, consistent with previous proposals. However, the previously proposed antiparallel β-sheet structure is ruled out by 13C-13C dipolar couplings. Instead, neighboring β-strands within β-sheets are parallel, with a registry shift that allows for cross-strand staggering of oppositely charged arginine and aspartate sidechains. The resulting structural model is compared to nanofiber dimensions observed via images taken by transmission electron microscopy and atomic force microscopy. Multiple NMR peaks for each alanine sidechain were observed and could be attributed to multiple configurations of sidechain packing within a single scheme for intermolecular packing.
Keywords: Self-assembling peptide, peptide nanofiber design, solid-state NMR spectroscopy, structure determination, molecular modeling
RADA16-I (COCH3-RADARADARADARADA-CONH2) forms nanofiber matrices in water with adaptive properties that make them attractive for biomedical applications. The formation of nanofiber networks in physiological conditions allows for use as an extracellular matrix capable of providing mechanical support for tissue regeneration1, 2 or 3-dimensional cell culture.3, 4 High effective porosities allow diffusion of nutrients or drug molecules.5 The ability to add functional motifs further expands the utility for tissue engineering.6–8 Dynamic reassembly following nanofiber fragmentation confers a “self-healing” property and may allow RADA16-I nanofiber networks to adapt to stimuli such as cell division or migration.9 Injection of RADA16-I nanofibers has been shown to stop bleeding in surgery and repair severed neurons to restore axon function.10, 11 The purely synthetic nature of RADA16-I avoids uncontrollable composition issues with natural products such as Matrigel.12 RADA16-I has the potential for harmless degradation in vivo,13, 14 eliciting little immune response when compared to other materials used in surgery.10
The RADA16-I sequence was discovered through combinatorial analysis of short amino acid sequences with alternating charged and hydrophobic residues.15 This pattern was originally observed in a segment of yeast protein15–18 and tends to promote β-strand formation. Self-assembly occurs through formation of hydrogen bonds between backbones of peptide molecules in extended conformations.19 Alternation of hydrophobic and hydrophilic residues also promotes formation of hydrophobic and hydrophilic faces for β-sheets, resulting in a hydrophobic nanofiber core and a hydrophilic nanofiber surface when two β-sheets stack into a basic fibril unit.20 These features are consistent with the general knowledge that sequence patterning can affect secondary structure as well as the cores and solvent exposed regions of proteins. Sequence patterning, however, is not sufficient to fully determine the 3-dimensional structure; many sequences with similar patterning resulted in different structures and self-assembly behaviors.15, 21 Furthermore, naturally occurring proteins that fold into β-strand domains or self-assemble into β-sheet fibrils rarely exhibit such simple patterning.22, 23 It has been proposed that RADA16-I forms antiparallel β-sheets, which would allow inter-strand staggering of positively and negatively charged sidechains.9
We have employed solid-state nuclear magnetic resonance (NMR) spectroscopy to characterize the structure of RADA16-I nanofibers. Measurements on samples with different schemes for 13C isotopic labeling allowed us to determine a structural model that describes how RADA16-I molecules are arranged within nanofibers. Peak positions within NMR spectra indicate that RADA16-I nanofibers consist of molecules in β-strand conformations, consistent with previous circular dichroism9 and Raman scattering24 experiments. Distance-dependent 13C-13C dipolar couplings in selectively labeled samples, however, are not consistent with the antiparallel β-sheet model. Instead, the results point to a structure consisting of parallel β-sheets, in which staggering of oppositely charged sidechains is achieved by a registry shift between β-strands in each β-sheet. We also compare nanofiber dimensions predicted by this model with those observed in images taken by transmission electron microscopy (TEM) and atomic force microscopy (AFM). The present structural characterization of RADA16-I nanofibers contributes to understanding self-assembling peptide design and provides a basis for improving the use of designer peptide nanofibers in biomedical applications.25–27
RESULTS AND DISCUSSION
Imaging of Nanofiber Dimensions
RADA16-I nanofiber morphologies observed by TEM and AFM are shown in Figures 1 and S1, respectively. Nanofiber widths observed via TEM range between 3 and 8 nm. Many nanofiber widths are less than previously reported width values near 10 nm measured by TEM.28, 29 However, RADA16-I nanofiber widths have been observed by TEM to increase with time in solution,29 suggesting lateral association of multiple subunits. AFM imaging, which directly reports height values of nanofibers deposited on mica surfaces, exhibits heights of mostly 1.5 nm. While the observed nanofiber heights are less than expected for a double layer of β-sheets with extended sidechains,9 the observation that heights can vary in distinct steps along the length of single nanofibers or between nanofibers has been used to infer the existence of multiple β-sheet layers.9, 24 In our AFM images, small segments within nanofibers have heights of 0.75 nm (Figure S1).
Figure 1.

Negatively stained TEM image of RADA16-I nanofibers. Nanofiber widths range from 3 to 8 nm.
RADA16-I NMR Peak Positions are Consistent with Ordered Linear β-Strands
Solid-state NMR spectra from RADA16-I nanofiber samples are shown in Figure 2. Isotopic labeling of RADA16-I nanofibers with uniform 13C (and 15N) on R9, A10, and D11 residues (Sample A, see Table 1) allowed assignments of NMR peaks to specific labeled sites and assignment of β-strand secondary structure. Sample A was analyzed by 2-dimensional (2D) finite pulse radio frequency driven recoupling (fpRFDR), which yields off-diagonal peaks (crosspeaks) corresponding to directly bonded 13C nuclei (Figure 2a).30 As indicated by colored horizontal and vertical lines in Figure 2a, crosspeak patterns were used for spectral assignments following 13C-13C bonding patterns within each uniformly labeled sidechain. Detailed analysis of crosspeak positions and line widths was performed via nonlinear fitting of Gaussian functions using Mathematica (Table S1). Secondary chemical shifts (peak positions relative to those of corresponding sites in random-coil model peptides) of carbonyl (CO), α-carbon (Cα), and β-carbon (Cβ) sites, are consistent with β-strand secondary structure (Tables 2 and S1).31 This interpretation is based on negative secondary shifts for R9, A10, and D11 of greater than 1.3 ppm for CO and Cα and positive secondary shifts of greater than 1.9 ppm for Cβ. Line widths on the order of 1 ppm (full width at half maximum) are similar to previous line widths observed for amyloid fibrils, indicating similar levels of structural order.32 We also note that, like amyloid fibrils, RADA16-I nanofibers exhibit hydration-dependent line narrowing without any loss of signal associated with hydration-dependent molecular motion (see Figure S2).
Figure 2.

a) 2D-fpRFDR 13C NMR spectrum of Sample A with chemical shift assignment paths for each of the labeled amino acids. b) CPMAS NMR spectra of Sample A (purple) and Sample B (blue). Vertical dotted lines are drawn to guide comparison of peak positions.
Table 1.
RADA16-I sample designations indicating different schemes of isotopic labeling for nanofibers prepared with the same protocol.
| Sample Designation | Uniformly 15N,13C-labeled residues | Selectively 13C-labeled sites |
|---|---|---|
| A | R9, A10, D11 | - |
| B | - | - |
| C | - | A4 Cβ |
| D | - | A8 Cβ, A14 CO |
| E | - | A8 CO, A14 Cβ |
| F | - | A4 CO, A6 CO |
Table 2.
Peak positions (δ) and line widths (full width at half maximum; lw), in ppm, for Sample A. Peak positions for random coil (RC) peptides are also tabulated. Estimated errors in both δ and lw are ± 0.1 ppm.
| CO | Cα | Cβ | |||||||
|---|---|---|---|---|---|---|---|---|---|
| RC | δ | lw | RC | δ | lw | RC | δ | lw | |
| R9 | 174.6 | 171.4 | 0.9 | 54.3 | 53.0 | 1.3 | 29.2 | 32.2 | 1.3 |
| A10 | 176.1 | 173.0 | 1.3 | 50.8 | 49.2 48.1 48.6 |
1.4 1.0 1.4 |
17.4 | 20.8 22.0 23.4 |
0.7 0.9 0.8 |
| D11 | 174.6 | 170.8 | 1.1 | 52.5 | 50.7 | 1.5 | 39.4 | 41.3 | 2.1 |
We observed 3 distinct 13C peaks with line widths less than 1 ppm for each alanine Cβ site. This observation indicates that distinct ordered structures coexist in the samples, and is clearly seen in Figure 2 for A10 Cβ labeled in Sample A (between 20 and 24 ppm). We also observed 3 peaks with similar positions and line widths in samples selectively labeled at A4 Cβ, A8 Cβ, and A14 Cβ (Samples C, D, and E, respectively; see Table 1 and Figure S3). Three peaks at similar chemical shifts from alanine Cβ sites were also observed in the natural abundance 1H-13C cross polarization magic angle spinning (CPMAS) spectrum from Sample B (Table 1 and Figure 2b). It should be noted that alanine Cβ sites are the only methyl carbon atoms in the peptide; other 13C sites in RADA16-I are not expected to show signals at these chemical shifts.33 In addition to the 3 prominent alanine Cβ peaks, there is a weak broad shoulder in the methyl signal below 20 ppm. This broad signal is observed on the diagonal of the 2D-fpRFDR spectrum from Sample A (Figure 2a) and in the CPMAS spectra from Samples A, C, D, and E (Figure S3), suggesting a minor population with disordered conformations throughout the amino acid sequence. We estimate that this minor signal represents less than 5% of the total RADA16-I population. Although this peak position is not inconsistent with β-strand secondary structure, further characterization of structure is precluded by the low signal intensity.
Comparison of CPMAS NMR spectra from Samples A and B indicates that a consistent β-strand secondary structure extends throughout the RADA16-I amino acid sequence (Figure 2b). As Sample B is not isotopically labeled, its natural abundance CPMAS NMR spectrum is due to equal contributions from 1% 13C atoms distributed evenly throughout all C sites in the sample. We performed a nonlinear fit of the CPMAS spectrum of Sample B, with initial conditions based on the positions and line widths of spectral components determined precisely from the 2D-fpRFDR spectrum of Sample A (Figure S4 and Table S2). The natural abundance peak positions and line widths for arginine, alanine, and aspartate, compared to those of corresponding labeled sites within Sample A, indicate that spectral components observed in Sample A are sufficient to fit the spectra in Sample B and allow full assignment of the natural abundance signals (Figure S5). The observation that chemical shifts for 13C nuclei within arginine, alanine, and aspartate residues do not vary significantly across the primary structure (Tables S2 and S3) indicates that secondary structure is also uniform throughout the molecule. Further confirmation of uniform secondary structure is seen in Table S3, which indicates little deviation in peak positions between natural abundance signals (Table S2) and signals from selectively labeled Samples C, D, and E (also see Figure S3). When the natural abundance peak positions were input into the TALOS software,34 we obtained estimates for ϕ and ψ backbone torsion angles (Table S4) that are consistent with β-strand secondary structure.
Validation of β-strand secondary structure is shown in the circular dichroism spectrum in Figure S6 (see also Supplementary Methods). As observed previously,9 this spectrum exhibits characteristic maxima and minima at 198 nm and 217 nm, respectively.
13C-13C Dipolar Recoupling NMR Data Constrain Intermolecular Packing and Rule Out In-Register Parallel β-sheets
Solid-state NMR measurements of 13C-13C dipolar couplings were performed using the PITHIRDS-CT pulse sequence in order to probe proximities between selectively 13C-labeled sites and test models for β-strand organization into β-sheets.35, 36 Decays in PITHIRDS-CT data are sensitive to interactions between proximate 13C nuclei in the sample because of the strong distance dependence of the dipolar interaction: coupling strength scales with r−3, where r is the inter-nuclear distance. When arrangements of 13C atoms are characterized by multiple distances, PITHIRDS-CT decays are most sensitive to the shortest 13C-13C distance, which we define here as the “nuclear spacing.” It should be emphasized that shapes of PITHIRDS-CT curves are also significantly affected by the 3-dimensional arrangement of 13C-labeled sites separated by distances close to the nuclear spacing.35 Samples prepared for PITHIRDS-CT measurements were labeled with 13C at selected alanine Cβ and CO sites (Samples C, D, E, and F, Table 1). The large chemical shift difference between methyl and CO NMR signals allows a single sample to be isotopically labeled at a Cβ and a CO site without affecting PITHIRDS-CT measurements on each site, as long as the Cβ and CO sites are separated by more than 1 nm.
PITHIRDS-CT data from selectively 13C-labeled samples are shown in Figure 3. As an experimental reference for a known distance, data are also shown for selectively labeled amyloid fibrils of the 42-residue Alzheimer’s β-amyloid peptide in Figure 3a. These amyloid fibrils are composed of molecules arranged into in-register parallel β-sheets.37 As a result, selective 13C labeling at the V36 CO or A21 Cβ of β-amyloid fibrils yielded PITHIRDS-CT decays that are consistent with linear arrangements of 13C nuclei with a constant nuclear spacing of 0.48 nm.37 The distance of 0.48 nm is the minimum distance between equivalent sites near backbones on adjacent molecules within a β-sheet. In comparison, only Sample F, which was labeled at two carbonyl sites (A4 and A6 CO), exhibited a nuclear spacing at this distance (Figure 3a). RADA16-I nanofibers labeled at the A4 Cβ (Sample C) and A8 CO (Sample E) exhibited PITHIRDS-CT decays that are significantly faster and slower than that of Sample F, respectively (Figure 3b). Furthermore, all 3 NMR peaks for the A4 Cβ decay similarly (see inset, Figure 3b). Data in Figure 3 are compared to simulated curves38 for sets of 9 13C atoms arranged in straight lines equally spaced by the indicated nuclear spacings. By comparing the PITHIRDS-CT decays for Samples C and E to amyloid fibril and simulated data, we estimate that these labeled sites correspond to 13C nuclear spacings of approximately 0.4 nm and 0.6 nm, respectively. Caution must be taken in the quantitative interpretation of PITHIRDS-CT decays: they are not simple measurements of inter-atomic distance because of effects introduced by nonlinear arrangements of atoms expected within RADA16-I nanofibers. We attribute a conservative error tolerance of ± 0.1 nm in our estimated nuclear spacings. In addition to numerical estimates of nuclear spacing, our structural interpretations are based on analysis of relative PITHIRDS-CT decay strengths for samples labeled at different sites.
Figure 3.
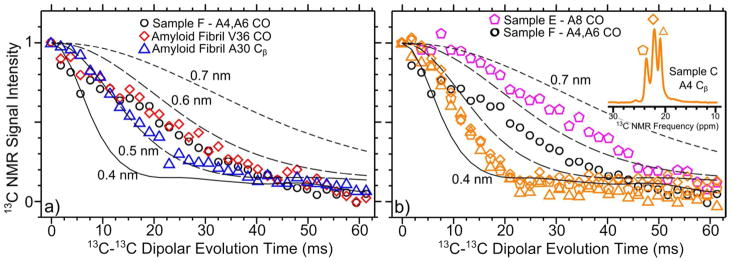
PITHIRDS-CT NMR measurements on samples selectively labeled with 13C. a) Data for Sample F compared to amyloid fibril data. b) Data for Samples C, E, and F. The estimated error for all data points is on the order of the symbol size. The curves correspond to simulated data for 13C atoms arranged in straight lines and separated by constant distances of 0.4 nm, 0.5 nm, 0.6 nm, and 0.7 nm.
It is immediately apparent that the PITHIRDS-CT decay for Sample E is measurably slower than that observed for Sample F, indicating that RADA16-I nanofibers are not composed of in-register parallel β-sheets. Furthermore, the faster decays for Sample C compared to the amyloid fibril decays are not possible within isolated β-sheets and will be discussed in terms of stacking of multiple β-sheets.
Molecular Modeling and Nuclear Spin Simulations Constrain Intermolecular Organization
The PITHRIDS-CT data provide important constraints on intermolecular organization, which we compared to predictions of models for possible RADA16-I nanofiber structures. Models considered represent arrangements of molecules within pairs of stacked β-sheets stabilized by hydrophobic interfaces. Such an interface is necessary to rationalize the 0.4 nm nuclear spacing observed for the alanine Cβ sites, which is less than the 0.48 nm minimum nuclear spacing for an isolated (in-register parallel) β-sheet. We follow the nomenclature of Sawaya et al.,36 who defined 8 symmetry classes for possible arrangements of β-strands organized into pairs of stacked β-sheets. We consider only 3 of the 8 classes (Classes 1, 3, and 5), because only these models predict hydrophobic cores composed of alanine sidechains (Figure 4). These configurations correspond to “homo zippers” in the nomenclature of Nielsen et al.39 All other symmetry classes defined by Sawaya et al. would position charged arginine and aspartate sidechains in direct contact with hydrophobic alanine sidechains. Such interfaces are inconsistent with the rapid PITHIRDS-CT decays measured for alanine Cβ sites, and are also physically unreasonable. As illustrated in Figure 4a, each β-strand is characterized by 2 faces: a hydrophilic face formed by adjacent alternating arginine and aspartate sidechains (+ and − charged at the experimental pH, respectively), and a hydrophobic face formed by alanine sidechains. The Class 1 and Class 3 models (Figure 4b and 4c, respectively) consist of in-register parallel β-sheets, which are inconsistent with the A8 CO PITHIRDS-CT data. However, as will be further discussed below, the data can be rationalized with parallel β-sheets by introducing a shift in alignment between adjacent β-strands within each β-sheet (registry shift). The Class 5 model is composed of antiparallel β-sheets, as was previously proposed for RADA16-I.9
Figure 4.
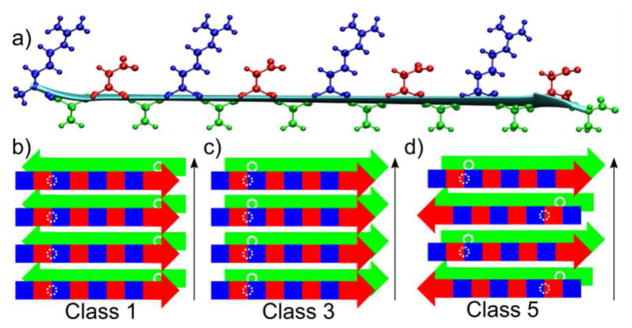
a) A model of a RADA16-I molecule in a β-strand conformation, with all atoms drawn for the arginine (blue), alanine (green), and aspartate (red) sidechains. This conformation creates hydrophobic (green) and hydrophilic (alternating blue (+) and red (−)) faces represented schematically in b-d. b-d) Schematic representations of nanofiber symmetry classes, originally defined by Sawaya et al., for RADA16-I β-strands arranged into stacks of 2 β-sheets. The white circles represent positions of A4 Cβ sites. Black arrows represent the long axis of the nanofiber.
The PITHIRDS-CT decay for Sample C (A4 Cβ) indicates inter-sheet dipolar couplings that are inconsistent with the Class 1 molecular model. This model predicts parallel β-sheets stacked such that β-strands in different β-sheets are oriented antiparallel. Thus, the 13C nuclear spacing for A4 Cβ sites would correspond to neighboring molecules within the same β-sheet (white circles in Figure 4b). This distance is at least 0.48 nm (for in-register parallel β-sheets), and is therefore too large to explain the A4 Cβ PITHIRDS-CT data in Figure 3b. Introducing a registry shift would only increase the 13C nuclear spacing for this model. Therefore we cannot reconcile the Class 1 model with the data.
The nearly identical PITHIRDS-CT decays for the 3 peaks corresponding to A4 Cβ suggest that the underlying non-equivalent structures do not differ in β-strand intermolecular organization. Similar behavior was observed for the GNNQQNY peptide analyzed by van der Wel et al.: fibril samples exhibited 3 distinct sets of NMR peaks for specific amino acids, while inter-molecular dipolar interactions indicated that all three structures corresponded to in-register parallel β-sheets.40, 41 We suggest that the existence of 3 peaks per labeled alanine Cβ site is due to multiple stable schemes for local arginine and aspartate sidechain packing, and that the RADA16-I nanofibers analyzed here can be represented by a single scheme for inter-molecular organization. We also observed identical PITHIRDS-CT decays for the 13C peaks observed with selective labeling of A8 Cβ (Figure 5). Slower decays for A14 Cβ and A14 CO, compared to the A4 Cβ and A8 CO, respectively, suggest disorder at the end of the peptide sequence (Figure S7).
Figure 5.

PITHIRDS-CT decays for A4 Cβ (Sample C, orange) and A8 Cβ (Sample D, green). Inset is a portion of the CPMAS NMR spectrum for A8 Cβ that displays which symbol correlates to which methyl peak. Error bars are on the order of the symbol size.
Further analysis of the PITHIRDS-CT data in Figure 3 was enabled by modeling via molecular dynamics simulations. These all-atom explicit solvent simulations consisted of models composed of 20 RADA16-I molecules and allowed us to predict 3-dimensional configurations for 13C-labeled sites within structures that are stable in silico. Figure 6 shows predicted positions of specified sites for different nanofiber models, corresponding to sites selected for 13C-labeling. Figure S8 includes a more comprehensive set of diagrams for different isotopically labeled sites within the different models. As 13C nuclear spacing is the strongest determinant of PITHIRDS-CT curves, these distances are tabulated for different labeled sites and nanofiber models in Table 3.
Figure 6.

Molecular models with the indicated symmetries, showing 13C atom positions for the specified labeled sites with selected inter-atomic distances. For each panel, an arrow or x indicates the axis of the nanofiber (Class 3R2 β-strands at an angle of 35° from the fiber axis). Black or red ovals indicate atom pairs within the same β-sheet and between different β-sheets, respectively. Molecular simulations predict variation of less than 8% for distance between otherwise equivalent pairs of spins within a nanofiber.
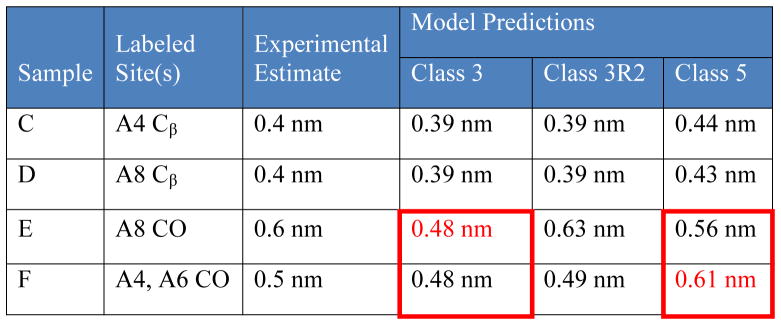
Table 3.
Comparison of Experimental and predicted 13C nuclear spacing for labeled RADA16-I. Experimental values were obtained from PITHIRDS-CT measurements and are believed to be accurate to within 0.1 nm (see Figure 3). Model predictions are based on molecular dynamics simulations, which exhibit variation in distance from molecule to molecule between otherwise equivalent pairs of spins which is less than 8%. Each number reported in red represents a model prediction which is considered inconsistent with the data because it differs from the experimental nuclear spacing by more than 0.1 nm. Red boxes indicate comparisons of nuclear spacing that predict relative PITHIRDS-CT decay strengths which are inconsistent with experimental results.
|
To rationalize the 0.6 nm 13C nuclear spacing implicated by the PITHIRDS-CT decays of the A8 CO in Sample E, the Class 3 model must be modified to include a registry shift of 2 amino acids between adjacent β-strands in the same β-sheet (Class 3R2; Figure 6a–c). This modification increases the 13C nuclear spacing for singly labeled A8 CO sites from 0.48 nm to 0.63 nm (Figure 6a-c) without affecting the closer 13C nuclear spacing for A4 Cβ sites of 0.39 nm (Figure 6d). Moreover, the Class 3R2 model also explains why the 13C nuclear spacing would decrease when both the A4 CO and A6 CO are 13C-labeled (Sample F): when the registry shifts are introduced to the Class 3 model, the A4 CO site on each β-strand becomes close to the A6 CO site (0.49 nm) on an adjacent β-strand in the same β-sheet (Figure 6e). Based on coordinates taken from the Class 3R2 model, observed trends for the RADA16-I PITHIRDS-CT decays (Figure 3b) are reproduced in the nuclear spin simulations shown in Figure 7 (solid curves). Each simulation involves 8 13C nuclei at positions predicted by the Class 3R2 model (see Figure S9). While these simulated curves offer useful semi-quantitative predictions that allow comparison of relative decay strengths, the nonlinear geometries and the limited number of simulated nuclear spins reduce the quantitative accuracy of simulated PITHIRDS-CT data.
Figure 7.

Simulated PITHIRDS-CT decay curves, each corresponding to 8 13C spins in positions predicted by the indicated labeling schemes within the Class 3R2 (solid curves) and Class 5 (dashed curves) models, respectively (see Figure S10). a) Comparison of predicted decays for carbonyl labeled Samples E (magenta) and F (black). b) Comparison of predicted decays for Samples C (orange) and D (green), respectively.
The faster decay observed in PIHTIRDS-CT data with Sample F compared to Sample E (Figure 3b) is incompatible with antiparallel β-sheets and therefore eliminates the Class 5 model. As illustrated in Figure 6f and g, the Class 5 model predicts a shorter 13C nuclear spacing for A8 CO labeling (0.56 nm) than for double CO labeling at A4 and A6 (0.61 nm). Correspondingly, simulated PITHIRDS-CT data (dashed curves, Figure 7) based on 8 13C atoms arranged in the Class 5 model (Figure S9) predict a faster decay for the A8 CO data than for double CO labeling at A4 and A6, contrary to experimental results. Indeed, a distance as short as 0.5 nm among the labeled A4 and A6 CO sites, as required by the PITHIRDS-CT data, is possible if the antiparallel β-sheets were to have a registry shift of at least 6 residues. Such a large registry shift would leave residues 12–16 of every strand without hydrogen bonding partners, resulting in a very unstable structure. Therefore, only the Class 3R2 model remains consistent with all the PITHIRDS-CT data for CO labeling.
Further evidence in favor of the Class 3R2 molecular model is obtained by comparing PITHIRDS-CT data for A4 Cβ (Sample C) to data for A8 Cβ (Sample D). Figure 5 shows that the observed decays did not differ for these two samples. This behavior is consistent with parallel β-sheets, which predict no change in relative positions of labeled sites for 13C labeling at different alanine Cβ sites (see Figure S9), as well as simulated PITHIRDS-CT curves in Figure 7 (solid curves). In contrast, the Class 5 model, with antiparallel β-sheets, predicts distinct 3-dimensional arrangements of 13C atoms for A4 Cβ labeling compared to A8 Cβ labeling (Figure S9). Since A8 is in the middle of the β-strand, the Class 5 model predicts spin interactions between an A8 Cβ site and equivalent sites on neighboring molecules within the same β-sheet and in the adjacent β-sheet. In contrast, A4 is close to the beginning of the peptide sequence, and an A4 Cβ site will not experience dipolar couplings with equivalent sites in neighboring molecules within an antiparallel β-sheet (distance > 1 nm). Distinct 3-dimensional configurations of 13C atoms spaced near the nuclear spacing are predicted to measurably affect shapes of PITHIRDS-CT decays (see dashed curves in Figure 7).35
We also probed the organization of RADA16-I β-strands within nanofiber β-sheets using Fourier transform infrared spectroscopy. It has been suggested that antiparallel β-sheets exhibit a prominent peak between at ~1630 cm−1 and a weaker resolved signal ~1695 cm−1, whereas a parallel β-sheet structure is suggested by the absence of the latter peak.42–44 The spectrum shown in Figure S10 (see also Supplementary Methods) is consistent with a parallel β-sheet structure for RADA16-I nanofibers. The absence of the feature at 1695 cm−1 is also seen clearly in the attenuated total reflectance Fourier transform infrared spectrum reported by Arosio et al.28
Figure 8 shows our structural model of the RADA16-I nanofiber, based on the solid-state NMR constraints. Table S5 summarizes our experimental constraints on RADA16-I nanofiber structure in comparison with different model predictions. Only the Class 3R2 model is consistent with the data presented here. Due to the registry shift, the parallel β-strands are predicted to be at an angle of 35° from the fiber axis. This model is harmonious with the solid-state NMR chemical shifts, which indicate that each RADA16-I molecule forms a linear β-strand, as well as the PITHIRDS-CT 13C-13C dipolar coupling data, which report on the 3-dimensional organization of selectively isotopically labeled sites near peptide backbones. Conformations of arginine and aspartate sidechains are derived purely from computer modeling and are not constrained by experimental data. The nanofiber model predicts a nanofiber height of 2.5 nm and a width of 3 nm as depicted in Figure 8c. We consider both values to be consistent with the smallest widths in TEM images (Figure 1). Note that an extended RADA16-I β-strand would have a length of 5 nm; this dimension is larger than the nanofiber width because of the 35° angle between the molecular axis and the fiber axis. Observed widths of greater than 3 nm for some nanofibers (Figure 1) would correspond to multiple layers of the fibril unit depicted in Figure 8, stabilized by interfaces between surfaces created by arginine and aspartate sidechains. RADA16-I nanofiber heights observed by AFM (1.5 nm) are less than the height to two β-sheets predicted by the model (2.5nm). However, this model does not account for possible sidechain rearrangements upon deposition on mica surfaces and drying. Step variations in nanofiber heights first reported by Yokoi et al. and confirmed in our AFM images (Figure S1) are consistent with the existence of stacked layers of β-sheets.9
Figure 8.
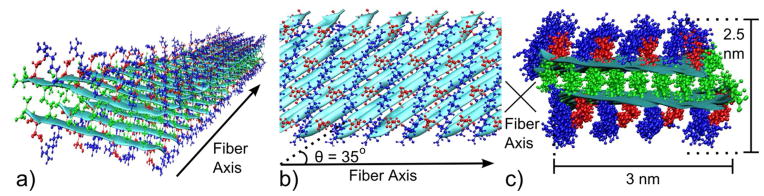
Molecular model for the RADA16-I nanofiber (Class 3R2), with peptide backbones rendered as ribbons, and atoms shown for alanine (green), arginine (blue), and aspartate (red) residues. a) 3-Dimensional representation of the RADA16-I nanofiber; b) Orthographic projection of the hydrophilic surface of a β-sheet, highlighting the predicted configuration of arginine and aspartate sidechains; c) Orthographic projection of the nanofiber cross section.
The structural model of RADA16-I nanofibers in Figure 8, based on solid-state NMR constraints, illustrates the complex influences of hydrophobic, Coulombic, and hydrogen-bonding interactions on secondary, tertiary, and quaternary levels of structure.45 The Class 5 model with antiparallel β-sheets was proposed previously because this arrangement avoids unfavorable close proximity of like-charged arginine and of like-charged aspartate sidechains.9 While previous assignment of β-strand secondary structure for RADA16-I nanofibers is based on experimental data (e.g., circular dichroism and Raman spectroscopy), there have been no direct measurements of inter-molecular organization.9, 24 Our PITHIRDS-CT NMR data indicate that nanofibers are uniquely consistent with the Class 3R2 model, which constitutes an alternative arrangement that also avoids close proximity between like-charged residues. The repetitive nature of the RADA16-I sequence allows the registry shift to occur without compromising hydrophobic interactions between alanine sidechains. It is likely that the observed registry shift was influenced by the size discrepancy and Coulombic interactions between arginine and aspartate sidechains. The importance of sidechain Coulombic interactions is supported by previous observations of pH-dependent β-sheet registry shifts within amyloid fibrils formed by other peptides.46, 47
In both designer peptide self-assembly and amyloid formation, a fundamental question relates to how the amino acid sequence influences the fibril structure. Amyloid fibrils with similar structures to RADA16-I nanofibers, are usually composed of parallel β-sheets and can exhibit structural features influenced by charged or polar sidechain interactions.37, 45 Hydrophobic interactions, often considered to drive amyloid formation, are usually maximized for in-register parallel arrangements through maximal overlap between hydrophobic sidechains. Recently, mutants of the Alzheimer’s β-amyloid peptide involving charged amino acids (D23N and E22) have been reported to significantly affect arrangement of β-strands within β-sheets.48, 49 It should be noted that stabilizing interactions between charged and polar sidechains cannot be fully understood without modeling the full 3-dimensional configurations of atoms. Structures such as glutamine and asparagine polar zippers influence amyloid formation for peptides that self-assemble primarily through polar sidechain interactions.50–53 Furthermore, combinatorial analysis of peptides with hydrophobic/hydrophilic patterning similar to RADA16-I yielded several alternative structures.15 The structural model for RADA16-I presented here may contribute to our understanding of design rules for self-assembled peptide structures.
The existence of 3 distinct NMR peaks corresponding to any alanine Cβ site indicates the co-existence of 3 distinct sub-states in the RADA16-I nanofiber samples. The complete and consistent decays of the PITHIRDS-CT signals (Figure 3b) further indicates that the 3 sub-states correspond to similar 3-dimensional configuration of 13C atoms. Thus, the sub-states are unlikely to correspond to differences at the secondary, tertiary, or quaternary structural level. As suggested in previous studies on polymorphic amyloid fibrils, heterogeneity in tertiary structure would lead to incomplete decay of PITHIRDS-CT signals.48 We suggest that the 3 Cβ sub-states could be explained by alternative configurations of arginine and aspartate sidechains which in turn affect the chemical shift of alanine Cβ within the hydrophobic core. Our molecular dynamics simulations starting from different rotameric states of arginine and aspartate all led to configurations in which an arginine at position i forms bifurcated hydrogen bonds with the aspartate at position i + 2 of the same β-strand. The two stacked β-sheets have registry shifts in opposite directions, resulting in the sidechain hydrogen bonds either nearly perpendicular or parallel to the fiber axis (Figure S11a, b). The sidechain hydrogen-bonding pattern is formed in two rotameric states of arginine (Figure S11c, d): I, accounting for ~2/3 of arginine-aspartate pairs, has the arginine sidechain torsion angles χ1, χ2, and χ3 all around 180°; II, accounting for the remaining ~1/3 of arginine-aspartate pairs, has the arginine χ2 torsion angle changed to around 60°. Variations in arginine sidechain conformation do not have any significant effects on Cβ-Cβ spacings of alanine sidechains packed within the inter-sheet interface (Figure 8c) and hence are not expected to affect Cβ PITHIRDS-CT decays, but could result in different environments for the alanine sidechains, leading to distinct Cβ chemical shifts. The combination of arginine rotameric states between the two β-sheets potentially gives rise to 4 types of environments for the alanine sidechains, with probabilities of 4/9, 2/9, 2/9, and 1/9, respectively. It is tempting to assign the first three types to the central Cβ peak and the two side peaks, respectively, although we have no experimental evidence for such an assignment. It is also possible that interactions between nanofibers along the hydrophilic surfaces affect arginine and aspartate sidechain configurations. This environment-based explanation, as opposed to one based on more localized structural variations, has some experimental support. Using 2D dipolar assisted rotational resonance (DARR) measurements (see Supplementary Methods and Figure S12), we did not observe inter-sidechain contacts between non-equivalent alanine Cβ sites, suggesting that the two contacting alanine Cβ methyls from the two opposite β-sheets should always adopt the same sub-state. This finding is consistent with the interpretation that the two contacting alanine Cβ methyls sense the same environment.
Structural knowledge of the RADA16-I nanofiber could provide a basis for modeling molecular phenomena underlying technologically important properties. These properties include environment-sensitive self-assembly and dynamic reassembly. Environment-sensitive self-assembly refers to the effects of parameters such as pH and ionic strength on nanofiber morphology and formation kinetics.28, 54 These effects can be harnessed to engineer peptides which self-assemble under specific desired conditions or design processes which avoid undesirable structures.55–57 One could predict how pH and ionic strength affect the stability of the assembly and whether alternative structures can be stabilized via changes in solvent conditions. Dynamic reassembly refers to the ability of RADA16-I nanofibers to spontaneously reassemble following mechanical damage, without the addition of new monomeric peptide.9, 29 Our structural model can be used to design specific labels or probes to test hypothesized dynamic reassembly processes such as the sliding diffusion model proposed by Yokoi et al.,9 ultimately leading to a better understanding of the self-healing property of RADA16-I.
CONCLUSION
Solid-state NMR peak positions, line widths, and 13C-13C dipolar couplings are consistent with an ordered RADA16-I nanofiber structure in which linear β-strands are organized into parallel β-sheets. A registry shift of two amino acids between neighboring β-strands avoids close proximity between like-charged sidechains. Specifically, analysis of peak positions, observed through CPMAS and fpRFDR NMR spectra (Figure 2), correlate with a β-strand secondary structure. The observed NMR line widths are consistent with those observed for amyloid fibrils, indicating a similar degree of structural order. Through use of selective 13C labels on alanine residues, PITHIRDS-CT decays were compared via nuclear spin simulations to candidate models. Each model consists of two stacked β-sheets with either Class 3, 3R2, or 5 nanofiber symmetry. The stacking of β-sheets is supported by PITHRIDS-CT decays for 13C-labeling at A4 and A8 Cβ sites, which cannot be explained by an isolated single β-sheet; these results provide direct evidence for a hydrophobic nanofiber core. Further analysis of 13C-13C nuclear spacing and relative PITHIRDS-CT decays for samples labeled at different sites indicated that data are inconsistent with in-register parallel (Class 3) or antiparallel (Class 5) β-sheets. The model in Figure 8, with Class 3R2 symmetry, is consistent with all of the experimental constraints.
METHODS
RADA16-I was obtained following standard FMOC synthesis and purification procedures; see Supporting Information (SI) for details. Isotopic labels (see Table 1) were incorporated using commercial 13C-labeled protected amino acids. RADA16-I was allowed to self-assemble into nanofibers at a concentration of 5 mg RADA16-I in 1 mL of 10 mM phosphate buffer (pH 4.85). For TEM imaging, a small aliquot (10 μL) of RADA16-I nanofiber solution was taken after 24 hours of self-assembly and diluted 100-fold with water. The details of TEM specimen preparation are described previously.29
For solid-state NMR measurements, nanofibers were recovered by centrifugation (245,000 × g for 25 min at 4 °C) after 48 hours of self-assembly. Solid-state NMR samples were prepared by freeze-drying centrifuge pellets, packing dry powders into NMR rotors, and then hydrating with 1 mg of water per mg of peptide. Measurements were performed on an 11.75 T (500 MHz 1H NMR frequency) Bruker Avance III system with a 2.5 mm Bruker MAS probe. Experiments included CPMAS,58 2D-fpRFDR,30 and PITHIRDS-CT,35 with specific parameters detailed in SI. Reported NMR chemical shifts are relative to tetramethyl silane, as calibrated before every experiment using a micro crystalline glycine system that was selectively labeled at the CO site.
For computer modeling of the RADA16-I nanofiber, a β-strand with standard torsion angles was built with Ambertools 1.5. The β-strand was replicated to make parallel or antiparallel β-sheets, and the β-sheets were paired according to the specified symmetry classes. The pairs of β-sheets were solvated with water (explicit solvent) and the whole systems were energy minimized and refined by molecular dynamics simulations. More details are found in SI.
Nuclear spin simulations of PITHIRDS-CT experiments were performed using SPINEVOLUTION. The simulations included either 8 or 9 13C atoms, arranged linearly for 9-atom simulations (Figure 3) or in positions predicted by the molecular models for the 8-atom simulations (see Figure S10). More details are found in SI.
Supplementary Material
Acknowledgments
This research was supported by funds from the National Science Foundation Grant DMR-105521 to A. Paravastu and the National Institute of Health Grant GM88187 to H. Zhou. A portion of this work was performed at the National High Magnetic Field Laboratory (NHMFL), which is supported by National Science Foundation Cooperative Agreement No. DMR-0654118, the State of Florida, and the U.S. Department of Energy. This work was also partially supported by an NHMFL User Collaboration Research Grant to A. Paravastu. The data on amyloid fibrils of the Alzheimer’s β-amyloid peptide (Figure 3a) were produced by D. Huang and W.M. Tay. We also gratefully acknowledge E.A. Bienkiewicz and L. Longo for assistance collecting the circular dichroism spectrum, R.G. Alamo for assistance collecting the Fourier transform infrared spectrum, D. Huang for assistance with AFM imaging, and P.C.A. Van der Wel for assistance configuring SPINEVOLUTION nuclear spin simulation scripts.
Footnotes
Supporting Information Available: Supplementary Methods, Tables S1–S5, and Figures S1–S12. Supplementary methods, additional references, AFM imaging of RADA16-I nanofibers, additional solid-state NMR analysis, additional modeling and NMR simulation data, summary of experimental and modeling constraints. This material is available free of charge via the Internet at http://pubs.acs.org.
References
- 1.Holmes TC. Novel Peptide-Based Biomaterial Scaffolds for Tissue Engineering. Trends Biotechnol. 2002;20:16–21. doi: 10.1016/s0167-7799(01)01840-6. [DOI] [PubMed] [Google Scholar]
- 2.Cigognini D, Satta A, Colleoni B, Silva D, Donega M, Antonini S, Gelain F. Evaluation of Early and Late Effects into the Acute Spinal Cord Injury of an Injectable Functionalized Self-Assembling Scaffold. PloS One. 2011;6:1–15. doi: 10.1371/journal.pone.0019782. [DOI] [PMC free article] [PubMed] [Google Scholar]
- 3.Gelain F, Horii A, Zhang SG. Designer Self-Assembling Peptide Scaffolds for 3-D Tissue Cell Cultures and Regenerative Medicine. Macromol Biosci. 2007;7:544–551. doi: 10.1002/mabi.200700033. [DOI] [PubMed] [Google Scholar]
- 4.Cunha C, Panseri S, Villa O, Silva D, Gelain F. 3D Culture of Adult Mouse Neural Stem Cells within Functionalized Self-Assembling Peptide Scaffolds. Int J Nanomedicine. 2011;6:943–955. doi: 10.2147/IJN.S17292. [DOI] [PMC free article] [PubMed] [Google Scholar]
- 5.Koutsopoulos S, Unswortha LD, Nagaia Y, Zhang SG. Controlled Release of Functional Proteins through Designer Self-Assembling Peptide Nanofiber Hydrogel Scaffold. P Natl Acad Sci USA. 2009;106:4623–4628. doi: 10.1073/pnas.0807506106. [DOI] [PMC free article] [PubMed] [Google Scholar]
- 6.Horii A, Wang XM, Gelain F, Zhang SG. Biological Designer Self-Assembling Peptide Nanofiber Scaffolds significantly Enhance Osteoblast Proliferation, Differentiation and 3-D Migration. Plos One. 2007;2:1–9. doi: 10.1371/journal.pone.0000190. [DOI] [PMC free article] [PubMed] [Google Scholar]
- 7.Kumada Y, Zhang SG. Significant Type I and Type III Collagen Production from Human Periodontal Ligament Fibroblasts in 3D Peptide Scaffolds without Extra Growth Factors. PloS One. 2010;5:1–7. doi: 10.1371/journal.pone.0010305. [DOI] [PMC free article] [PubMed] [Google Scholar]
- 8.Liu JP, Zhao XJ. Design of Self-Assembling Peptides and their Biomedical Applications. Nanomedicine. 2011;6:1621–1643. doi: 10.2217/nnm.11.142. [DOI] [PubMed] [Google Scholar]
- 9.Yokoi H, Kinoshita T, Zhang SG. Dynamic Reassembly of Peptide RADA16 Nanofiber Scaffold. P Natl Acad Sci USA. 2005;102:8414–8419. doi: 10.1073/pnas.0407843102. [DOI] [PMC free article] [PubMed] [Google Scholar]
- 10.Song H, Zhang LL, Zhao XJ. Hemostatic Efficacy of Biological Self-Assembling Peptide Nanofibers in a Rat Kidney Model. Macromol Biosci. 2010;10:33–39. doi: 10.1002/mabi.200900129. [DOI] [PubMed] [Google Scholar]
- 11.Ellis-Behnke RG, Liang YX, You SW, Tay DKC, Zhang SG, So KF, Schneider GE. Nano Neuro Knitting: Peptide Nanofiber Scaffold for Brain Repair and Axon Regeneration with Functional Return of Vision. P Natl Acad Sci U S A. 2006;103:5054–5059. doi: 10.1073/pnas.0600559103. [DOI] [PMC free article] [PubMed] [Google Scholar]
- 12.Silva GA, Parpura V. Nanotechnology for Biology and Medicine: At the Building Block Level. Springer; New York, NY: 2011. p. 242. [Google Scholar]
- 13.Shastri VP. In Vivo Engineering of Tissues: Biological Considerations, Challenges, Strategies, and Future Directions. Adv Mater. 2009;21:3246–3254. doi: 10.1002/adma.200900608. [DOI] [PubMed] [Google Scholar]
- 14.Tang CK, Shao XM, Sun BB, Huang WL, Zhao XJ. The Effect of Self-Assembling Peptide RADA16-I on the Growth of Human Leukemia Cells in Vitro and in Nude Mice. Int J Mol Sci. 2009;10:2136–2145. doi: 10.3390/ijms10052136. [DOI] [PMC free article] [PubMed] [Google Scholar]
- 15.Zhang SG. Emerging Biological Materials through Molecular Self-Assembly. Biotechnol Adv. 2002;20:321–339. doi: 10.1016/s0734-9750(02)00026-5. [DOI] [PubMed] [Google Scholar]
- 16.Zhang SG, Lockshin C, Herbert A, Winter E, Rich A. Zuotin, a Putative Z-DNA Binding-Protein in Saccharomyces-Cerevisiae. Embo J. 1992;11:3787–3796. doi: 10.1002/j.1460-2075.1992.tb05464.x. [DOI] [PMC free article] [PubMed] [Google Scholar]
- 17.Zhang SG, Holmes T, Lockshin C, Rich A. Spontaneous Assembly of a Self-Complementary Oligopeptide to Form a Stable Macroscopic Membrane. P Natl Acad Sci USA. 1993;90:3334–3338. doi: 10.1073/pnas.90.8.3334. [DOI] [PMC free article] [PubMed] [Google Scholar]
- 18.Holmes TC, de Lacalle S, Su X, Liu GS, Rich A, Zhang SG. Extensive Neurite Outgrowth and Active Synapse Formation on Self-Assembling Peptide Scaffolds. P Natl Acad Sci USA. 2000;97:6728–6733. doi: 10.1073/pnas.97.12.6728. [DOI] [PMC free article] [PubMed] [Google Scholar]
- 19.Zhang SG, Holmes TC, Dipersio CM, Hynes RO, Su X, Rich A. Self-Complementary Oligopeptide Matrices Support Mammalian-Cell Attachment. Biomaterials. 1995;16:1385–1393. doi: 10.1016/0142-9612(95)96874-y. [DOI] [PubMed] [Google Scholar]
- 20.Jonker AM, Loewik DWPM, van Hest JCM. Peptide- and Protein-Based Hydrogels. Chem Mat. 2012;24:759–773. [Google Scholar]
- 21.Altman M, Lee P, Rich A, Zhang SG. Conformational Behavior of Ionic Self-Complementary Peptides. Protein Sci. 2000;9:1095–1105. doi: 10.1110/ps.9.6.1095. [DOI] [PMC free article] [PubMed] [Google Scholar]
- 22.Marcotte EM, Pellegrini M, Yeates TO, Eisenberg D. A Census of Protein Repeats. J Mol Biol. 1999;293:151–160. doi: 10.1006/jmbi.1999.3136. [DOI] [PubMed] [Google Scholar]
- 23.Chen YW, Ding F, Nie HF, Serohijos AW, Sharma S, Wilcox KC, Yin SY, Dokholyan NV. Protein Folding: Then and Now. Arch Biochem Biophys. 2008;469:4–19. doi: 10.1016/j.abb.2007.05.014. [DOI] [PMC free article] [PubMed] [Google Scholar]
- 24.Taraballi F, Campione M, Sassella A, Vescovi A, Paleari A, Hwang W, Gelain F. Effect of Functionalization on the Self-Assembling Propensity of Beta-Sheet Forming Peptides. Soft Matter. 2009;5:660–668. [Google Scholar]
- 25.Hilborn J. In Vivo Injectable Gels for Tissue Repair. Wiley Interdiscip Rev Nanomed Nanobiotechnol. 2011;3:589–606. doi: 10.1002/wnan.91. [DOI] [PubMed] [Google Scholar]
- 26.Loo Y, Zhang S, Hauser CAE. From Short Peptides to Nanofibers to Macromolecular Assemblies in Biomedicine. Biotechnol Adv. 2012;30:593–603. doi: 10.1016/j.biotechadv.2011.10.004. [DOI] [PubMed] [Google Scholar]
- 27.Wu EC, Zhang SG, Hauser CAE. Self-Assembling Peptides as Cell-Interactive Scaffolds. Adv Funct Mater. 2012;22:456–468. [Google Scholar]
- 28.Arosio P, Owczarz M, Wu H, Butte A, Morbidelli M. End-to-End Self-Assembly of RADA 16-I Nanofibrils in Aqueous Solutions. Biophys J. 2012;102:1617–1626. doi: 10.1016/j.bpj.2012.03.012. [DOI] [PMC free article] [PubMed] [Google Scholar]
- 29.Cheng L, Englander O, Paravastu AK, Oates WS. An Effective Continuum Approach for Modeling Non-Equilibrium Structural Evolution of Protein Nanofiber Networks. J Chem Phys. 2011;135:055102-1, 055102-15. doi: 10.1063/1.3622489. [DOI] [PubMed] [Google Scholar]
- 30.Ishii Y. C-13-C-13 Dipolar Recoupling Under very Fast Magic Angle Spinning in Solid-State Nuclear Magnetic Resonance: Applications to Distance Measurements, Spectral Assignments, and High-Throughput Secondary-Structure Determination. J Chem Phys. 2001;114:8473–8483. [Google Scholar]
- 31.Wishart DS. Interpreting Protein Chemical Shift Data. Prog Nucl Mag Res Sp. 2011;58:62–87. doi: 10.1016/j.pnmrs.2010.07.004. [DOI] [PubMed] [Google Scholar]
- 32.Paravastu AK, Leapman RD, Yau WM, Tycko R. Molecular Structural Basis for Polymorphism in Alzheimer’s Beta-Amyloid Fibrils. P Natl Acad Sci USA. 2008;105:18349–18354. doi: 10.1073/pnas.0806270105. [DOI] [PMC free article] [PubMed] [Google Scholar]
- 33.Ulrich EL, Akutsu H, Doreleijers JF, Harano Y, Ioannidis YE, Lin J, Livny M, Mading S, Maziuk D, Miller Z, et al. BioMagResBank. Nucleic Acids Res. 2008;36:D402–D408. doi: 10.1093/nar/gkm957. [DOI] [PMC free article] [PubMed] [Google Scholar]
- 34.Cornilescu G, Delaglio F, Bax A. Protein Backbone Angle Restraints from Searching a Database for Chemical Shift and Sequence Homology. J Biomol NMR. 1999;13:289–302. doi: 10.1023/a:1008392405740. [DOI] [PubMed] [Google Scholar]
- 35.Tycko R. Symmetry-Based Constant-Time Homonuclear Dipolar Recoupling in Solid State NMR. J Chem Phys. 2007;126:064506–064506. doi: 10.1063/1.2437194. [DOI] [PubMed] [Google Scholar]
- 36.Sawaya MR, Sambashivan S, Nelson R, Ivanova MI, Sievers SA, Apostol MI, Thompson MJ, Balbirnie M, Wiltzius JJW, McFarlane HT, et al. Atomic Structures of Amyloid Cross-Beta Spines Reveal Varied Steric Zippers. Nature. 2007;447:453–457. doi: 10.1038/nature05695. [DOI] [PubMed] [Google Scholar]
- 37.Balbach JJ, Petkova AT, Oyler NA, Antzutkin ON, Gordon DJ, Meredith SC, Tycko R. Supramolecular Structure in Full-Length Alzheimer’s Beta-Amyloid Fibrils: Evidence for a Parallel Beta-Sheet Organization from Solid-State Nuclear Magnetic Resonance. Biophys J. 2002;83:1205–1216. doi: 10.1016/S0006-3495(02)75244-2. [DOI] [PMC free article] [PubMed] [Google Scholar]
- 38.Veshtort M, Griffin RG. SPINEVOLUTION: A Powerful Tool for the Simulation of Solid and Liquid State NMR Experiments. J Magn Reson. 2006;178:248–282. doi: 10.1016/j.jmr.2005.07.018. [DOI] [PubMed] [Google Scholar]
- 39.Nielsen JT, Bjerring M, Jeppesen MD, Pedersen RO, Pedersen JM, Hein KL, Vosegaard T, Skrydstrup T, Otzen DE, Nielsen NC. Unique Identification of Supramolecular Structures in Amyloid Fibrils by Solid-State NMR Spectroscopy. Angw Chem Int Edit. 2009;48:2118–2121. doi: 10.1002/anie.200804198. [DOI] [PubMed] [Google Scholar]
- 40.van der Wel PCA, Lewandowski JR, Griffin RG. Solid-State NMR Study of Amyloid Nanocrystals and Fibrils Formed by the Peptide GNNQQNY from Yeast Prion Protein Sup35p. J Am Chem Soc. 2007;129:5117–5130. doi: 10.1021/ja068633m. [DOI] [PubMed] [Google Scholar]
- 41.van der Wel PCA, Lewandowski JR, Griffin RG. Structural Characterization of GNNQQNY Amyloid Fibrils by Magic Angle Spinning NMR. Biochemistry. 2010;49:9457–9469. doi: 10.1021/bi100077x. [DOI] [PMC free article] [PubMed] [Google Scholar]
- 42.Bakota EL, Sensoy O, Ozgur B, Sayar M, Hartgerink JD. Self-Assembling Multidomain Peptide Fibers with Aromatic Cores. Biomacromolecules. 2013;14:1370, 1370–1378. doi: 10.1021/bm4000019. [DOI] [PMC free article] [PubMed] [Google Scholar]
- 43.Cerf E, Sarroukh R, Tamamizu-Kato S, Breydo L, Derclaye S, Dufrene YF, Narayanaswami V, Goormaghtigh E, Ruysschaert JM, Raussens V. Antiparallel Beta-Sheet: A Signature Structure of the Oligomeric Amyloid Beta-Peptide. Biochem J. 2009;421:415–423. doi: 10.1042/BJ20090379. [DOI] [PubMed] [Google Scholar]
- 44.Mukherjee S, Chowdhury P, Gai F. Effect of Dehydration on the Aggregation Kinetics of Two Amyloid Peptides. J Phys Chem B. 2009;113:531–535. doi: 10.1021/jp809817s. [DOI] [PMC free article] [PubMed] [Google Scholar]
- 45.Tycko R. Molecular Structure of Amyloid Fibrils: Insights from Solid-State NMR. Q Rev Biophys. 2006;39:1–55. doi: 10.1017/S0033583506004173. [DOI] [PubMed] [Google Scholar]
- 46.Verel R, Tomka IT, Bertozzi C, Cadalbert R, Kammerer RA, Steinmetz MO, Meier BH. Polymorphism in an Amyloid-Like Fibril-Forming Model Peptide. Angew Chem Int Edit. 2008;47:5842–5845. doi: 10.1002/anie.200800021. [DOI] [PubMed] [Google Scholar]
- 47.Petkova AT, Buntkowsky G, Dyda F, Leapman RD, Yau WM, Tycko R. Solid State NMR Reveals a pH-Dependent Antiparallel Beta-Sheet Registry in Fibrils Formed by a Beta-Amyloid Peptide. J Mol Biol. 2004;335:247–260. doi: 10.1016/j.jmb.2003.10.044. [DOI] [PubMed] [Google Scholar]
- 48.Qiang W, Yau W, Tycko R. Structural Evolution of Iowa Mutant Beta-Amyloid Fibrils from Polymorphic to Homogeneous States Under Repeated Seeded Growth. J Am Chem Soc. 2011;133:4018–4029. doi: 10.1021/ja109679q. [DOI] [PMC free article] [PubMed] [Google Scholar]
- 49.Cloe AL, Orgel J, Sachleben JR, Tycko R, Meredith SC. The Japanese Mutant A Beta (Delta E22-A Beta(1-39)) Forms Fibrils Instantaneously, with Low-Thioflavin T Fluorescence: Seeding of Wild-Type A Beta(1-40) into Atypical Fibrils by Delta E22-A Beta(1-39) Biochemistry. 2011;50:2026–2039. doi: 10.1021/bi1016217. [DOI] [PMC free article] [PubMed] [Google Scholar]
- 50.Goehler H, Droge A, Lurz R, Schnoegl S, Chernoff YO, Wanker EE. Pathogenic Polyglutamine Tracts are Potent Inducers of Spontaneous Sup35 and Rnq1 Amyloidogenesis. PloS One. 2010;5:1–13. doi: 10.1371/journal.pone.0009642. [DOI] [PMC free article] [PubMed] [Google Scholar]
- 51.Chan JCC, Oyler NA, Yau WM, Tycko R. Parallel Beta-Sheets and Polar Zippers in Amyloid Fibrils Formed by Residues 10–39 of the Yeast Prion Protein Ure2p. Biochemistry. 2005;44:10669–10680. doi: 10.1021/bi050724t. [DOI] [PMC free article] [PubMed] [Google Scholar]
- 52.Perutz MF, Johnson T, Suzuki M, Finch JT. Glutamine Repeats as Polar Zippers - their Possible Role in Inherited Neurodegenerative Diseases. P Natl Acad Sci USA. 1994;91:5355–5358. doi: 10.1073/pnas.91.12.5355. [DOI] [PMC free article] [PubMed] [Google Scholar]
- 53.Perutz MF, Staden R, Moens L, Debaere I. Polar Zippers. Curr Biol. 1993;3:249–253. doi: 10.1016/0960-9822(93)90174-m. [DOI] [PubMed] [Google Scholar]
- 54.Ye ZY, Zhang HY, Luo HL, Wang SK, Zhou QH, Du XP, Tang CK, Chen LY, Liu JP, Shi YK, et al. Temperature and pH Effects on Biophysical and Morphological Properties of Self-Assembling Peptide RADA16-1. J of Pept Sci. 2008;14:152–162. doi: 10.1002/psc.988. [DOI] [PubMed] [Google Scholar]
- 55.Cormier AR, Ruiz-Orta C, Alamo RG, Paravastu AK. Solid State Self-Assembly Mechanism of RADA16-I Designer Peptide. Biomacromolecules. 2012;13:1794–1804. doi: 10.1021/bm300313h. [DOI] [PubMed] [Google Scholar]
- 56.Haines-Butterick L, Rajagopal K, Branco M, Salick D, Rughani R, Pilarz M, Lamm MS, Pochan DJ, Schneider JP. Controlling Hydrogelation Kinetics by Peptide Design for Three-Dimensional Encapsulation and Injectable Delivery of Cells. P Natl Acad Sci USA. 2007;104:7791–7796. doi: 10.1073/pnas.0701980104. [DOI] [PMC free article] [PubMed] [Google Scholar]
- 57.Schneider JP, Pochan DJ, Ozbas B, Rajagopal K, Pakstis L, Kretsinger J. Responsive Hydrogels from the Intramolecular Folding and Self-Assembly of a Designed Peptide. J Am Chem Soc. 2002;124:15030–15037. doi: 10.1021/ja027993g. [DOI] [PubMed] [Google Scholar]
- 58.Schaefer J, Stejskal E. C-13 Nuclear Magnetic-Resonance of Polymers Spinning at Magic Angle. J Am Chem Soc. 1976;98:1031–1032. [Google Scholar]
Associated Data
This section collects any data citations, data availability statements, or supplementary materials included in this article.