Abstract
Epigenetic mechanisms such as chromatin histone H3 lysine methylation and acetylation have been implicated in diabetic vascular complications. However, histone modification profiles at pathologic genes associated with diabetic nephropathy in vivo and their regulation by the angiotensin II type 1 receptor (AT1R) are not clear. Here we tested whether treatment of type 2 diabetic db/db mice with the AT1R blocker Losartan not only ameliorates diabetic nephropathy, but also reverses epigenetic changes. As expected, the db/db mice had increased blood pressure, mesangial hypertrophy, proteinuria and glomerular expression of RAGE and PAI-1 versus control db/+ mice. This was associated with increased RNA Polymerase II recruitment and permissive histone marks as well as decreased repressive histone marks at these genes, and altered expression of relevant histone modification enzymes. Increased MCP-1 mRNA levels were not associated with such epigenetic changes, suggesting post-transcriptional regulation. Losartan attenuated key parameters of diabetic nephropathy and gene expression, and reversed some but not all the epigenetic changes in db/db mice. Losartan also attenuated increased H3K9/14Ac at RAGE, PAI-1 and MCP-1 promoters in mesangial cells cultured under diabetic conditions. Our results provide novel information about the chromatin state at key pathologic genes in vivo in diabetic nephropathy mediated in part by AT1R. Thus combination therapies targeting epigenetic regulators and AT1R could be evaluated for more effective treatment of diabetic nephropathy.
Keywords: Diabetic Nephropathy, Angiotensin II, Losartan, epigenetics, gene regulation
INTRODUCTION
Diabetic nephropathy (DN) is a major microvascular complication and the leading cause of end stage renal disease. DN is characterized by glomerular and tubular hypertrophy, basement membrane thickening, and progressive accumulation of extracellular matrix (ECM) in the glomerular mesangium and tubulointerstitium, accompanied by renal dysfunction. Activation of glomerular mesangial cells (MC) by high glucose (HG) and advanced glycation end products (AGEs) increases the levels and actions of pro-inflammatory and pro-fibrotic growth factors and cytokines such as transforming growth factor beta-1 (TGF-β1), angiotensin II (AngII) and monocyte chemoattractant protein-1 (MCP-1), all of which play major roles in DN progression1–4. These factors can activate key transcription factors (TFs), including NF-κB and Smads to regulate the expression of pro-inflammatory and pro-fibrotic genes associated with DN1, 5. However, the role of epigenetic mechanisms involved in the regulation of gene transcription in DN still remains unclear.
Regulation of chromatin structure and function by epigenetic mechanisms, including DNA methylation and post-translational modifications (PTMs) of nucleosomal histones, such as histone H3 lysine acetylation (H3KAc) and H3K methylation (H3Kme) plays a central role in gene transcription6, 7. Dysregulated epigenetic mechanisms have been implicated in various diseases including diabetes and its complications8–11. Histone PTMs associated with transcriptional activation (H3K4me1) and repression (H3K9me3 and H4K20me3) as well as expression and function of the relevant histone methyl transferases (HMTs) were altered in vascular cells under diabetic conditions and in experimental models of diabetes12–14. These changes persisted even after removal from the diabetic milieu12–14, implicating epigenetic mechanisms in the ‘metabolic memory’ phenomenon which refers to the sustained pro-inflammatory states and increased risk for vascular complications observed in some diabetes patients long after intensive glycemic control is instituted9, 10. Furthermore, recent studies showed changes in H3K9Ac at Type 1 diabetes (T1D) susceptible loci in blood monocytes from T1D patients15, while HG treated endothelial cells depicted changes in DNA methylation and H3K9Ac at genes associated with endothelial dysfunction16.
Emerging evidence has also implicated epigenetic mechanisms in acute renal failure (ARF), chronic kidney disease and DN10, 11. Studies in ARF models and MC demonstrated the role of histone PTMs in chromatin remodeling events at the promoters of inflammatory and fibrotic genes, and in the maintenance of a pro-inflammatory state in renal cells11, 17–19. TGF-β1, a key cytokine in DN pathogenesis, decreased repressive H3K9me and increased active H3K4me histone marks at fibrotic gene promoters, and induced the expression of a H3K4-methyl transferase SET7/9 in MC20. Furthermore, a TGF-β1 antibody blocked similar changes induced by HG in MC, suggesting that TGF-β1 is a major mediator of epigenetic mechanisms in DN20. However, very little is known about the in vivo changes in the profiles of histone PTMs at the chromatin surrounding key genes associated with DN pathogenesis. More importantly, it is not known whether drugs commonly used for DN2, 4, 21 can affect or reverse these changes.
AngII signaling through the AngII type 1 receptor (AT1R) plays a critical role in the pathogenesis of DN2. AT1R signaling can increase the production of TGF-β1 and AGEs, and cross-talk between these factors can further amplify inflammatory and fibrogenic factor expression4, 22, 23. Clinical studies show that AT1R blockers (ARBs) can slow down the progression of DN2, 24. However, whether AT1R signaling regulates chromatin histone PTM profiles around genes relevant to DN pathogenesis has not been determined. Here, we examined the profiles of key histone PTMs in vivo in the glomeruli of diabetic db/db mice, a widely used model of type 2 diabetes that develops nephropathy3. We also examined, for the first time, the effects of Losartan, an ARB commonly used for treating hypertension and renal complications2, 24, on the expression of pathologic genes relevant to DN, as well as epigenetic changes at these loci. Results showed increased glomerular expression of key inflammatory and fibrotic genes, changes in histone PTMs at these genes, and altered expression of histone modifying enzymes in glomeruli from db/db mice relative to control db/+. Losartan treatment reversed most of the physiological and histological parameters of DN, changes in gene expression, and some, but not all the epigenetic changes observed in db/db mice. Our results provide novel information about the epigenetic states of pathologic gene loci in vivo in mouse DN and their regulation, at least in part via AT1R.
RESULTS
Losartan treatment reduced blood pressure and reversed key parameters of renal dysfunction in db/db mice
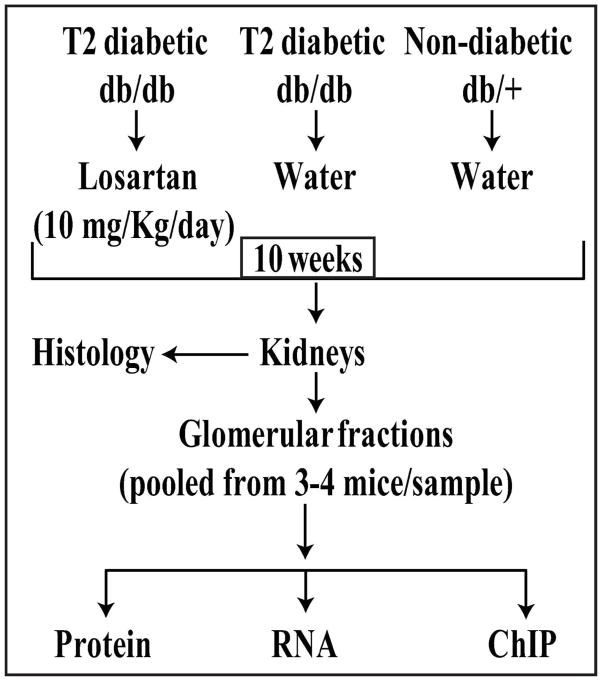
Type 2 diabetic db/db mice (10–12 weeks old) were treated with Losartan (10 mg/kg/day, added to the drinking water) or with water alone. Control non-diabetic db/+ mice received water alone without Losartan (Fig. 1). After 10 weeks, we examined standard parameters of DN, changes in the expression of key pathologic genes, alterations in histone PTMs at these genes, and the expression of enzymes regulating histone modifications, in the renal glomeruli of these mice.
Fig. 1.
Schematic diagram showing the study design.
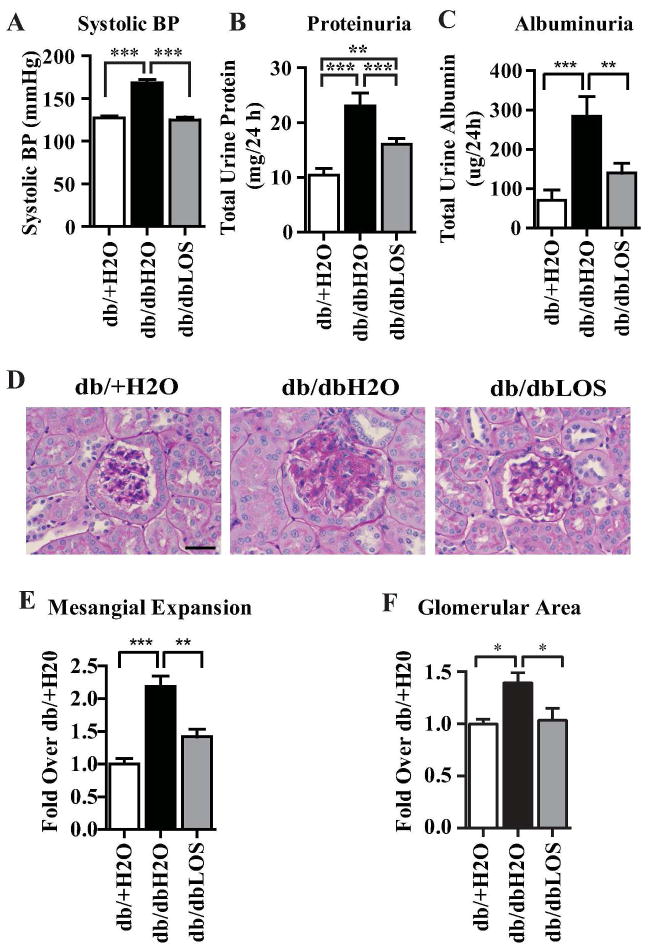
Systolic blood pressure was significantly increased in db/db mice treated with water (db/dbH2O) relative to db/+ mice treated with water (db/+H2O) at the end of 10 weeks (Table 1 and Fig. 2A). This increase was reversed by Losartan treatment of the db/db mice (db/dbLOS) (Table 1 and Fig. 2A), without any significant effect on increased body weight and blood glucose levels (Table 1). Diabetic db/dbH2O mice also exhibited proteinuria and albuminuria, which were significantly reversed by Losartan (Fig. 2B–C). Furthermore, Periodic Acid Schiff (PAS) staining of kidney sections showed significantly increased glomerular hypertrophy, mesangial matrix expansion and ECM deposition in db/dbH2O mice relative to db/+H2O, and these were significantly inhibited by Losartan in db/dbLOS mice (Fig. 2D–F). Thus, Losartan could ameliorate hypertension and key histological and physiological parameters of renal dysfunction in db/db mice without affecting blood glucose levels.
Table 1. Animal data collected from indicated mice 10 weeks after treatment with or without Losartan (10 mg/kg/day).
db/+H2O-db/+ mice treated without Losartan; db/dbH2O-db/db mice treated without Losartan; db/dbLOS-db/db mice treated with Losartan.
| db/+H2O | db/dbH2O | db/dbLOS | |
|---|---|---|---|
| Body weight (g) | 31 ± 0.33 | ***49±0.89 | ***48±0.94 |
| Blood glucose (mg/dL) | 144 ± 3 | ***485 ± 24 | ***523 ± 18 |
| Serum Creatinine | 0.203 ± 0.002 | 0.262 ± 0.018 | 0.317 ± .011 |
| Creatinine clearance | 0.106 ± 0.010 | 0.122 ± 0.03 | 0.093 ± .013 |
| *Systolic BP 10 weeks (mmHg) | 127 ± 2.1 | ***168.5 ± 3.7 | ###124.8 ± 3.5 |
| Kidney weight (mg) | 0.558±0.011 | 0.522±0.082 | 0.520±0.010 |
Data represents Mean ± SEM, ***, p<0.0001 vs db/+H2O (n=24–28). *Systolic BP data represents 14 mice per group (***, p<0.0001 vs db/+H2O and ###, p<0.0001 vs db/db H2O, n=14).
Fig. 2. Effect of Losartan treatment on blood pressure and parameters of diabetic nephropathy in DB/DB mice.
A. Systolic blood pressure (mmHg) was determined by tail cuff method in the three groups: db/+ mice treated with water (db/+H2O), db/db mice treated with water (db/dbH2O) and db/db mice treated with Losartan (db/dbLOS) for 10 weeks (n=14). B. Bar graph showing total urine protein levels in 24 h urine samples from the indicated mice (n=11 to 14). C. Bar graph showing albuminuria assayed using ELISA as described in the methods section. D. Images of PAS staining in kidney sections from indicated mice were collected using an Olympus BX51 microscope (40X lens). E–F. Mesangial expansion (E) and glomerular area (F) in PAS stained kidney sections determined using Image-Pro Plus software were expressed as “fold over db/+H2O” (n=8). A–C and E–F: Data represents Mean±SEM; ***, p<0.0001; **, p<0.001; *, p<0.05. Scale bar-50 μm.
Losartan inhibits glomerular expression of key inflammatory and ECM genes in db/db mice
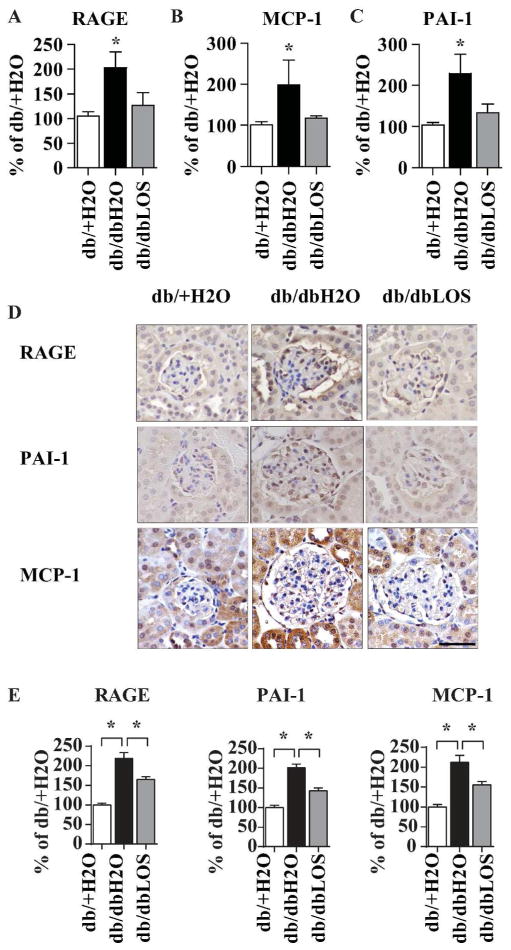
We next examined changes in glomerular expression of inflammatory and ECM-related profibrotic genes by RT-qPCR. Expression of the pro-inflammatory genes MCP-1 and receptor for AGEs (RAGE), and fibrogenic plasminogen activator inhibitor-1 (PAI-1) gene, were significantly increased in db/dbH2O mice relative to db/+H2O and inhibited by Losartan treatment (Fig, 3A–C). Expression of other pro-inflammatory genes (TNF-alpha) and pro-fibrotic genes (TGF-β Connective tissue growth factor, Collagen 1a1 (Col1a1), Col1a2, Col4a1 and Fibronectin) were also increased in db/db mice, but Losartan treatment inhibited the expression of only Col1a2 (data not shown). Furthermore, immunohistochemical staining with specific antibodies showed that glomerular RAGE, PAI-1 and MCP-1 protein levels were also significantly increased in db/dbH2O relative to db/+H2O and these increases were attenuated by Losartan in db/dbLOS mice (Fig. 3D–E). These results indicate that Losartan has some beneficial effects on glomerular gene expression in this model of DN, albeit relatively limited, in that only a subset of the tested inflammatory and profibrotic genes known to play important roles in the progression of DN were inhibited.
Fig. 3. Losartan treatment can inhibit the expression of key inflammatory and fibrotic genes in renal glomeruli isolated from db/db mice.
A–C. RT-qPCR results showing the expression of indicated genes in glomeruli from db/+H2O, db/dbH2O and db/dbLOS mice. Kidneys from three mice were pooled to prepare glomeruli from each group of mice and total RNA was extracted to analyze mRNA expression by RT-qPCR. Gene expression was normalized to the β-actin gene and expressed as % of db/+H2O. Data represents Mean±SEM; *, p<0.05 (n=9–17). D. IHC staining of kidney sections from indicated mice using RAGE, PAI-1 and MCP-1 antibodies. IHC was performed as described in the Methods section and images were collected using an Olympus DP-72 microscope (40X lens). E. Intensities of RAGE, PAI-1 and MCP-1staining were quantified using Smart segmentation method in Image-Pro-Premier software (Media Cybernetics, Rockville, MD). Results were expressed as “% of db/+H2O”. Data represents Mean±SEM; *, p<0.05 (n=10–13). Scale bar-50 μm.
Losartan effects on RNA Polymerase II recruitment and nucleosome occupancy
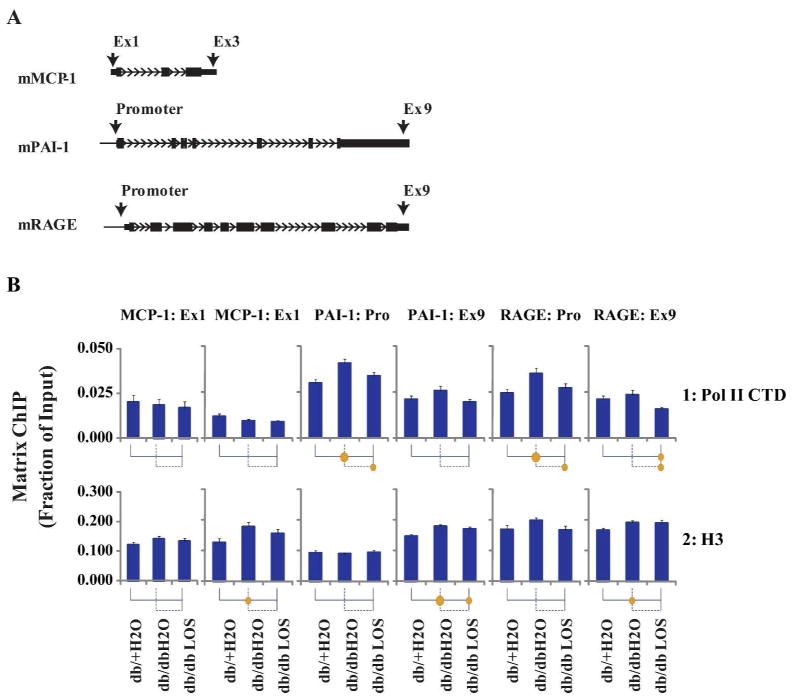
Next, we performed Matrix chromatin immunoprecipitation (ChIP) assays25 to measure changes in RNA Polymerase II (Pol II) recruitment at the start and the end of these loci (Fig. 4A) to assess their transcription rates. Pol II occupancies at the PAI-1 and RAGE gene promoters and exon 9 (Ex9) were higher in db/dbH2O compared to the control db/+H2O glomeruli (fraction of input), and Losartan treatment attenuated these differences in db/dbLOS glomeruli (Fig. 4B, row 1 and see Supplement Fig. S1 for GraphGrid tool explanation). In contrast, no differences were observed in Pol II occupancy at the MCP-1 gene between the three mouse groups (Fig. 4B, row 1). Furthermore, overall, Pol II levels were lower at the MCP-1 gene relative to PAI-1 and RAGE genes in all three mouse groups (Fig. 4B, row 1). These results suggest that increases in PAI-1 and RAGE gene expression are mediated by increased transcription, whereas, MCP-1 mRNA expression is most likely due to post-transcriptional processes (at least at this time period tested).
Fig. 4. Matrix ChIP analysis of RNA polymerase II and histone H3 levels at MCP-1, PAI-1 and RAGE genes in renal glomeruli from three groups of mice.
A. Schematic of the ChIP primer locations. Large black bold arrows indicate location of ChIP primers. Exons are shown as rectangles and the small arrows indicate the direction of transcription. B. Matrix ChIP assays with RNA polymerase II C-terminal domain (Pol II CTD) and histone H3 (H3) antibodies. Kidneys from 3 mice were pooled to prepare glomeruli for eight chromatin preparations from each group of mice. Cross-linked and sheared renal glomeruli chromatin was assayed using Pol II CTD (row1), and histone H3 (row2) antibodies. ChIP DNA was analyzed using primers at or near the promoters and the last exon using real-time PCR. Data were acquired, analyzed and graphed using in-house generated PCRCrunch and GraphGrid software. Statistical significance is indicated in the grid below the graphs (see Fig. S1). Each vertical line and its attached horizontal component is associated with the bar above it. The Bonferroni corrected p-value of the t-test between any two groups is indicated by the size of the solid circle at the intersection of their respective lines. Data represents Mean±SEM expressed as fraction of input (n=14 glomeruli preparations for each group). The circles below each bar indicate statistical significance (p<0.05 and p<0.01 are represented by small and larger circles, respectively).
Because nucleosome occupancy plays a role in transcription regulation and chromatin access to the transcription machinery, we performed ChIP assays with histone H3 a component of nucleosomes6 to assess average nucleosome/histone H3 occupancy along the PAI-1, RAGE and MCP-1 genes in mice glomeruli. Histone H3 occupancy was higher in db/db mice at the 3′ ends of all three genes and Losartan brought these levels closer to the levels in the db/+ mice. (Fig. 4B, rows 2). These results suggest that diabetes-related changes observed in Pol II levels at RAGE and PAI-1 genes are associated with differences in histone H3 occupancy. The results at the MCP-1 gene suggest that histone H3 occupancy changes can take place without effects on Pol II density.
Losartan effect on permissive histone PTMs
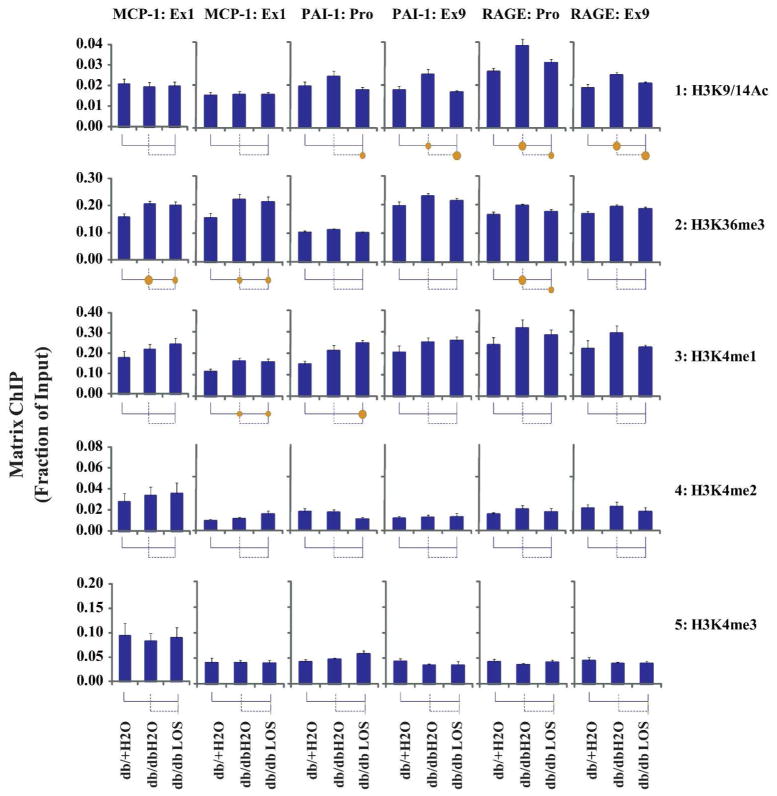
To evaluate chromatin marks that could account for the Pol II patterns observed at the above genes, we profiled several well studied transcription-permissive histone modifications namely H3K9/14Ac, H3K36me3 and H3K4me -1, -2, and -3. Matrix ChIP assays showed increased H3K9/14Ac levels at the PAI-1 and RAGE loci in db/dbH2O compared to db+H2O mice. These differences were reversed with Losartan treatment (Fig. 5. row 1). Similar to Pol II (Fig. 4), there were no H3K9/14Ac differences at the MCP-1 locus. Levels of H3K36me3, a chromatin mark associated with transcriptional elongation,26 were higher in db/dbH2O compared to db+H2O mice at the MCP-1 and RAGE loci, and although not statistically different, similar pattern was seen at the PAI-1 gene (Fig. 5, row 2). In Losartan-treated mice there was a trend towards lower H3K36me3 levels at the RAGE and PAI-1 loci but not at the MCP-1 gene. There was also a trend for another permissive mark H3K4me1 to be higher in db/dbH2O compared to db/+H2O group at the three genes (Fig. 5, row 3). At the sites where there was significant increase in H3K4me1, Losartan had no effect. No differences were noted for H3K4me2/3. These results indicate that DN altered some permissive histone marks at the RAGE and PAI-1 genes, and that Losartan reversed only some, but not all these epigenetic changes. These results also show that the DN-related changes in permissive marks at the MCP-1 gene were seen at a time where Pol II density was not different among the three groups of animals.
Fig. 5. Matrix ChIP analysis of transcription permissive histone covalent modifications at MCP-1, PAI-1 and RAGE genes in renal glomeruli from three groups of mice.
Cross-linked and sheared renal glomeruli chromatin was assayed using H3K9/14Ac (row1), H3K36me3 (row 2), H3K4me1 (row3), H3K4me2 (row4) and H3K4me3 (row5) antibodies. Matrix ChIP assays were performed as described in the legend of Fig. 4.
Losartan effect on repressive histone PTMs
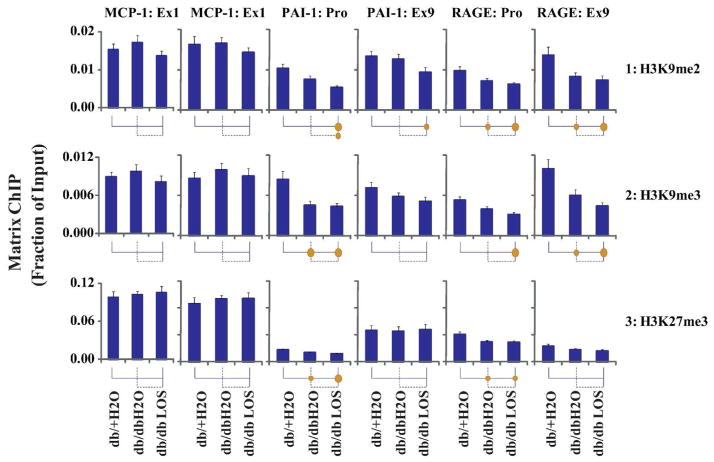
Next, we examined several chromatin marks that are thought to inhibit transcription or are associated with repressed genes. In agreement with their repressive functions6, the levels of H3K9me2, H3K9me3 and H3K27me3 were higher at the MCP-1 gene relative to the PAI-1 and RAGE genes (Fig. 6, rows 1–3; columns 1 vs 3 and 5). This result further explains the observed lower level of Pol II at the MCP-1 gene. Interestingly, comparison between three mouse groups revealed that the levels of these repressive marks were lower in the db/dbH2O mice at both the PAI-1 and RAGE genes (Fig. 6, rows 1–3; columns 3 and 5), which inversely correlated with their up-regulation. Rather than reverse these DN-related changes, there was a trend for Losartan to further lower of H3K9me2 and H3K9me3 levels at the the PAI-1 and RAGE genes. Losartan had little or no effect on DN-associated H3K27me3 changes at these two genes. Once again, the MCP-1 locus did not show any changes (Fig. 6, rows 2–3; column 1).
Fig. 6. Matrix ChIP analysis of repressive histone covalent modifications at MCP-1, PAI-1 and RAGE genes in renal glomeruli from three groups of mice.
Cross-linked and sheared renal glomeruli chromatin was assayed using, H3K9me2 (row1), H3K9me3 (row2) and H3K27me3 (row3), antibodies. ChIP assays were performed as described in the legend of Fig 4.
Overall, increased permissive and decreased repressive histone modifications could account for the higher levels of Pol II at the PAI-1 and RAGE genes and their increased expression in db/db mice. However, Losartan mediated the reversal of only permissive chromatin changes which correlated with its inhibitory effect on the expression of these two genes.
Effect of Losartan treatment on the in vivo glomerular levels of histone modification enzymes in db/db mice
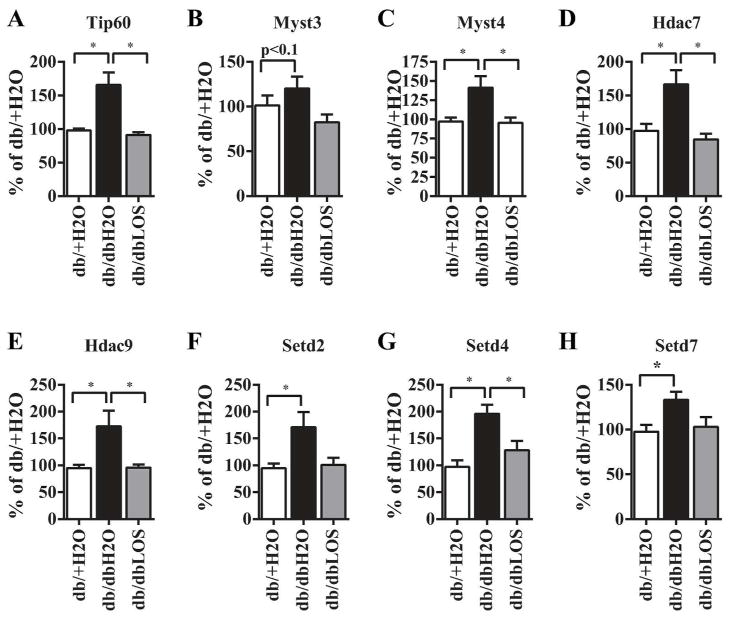
We next used commercially available QPCR arrays to screen for expression of 86 genes that encode epigenetic modifying enzymes including those that catalyze histone PTMs (Online Supplement Fig. S2, Table S1). Results showed that expression of several histone modification enzymes were upregulated in db/dbH2O mice including histone acetyl transferases (HATs), deacetylases (HDACs), methyl transferases (HMTs) that mediate permissive marks H3K4me3 and H3K36me3, and demethylases (HDMs) that remove methyl groups. Losartan inhibited most of these increases (Online Supplement, Fig. S2). We performed RT-qPCR to validate these changes and examine additional genes not represented in the PCR Arrays. Results showed significantly increased expression of HATs (Tip60, Myst3 and Myst4), H3K4-MTs (Setd4 and Setd7), a H3K36me3 MT (Setd2) and HDACs (Hdac7 and Hdac9) in db/dbH2O mice. Furthermore, these increases were abolished in db/dbLOS mice (Fig. 7A–H). These results validated many of the increases observed in QPCR Arrays (Fig. S2). In addition RT-qPCR also revealed trends towards increased expression of H3K9me3 demethylases (Jmjd2 family) and other epigenetic factors and Losartan treatment inhibited these changes (Online supplement, Fig. S3). Overall these results suggest that mRNA levels of a number of histone modification enzymes that mediate permissive histone PTM marks were increased in diabetic mice and these correlated in large part with the corresponding changes in histone PTMs. Losartan could reverse some of these gene expression changes which correlated with its inhibition of the relevant permissive histone PTMs.
Fig. 7. Reversal of glomerular Epigenetic factors expression by Losartan.
A–H. Total RNA from glomeruli was used to analyze expression of indicated genes by RT-qPCR as described in the Methods section. Results were expressed as % of db/+H2O (*, p<0.05, n=6–9).
Inhibition of H3K9/14Ac by Losartan in mesangial cells (MC) cultured in vitro under diabetic conditions
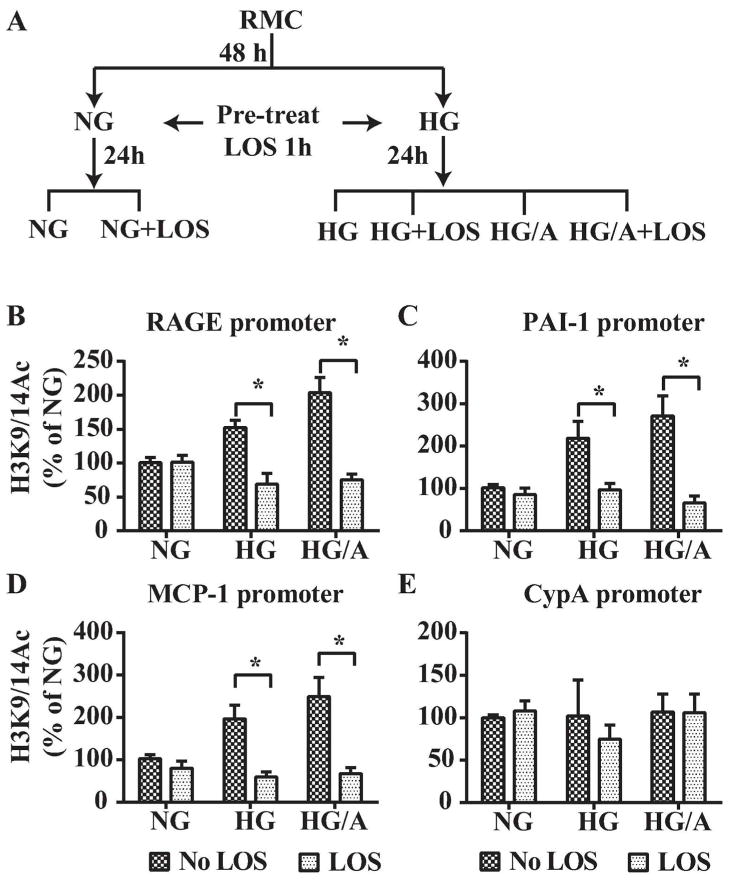
Mesangial cells maintained in high ambient glucose increase synthesis of AngII1. Given that Losartan reversed alterations in permissive epigenetic marks (Fig. 5) suggested that these histone changes reflect diabetes-induced AngII/AT1R signaling. To explore this issue we used cultured rat MC (RMC) maintained in normal (5.5 mM) glucose (NG) or high (25 mM) glucose (HG) for 2 days and then pre-treated without or with 1 μM Losartan (LOS) for one hour followed by incubation for an additional 24 h with NG, HG or HG + 0.1 μM AngII (HG/A) without or with LOS (Fig. 8A). Expression levels of RAGE, PAI-1 and MCP-1 mRNAs as well asH3K9/14Ac at their promoters were examined. HG induced the expression of all three genes and this was further augmented by HG/A in cultured RMC. These increases in gene expression were inhibited by Losartan (Table S2, Online Supplement). ChIP assays showed that HG increased H3K9/14Ac at the RAGE, PAI-1 and MCP-1 promoters and this was further augmented by HG/A (Fig. 8B–D). Moreover, these promoter acetylations were ameliorated by Losartan (Fig. 8B–D). On the other hand, H3K9/14Ac levels at the promoter of a control housekeeping gene cyclophilin A (CypA) were not altered (Fig. 8E). These results suggest that Losartan inhibition of permissive histone PTMs such as H3K9/14Ac at key DN-related genes is direct. Moreover, Losartan’s renoprotective effects could, in part, be mediated by reversing DN-induced permissive epigenetic changes at these DN-related genes.
Fig. 8. Effect of Losartan on promoter H3K9/14Ac in cultured mesangial cells.
A. Schematic of RMC treatment. RMC were cultured in normal (5.5 mM) glucose (NG), or high (25 mM) glucose (HG) for 48 h and then pre-treated for 1 h without (No LOS) or with 1 μM Losartan (LOS) followed by treatment with HG or HG + 0.1 μM Angiotensin II (HG/A) for an additional 24 h. B–E. ChIP-qPCR results showing H3K9/14Ac at the RAGE (B), PAI-1 (C), MCP-1 (D) and CypA (E) gene promoters in rat MC. Chromatin preparations from RMC treated as described in A were subjected to ChIP assays using H3K9/14Ac antibodies and ChIP-enriched DNA samples were analyzed by qPCR using primers for indicated gene promoters. Results were expressed as % of NG. Data represents Mean±SEM; *, p<0.05 (n=3–6).
DISCUSSION
In this study we demonstrated that increased expression of key inflammatory and profibrotic genes was associated with changes in several histone PTMs at these genes, as well as with altered expression of related histone modification enzymes in glomeruli from type 2 diabetic db/db mice relative to db/+. Losartan treatment of the db/db mice ameliorated hypertension and key parameters of DN as well as increases in pathologic gene expression, but its beneficial effects on the changes in epigenetic histone PTMs were only partial, suggesting that the DN-related chromatin changes are mediated by both AT1R dependent and independent mechanisms.
Evidence suggests epigenetic histone PTMs are involved in pathologic gene expression relevant to diabetic renal and vascular complications9–11, 20, 27. The repertoire of histone modifications is diverse, and PTM functions reflect their combinatorial effects6. Because histone PTMs act in concert with each other, profiling multiple histone PTMs is important for determining the chromatin status at promoters and bodies of genes involved in DN pathogenesis. To date, owing to technical difficulties in detecting small epigenetic changes, in vivo comparative profiling of histone PTMs in glomeruli from animal models of DN could not be readily done. In this study, we have taken advantage of the sensitive high throughput Matrix ChIP assay that permits the simultaneous profiling of multiple histone PTMs in 96 well plates25, 28. Our results showed DN-related increases in the occupancy of RNA Pol II at the PAI-1 and RAGE genes (Fig. 4), which correlated well with their increased expression, suggesting increased transcription at these loci in db/db mice. Increased rates of transcription are generally associated with reduced repressive and enriched permissive histone PTMs at the genes, leading to open chromatin formation and increased access of the promoter and transcribed regions to the transcription machinery6. While the activation mark H3K9/14Ac was increased (Fig. 5), the repressive modifications including H3K9me2, H3K9me3 and H3K27me3 were reduced (Fig. 6) at the PAI-1 and RAGE genes in db/db mice compared to db/+ mice. Another activation mark H3K36me3, associated with transcribed gene bodies and elongation, was also increased at both the PAI-1 and RAGE genes (Fig. 5) but the magnitude of the change was smaller compared to H3K9/14Ac. Levels of the activation mark H3K4me1 were slightly higher in the db/db mice compared to db/+ but did not reach statistical significance at the PAI-1 and RAGE sites examined. No differences were observed in other permissive marks H3K4me2 and H3K4me3 at these two genes. These results suggest that DN-induced epigenetic alterations, including increased H3K9/14Ac and lower H3K9me2, H3K9me3 and H3K27me3 marks, could contribute to chromatin relaxation leading to increased Pol II recruitment (Fig. 4), and transcription of PAI-1 and RAGE mRNAs (Fig. 3).
We also demonstrated changes in the expression of epigenetic enzymes that catalyze some of the DN-altered histone modifications in db/db mice vs db/+ mice. Notably expression of three Myst family HATs, Tip60, Myst3 and Myst4 (Fig. 7) was increased in db/db mice compared to db/+ mice corresponding to the higher H3K9/14Ac levels at the PAI-1 and RAGE genes (Fig. 6). Recent studies have shown that chromatin histone lysine acetylation mediated by HATs can enhance transcriptional activity of pro-fibrotic Smad and pro-inflammatory NF-κB TFs under diabetic conditions 27, 29, 30. Furthermore, increased expression of Setd2 correlated with the increased levels of the transcription elongation mark, H3K36me3, at all three genes examined. Diabetic mice also exhibited increased expression of several HMTs that mediate H3K4-methylation (Figs. 7 and S2). Increased expression of Setd7 is interesting, since it has been implicated in pro-inflammatory and pro-fibrotic gene expression in diabetes12, 20, 31. The DN-related decrease in the H3K9me2/3 and H3K27me3 was associated with increased expression of cognate demethylases Jmjd2 family members and Jmjd3, respectively (Supplement Figs. S2 and S3). Taken together, we have identified several candidate PTM enzymes that could explain histone changes associated with DN.
However, not all changes in histone modification enzymes correlated with relevant PTMs. Despite increases in several H3K4-MTs, no changes in H3K4me2/3 were observed. While H3K9/14Ac levels were increased, levels of several HDACs were also increased (Figs. 7 and S2). Similarly, H3K9me2/3 levels were reduced possibly due to increases in several Jmjd2 demethylases, but expression of corresponding HMT Suv39h1 was also increased (Fig. S2 and S3). These diabetes-related effects were similar to those we observed in a rat model of type 1 diabetes and DN, where decreased H3K27me3 was associated with increased expression of the cognate HMT Ezh232. These findings suggest that, in the course of kidney injury, epigenetic changes can evolve reflecting alterations in balance between PTM “writers” and “erasers”33. Some of the epigenetic enzymes could be primary drivers of PTMs changes while others may represent compensatory responses. Time course of broader range epigenetic observations will be needed to clarify these issues and better define hierarchy of these chromatin and transcriptional events.
Our observations also point to another DN-related tier of control illustrated by MCP-1 where its mRNA alterations did not match Pol II density at this gene (Fig. 4), suggesting that MCP-1 transcript alterations may occur at the level of mRNA stability. Similar MCP-1 observations were made in type 1 diabetic rat kidneys32. Altered post-transcriptional mechanisms affecting mRNA stability and activity of RNA binding proteins can mediate pathological gene expression under diabetic conditions34–36. Recently, we identified the role of Ybx1, an RNA binding protein and target of miR-216a, in the translation of Tsc-22, which regulates collagen expression in TGF-β1 induced MCs37. Ybx1 also regulates MCP-1 mRNA stability38. Further studies are needed to examine the role of these types of factors and microRNAs such as miR-200b which can increase MCP-1 in VSMC39 and are also upregulated in DN40, in the glomerular expression of MCP-1 in DN. On the contrary, our in vitro experiments in cultured RMC showed that both MCP-1 gene expression and its promoter histone acetylation were up-regulated by HG and HG/A, indicating subtle temporal differences in acute versus chronic conditions, and underscoring the importance of in vivo evaluations.
In contrast to the robust epigenetic changes seen with either HG or TGF-β1 in vitro in cultured MCs in previous 20, 27 and current studies, our results showed modest changes in vivo in histone PTMs at the RAGE and PAI-1 loci, and in the expression of chromatin modifying enzymes in the glomeruli of db/db mice. The magnitude of DN-related epigenetic and transcriptional changes observed in db/db mice and in type 1 diabetic rat kidneys32 were also smaller than those seen in models of acute kidney injury18, 19. These modest epigenetic changes observed are however not entirely unexpected in a model of chronic disease such as db/db mice where the DN lesion is also not severe. In addition, cell types other than MC present in the glomerular preparations could also influence the results, since epigenetic mechanisms are cell-specific in nature. Notwithstanding, our study has utilized novel approaches to attain the optimal in vivo profiles of glomerular histone PTMs and chromatin status of DN associated genes and determine how they respond to therapeutic intervention with Losartan.
AngII is a key player in the pathogenesis of proteinuria, a surrogate marker for renal function2. ARBs can improve renal function through amelioration of endothelial dysfunction, oxidative stress, AGE formation, inflammation and fibrosis2, 4, 23, 41. However, the effects of ARBs on the epigenetic mechanisms involved in DN were not known till now. Our results demonstrated that Losartan reversed key parameters of DN including expression of key inflammatory and ECM genes in db/db mice, further supporting a role for AT1R signaling in DN pathogenesis. Losartan also inhibited recruitment of Pol II at the PAI-1 and RAGE promoters, acting at the level of transcription at these loci. Furthermore, Losartan inhibited increased expression of HATs (Tip60, Myst3 and Myst4) and H3K36-MT Setd2. This correlated with its inhibition of H3K9/14Ac and H3K36me3 respectively at RAGE and PAI-1 genesThus, reversal of DN-related PTM alterations by Losartan could account for changes in Pol II-mediated transcription and mRNA levels.
Because AngII/AT1R signaling is augmented in diabetes1, 42, it can up-regulate DN-related genes via aberrant changes in histone PTMs at their promoters. Losartan may exert renoprotective effects, at least in part, by blocking AngII/AT1R-mediated chromatin events at DN-related genes. In order to further test the mechanistic basis of Losartan’s epigenetic effects, we employed a dynamic cell culture system in which previous reports showed that LOS blocked HG mediated effects42. Results from experiments with cultured RMC treated with HG and HG/AngII along with Losartan further support the notion that inhibition of permissive epigenetic histone modifications such as H3K9/14Ac at DN-related genes might be one of the mechanisms involved in the renoprotective effects of Losartan.
However, Losartan did not reverse all the DN-related epigenetic changes in vivo. Notably, Losartan did not correct the DN-mediated fall in H3K9me2, H3K9me3 and H3K27me3 marks at RAGE and PAI-1 genes. This discordance between the effects of Losartan on gene expression and histone PTMs in vivo further suggests that time course experiments are required to clarify the role of epigenetic mechanisms and their regulation by AT1R signaling in DN. They also suggest that, while H3K9/K14Ac may be regulated at least in part by AT1R signaling, other modifications may be mediated by AT1R independent mechanisms or those acting in parallel, such as TGF-β1 signaling. Overall, our results suggest that Losartan could reverse key permissive histone marks in DN, possibly via down-regulation of cognate epigenetic enzymes, but had no effect on repressive marks.
In summary, for the first time, we were able to profile changes in several histone PTMs at key inflammatory and fibrotic genes, and examine expression of histone modifying enzymes in vivo in renal glomeruli from db/db mice, and showed that the reno-protective effect of Losartan in db/db mice could be partly attributed to the reversal of Pol II and permissive histone PTMs. Furthermore, this study demonstrated epigenetic alterations relevant to pathologic gene expression in progressive diseases such as DN where there appears to be an interplay of primary and compensatory chromatin changes. Importantly, the approaches developed in this study could provide a platform to rapidly survey several histone PTMs at pathologic gene loci at different time intervals and correlate them with the progression of DN in animal models. The translational implications of chromatin studies of this type is that knowledge of relevant epigenetic enzymes can potentially identify new drug targets for DN treatment. Current therapeutic regimens using ARBs and ACE inhibitors do not fully prevent progression to end stage renal disease.2, 43 Our observations that Losartan does not fully reverse DN-related epigenetic changes may, at least in part, account for the shortcomings of ARBs treatment. Thus, identifying epigenetic mechanisms and lessons learnt from this study may form the basis for potential future therapies combining renin-angiotensin blockers with epigenetic drugs for more effective treatment of DN.
METHODS
Detailed Methods are available in the Online Supplement.
Treatment of db/db mice with Losartan
10–12 week old male diabetic db/db mice (BKS.Cg-m+/+leprdb/J) were randomly assigned to two groups (28/group): mice treated without Losartan in drinking water (db/dbH2O) and with Losartan (10 mg/kg/day) in drinking water (db/dbLOS). As non-diabetic controls, 28 db/+ mice were treated with water without Losartan (db/+H2O). After 10 weeks of treatment, kidneys from 3–4 mice were pooled, glomeruli were prepared by sieving44 and processed for RNA extraction and ChIP assays (Fig. 1). Blood pressure measurements and serum and urine analysis were performed as described earlier44. Glomerular hypertrophy and ECM deposition in paraffin embedded kidney sections were evaluated using PAS staining45.
RNA extraction and Gene expression analysis
Total RNA was prepared from glomeruli using miRNA easy columns. Gene expression in cDNAs was analyzed by Quantitative Reverse Transcriptase-Polymerase Chain Reaction (RT-qPCR) with SYBR Green PCR Kits using gene-specific primers (Table 2). Glomerular expression of histone modification enzymes was analyzed (2 samples/group) using Mouse Epigenetic Chromatin Modification Enzymes PCR Arrays (PAMM-085a, Qiagen) by RT-qPCR. Data was analyzed by 2−ΔΔCt method and results expressed as fold over db/+H2O.
Table 2.
QPCR primers used for mouse (m) and rat (r) samples in this study.
| Gene | Forward | Reverse |
|---|---|---|
| cDNA Primers | ||
| mMCP-1 | TTAAAAACCTGGATCGGAACC | GCATTAGCTTCAGATTTACGG |
| mRAGE | CAAGTCCAACTACCGAGTCC | GCAGTGTAAAGAGTCCCGTC |
| mPAI-1 | GACGCCTTCATTTGGACGAA | CGGACCTTTTCCCTTCAAGAGTCCG |
| mSetd2 | TGCAGCCGTGACTTCAATAG | CAGTTGGGAGGTAAAACAATCG |
| mSetd4 | GGCCCTACATTAAGAAGTGGAA | CTTGGGTAAGATGTCCAGGTAAG |
| mHdac7 | GGCCACCCATAACCACTATT | GAGGAAACAGGAGAGAGGAAAC |
| mHdac9 | CCCTGCCCAATATCACTCTG | CTCGCACTTCTGTTTGTCTTTG |
| mTip60 | CAGGACAGCTCAGATGGAATAC | GGCCAAGCTCAATACACTCA |
| mMyst3 | CAATCCCCATCTGTAGCTTCTG | GGCCTTCACTCTCACTGTTAG |
| mMyst4 | TGCCGATCCCATTCCAATATG | TCAGGACAAAACTTCAGACAGG |
| ChIP Primers | ||
| mMCP-1 Ex1 | AGCCAACTCTCACTGAAGCC | GCCAACACGTGGATGCTC |
| mMCP-1 Ex3 | TTGAATGTGAAGTTGACCCG | TTAAGGCATCACAGTCCGAG |
| mPAI-1 Pro | AAGAGCAGGTGGCAGAACTC | GCCTGTAGGCCACAACTGAT |
| mPAI-1 Ex9 | TGAGAGAGGGCAAAGTGGTT | ATACAGCAGCCGGAAATGAC |
| mRAGE Pro | GAATGCCAGGAATCTGTGCTTCT | CAGCCGAGGTAGTGCCCAGAGGCTG |
| mRAGE Ex9 | GATGCAAAGGCAATCTCACTCCTGCATC | CCTGGTATGGTGGGAGGCATAG |
| rRAGEpro-P1 | CTGGACCATGCTGCCTAATAA | GGGTAGGGTTCTACACCAATAAA |
| rPAI-1 pro-P2 | GACAATATGTGCCCTGTGATTGTC | AGGCTGCTCTACTGGTCCTTGC |
| rMCP-1 pro | AATTCCAATCCGCGGTTTC | TGCCAAGGAGCAGCATCAT |
| rCypA pro-P1 | CCCGGATGCGTACCTAAGGA | CGGACGTTGCTTCGCTGTCCG |
Chromatin preparation and multiplex Matrix ChIPs
Glomerular preparations (10–20 mg) were cross-linked with formaldehyde, chromatin was sheared and ChIP assays were performed using the multiplex Matrix ChIP platform in protein A-coated 96-well polypropylene microplates as described earlier25, 46. ChIP-enriched DNA was analyzed by QPCR with indicated primers (Fig. 4A and Table 2). ChIP assays with RMC were performed as described earlier20.
Statistical Analysis
Statistical analysis was performed as described in the Online Supplement. Data represents Mean±SEM and p<0.05 was considered statistically significant.
Supplementary Material
Acknowledgments
These studies were supported by grants from the NIH (R01 DK058191, R01 DK081705 and R01 HL106089 to RN); JDRF 17-2008-900 (to RN); the American Diabetes Association (to MAR); NIH (R37 DK45978, R01 DK083310), JDRF (42-2009-779), NIDDK Diabetic Complications Consortium Pilot and Feasibility Program (www.diacomp.org) DK076169 and an anonymous private donation to UW Medicine Research (to KB); and NIH (RO1 DK 83391 to CA). The authors are grateful to Merck & Co., Inc (Whitehouse Station, NJ, USA) for the generous gift of Losartan, to Margaret Morgan for assistance with the manuscript. The authors also thank Steve Flanagin (University of Washington, Seattle) for developing the GraphGrid PCRCrunch software tools.
Footnotes
DISCLOSURE STATEMENTS
None declared
REFERNCES
- 1.Kanwar YS, Sun L, Xie P, et al. A glimpse of various pathogenetic mechanisms of diabetic nephropathy. Annu Rev Pathol. 2011;6:395–423. doi: 10.1146/annurev.pathol.4.110807.092150. [DOI] [PMC free article] [PubMed] [Google Scholar]
- 2.Ruggenenti P, Cravedi P, Remuzzi G. The RAAS in the pathogenesis and treatment of diabetic nephropathy. Nat Rev Nephrol. 2010;6:319–330. doi: 10.1038/nrneph.2010.58. [DOI] [PubMed] [Google Scholar]
- 3.Tesch GH, Lim AK. Recent insights into diabetic renal injury from the db/db mouse model of type 2 diabetic nephropathy. Am J Physiol Renal Physiol. 2011;300:F301–310. doi: 10.1152/ajprenal.00607.2010. [DOI] [PubMed] [Google Scholar]
- 4.Calcutt NA, Cooper ME, Kern TS, et al. Therapies for hyperglycaemia-induced diabetic complications: from animal models to clinical trials. Nat Rev Drug Discov. 2009;8:417–429. doi: 10.1038/nrd2476. [DOI] [PMC free article] [PubMed] [Google Scholar]
- 5.Sanchez AP, Sharma K. Transcription factors in the pathogenesis of diabetic nephropathy. Expert Rev Mol Med. 2009;11:e13. doi: 10.1017/S1462399409001057. [DOI] [PubMed] [Google Scholar]
- 6.Kouzarides T. Chromatin modifications and their function. Cell. 2007;128:693–705. doi: 10.1016/j.cell.2007.02.005. [DOI] [PubMed] [Google Scholar]
- 7.Portela A, Esteller M. Epigenetic modifications and human disease. Nat Biotechnol. 2010;28:1057–1068. doi: 10.1038/nbt.1685. [DOI] [PubMed] [Google Scholar]
- 8.Ling C, Groop L. Epigenetics: a molecular link between environmental factors and type 2 diabetes. Diabetes. 2009;58:2718–2725. doi: 10.2337/db09-1003. [DOI] [PMC free article] [PubMed] [Google Scholar]
- 9.Villeneuve LM, Natarajan R. The role of epigenetics in the pathology of diabetic complications. Am J Physiol Renal Physiol. 2010;299:F14–25. doi: 10.1152/ajprenal.00200.2010. [DOI] [PMC free article] [PubMed] [Google Scholar]
- 10.Pirola L, Balcerczyk A, Okabe J, et al. Epigenetic phenomena linked to diabetic complications. Nat Rev Endocrinol. 2010;6:665–675. doi: 10.1038/nrendo.2010.188. [DOI] [PubMed] [Google Scholar]
- 11.Reddy MA, Natarajan R. Epigenetics in diabetic kidney disease. J Am Soc Nephrol. 2011;22:2182–2185. doi: 10.1681/ASN.2011060629. [DOI] [PMC free article] [PubMed] [Google Scholar]
- 12.El-Osta A, Brasacchio D, Yao D, et al. Transient high glucose causes persistent epigenetic changes and altered gene expression during subsequent normoglycemia. J Exp Med. 2008;205:2409–2417. doi: 10.1084/jem.20081188. [DOI] [PMC free article] [PubMed] [Google Scholar]
- 13.Villeneuve LM, Reddy MA, Lanting LL, et al. Epigenetic histone H3 lysine 9 methylation in metabolic memory and inflammatory phenotype of vascular smooth muscle cells in diabetes. Proc Natl Acad Sci U S A. 2008;105:9047–9052. doi: 10.1073/pnas.0803623105. [DOI] [PMC free article] [PubMed] [Google Scholar]
- 14.Zhong Q, Kowluru RA. Epigenetic changes in mitochondrial superoxide dismutase in the retina and the development of diabetic retinopathy. Diabetes. 2011;60:1304–1313. doi: 10.2337/db10-0133. [DOI] [PMC free article] [PubMed] [Google Scholar]
- 15.Miao F, Chen Z, Zhang L, et al. Profiles of epigenetic histone post-translational modifications at type 1 diabetes susceptible genes. J Biol Chem. 2012;287:16335–16345. doi: 10.1074/jbc.M111.330373. [DOI] [PMC free article] [PubMed] [Google Scholar]
- 16.Pirola L, Balcerczyk A, Tothill RW, et al. Genome-wide analysis distinguishes hyperglycemia regulated epigenetic signatures of primary vascular cells. Genome Res. 2011;21:1601–1615. doi: 10.1101/gr.116095.110. [DOI] [PMC free article] [PubMed] [Google Scholar]
- 17.Nelson JD, Flanagin S, Kawata Y, et al. Transcription of laminin gamma1 chain gene in rat mesangial cells: constitutive and inducible RNA polymerase II recruitment and chromatin states. Am J Physiol Renal Physiol. 2008;294:F525–533. doi: 10.1152/ajprenal.00299.2007. [DOI] [PubMed] [Google Scholar]
- 18.Naito M, Bomsztyk K, Zager RA. Renal ischemia-induced cholesterol loading: transcription factor recruitment and chromatin remodeling along the HMG CoA reductase gene. Am J Pathol. 2009;174:54–62. doi: 10.2353/ajpath.2009.080602. [DOI] [PMC free article] [PubMed] [Google Scholar]
- 19.Naito M, Zager RA, Bomsztyk K. BRG1 increases transcription of proinflammatory genes in renal ischemia. J Am Soc Nephrol. 2009;20:1787–1796. doi: 10.1681/ASN.2009010118. [DOI] [PMC free article] [PubMed] [Google Scholar]
- 20.Sun G, Reddy MA, Yuan H, et al. Epigenetic histone methylation modulates fibrotic gene expression. J Am Soc Nephrol. 2010;21:2069–2080. doi: 10.1681/ASN.2010060633. [DOI] [PMC free article] [PubMed] [Google Scholar]
- 21.Decleves AE, Sharma K. New pharmacological treatments for improving renal outcomes in diabetes. Nat Rev Nephrol. 2010;6:371–380. doi: 10.1038/nrneph.2010.57. [DOI] [PubMed] [Google Scholar]
- 22.Kagami S, Border WA, Miller DE, et al. Angiotensin II stimulates extracellular matrix protein synthesis through induction of transforming growth factor-beta expression in rat glomerular mesangial cells. J Clin Invest. 1994;93:2431–2437. doi: 10.1172/JCI117251. [DOI] [PMC free article] [PubMed] [Google Scholar]
- 23.Thomas MC, Tikellis C, Burns WM, et al. Interactions between renin angiotensin system and advanced glycation in the kidney. J Am Soc Nephrol. 2005;16:2976–2984. doi: 10.1681/ASN.2005010013. [DOI] [PubMed] [Google Scholar]
- 24.Brenner BM, Cooper ME, de Zeeuw D, et al. Effects of losartan on renal and cardiovascular outcomes in patients with type 2 diabetes and nephropathy. N Engl J Med. 2001;345:861–869. doi: 10.1056/NEJMoa011161. [DOI] [PubMed] [Google Scholar]
- 25.Flanagin S, Nelson JD, Castner DG, et al. Microplate-based chromatin immunoprecipitation method, Matrix ChIP: a platform to study signaling of complex genomic events. Nucleic Acids Res. 2008;36:e17. doi: 10.1093/nar/gkn001. [DOI] [PMC free article] [PubMed] [Google Scholar]
- 26.Barski A, Cuddapah S, Cui K, et al. High-resolution profiling of histone methylations in the human genome. Cell. 2007;129:823–837. doi: 10.1016/j.cell.2007.05.009. [DOI] [PubMed] [Google Scholar]
- 27.Yuan H, Reddy MA, Sun G, et al. Involvement of p300/CBP and epigenetic histone acetylation in TGF-beta1-mediated gene transcription in mesangial cells. Am J Physiol Renal Physiol. 2013;304:F601–613. doi: 10.1152/ajprenal.00523.2012. [DOI] [PMC free article] [PubMed] [Google Scholar]
- 28.Nelson JD, LeBoeuf RC, Bomsztyk K. Direct recruitment of insulin receptor and ERK signaling cascade to insulin-inducible gene loci. Diabetes. 2011;60:127–137. doi: 10.2337/db09-1806. [DOI] [PMC free article] [PubMed] [Google Scholar]
- 29.Miao F, Gonzalo IG, Lanting L, et al. In vivo chromatin remodeling events leading to inflammatory gene transcription under diabetic conditions. J Biol Chem. 2004;279:18091–18097. doi: 10.1074/jbc.M311786200. [DOI] [PubMed] [Google Scholar]
- 30.Das F, Ghosh-Choudhury N, Venkatesan B, et al. Akt kinase targets association of CBP with SMAD 3 to regulate TGFbeta-induced expression of plasminogen activator inhibitor-1. J Cell Physiol. 2008;214:513–527. doi: 10.1002/jcp.21236. [DOI] [PubMed] [Google Scholar]
- 31.Li Y, Reddy MA, Miao F, et al. Role of the histone H3 lysine 4 methyltransferase, SET7/9, in the regulation of NF-kappaB-dependent inflammatory genes. Relevance to diabetes and inflammation. J Biol Chem. 2008;283:26771–26781. doi: 10.1074/jbc.M802800200. [DOI] [PMC free article] [PubMed] [Google Scholar]
- 32.Komers R, Mar D, Denisenko O, et al. Epigenetic changes in renal genes dysregulated in mouse and rat models of type 1 diabetes. Lab Invest. 2013 doi: 10.1038/labinvest.2013.47. [DOI] [PubMed] [Google Scholar]
- 33.Allis CD, Berger SL, Cote J, et al. New nomenclature for chromatin-modifying enzymes. Cell. 2007;131:633–636. doi: 10.1016/j.cell.2007.10.039. [DOI] [PubMed] [Google Scholar]
- 34.Moore MJ. From birth to death: the complex lives of eukaryotic mRNAs. Science. 2005;309:1514–1518. doi: 10.1126/science.1111443. [DOI] [PubMed] [Google Scholar]
- 35.Shanmugam N, Ransohoff RM, Natarajan R. Interferon-gamma-inducible protein (IP)-10 mRNA stabilized by RNA-binding proteins in monocytes treated with S100b. J Biol Chem. 2006;281:31212–31221. doi: 10.1074/jbc.M602445200. [DOI] [PubMed] [Google Scholar]
- 36.Shanmugam N, Reddy MA, Natarajan R. Distinct roles of heterogeneous nuclear ribonuclear protein K and microRNA-16 in cyclooxygenase-2 RNA stability induced by S100b, a ligand of the receptor for advanced glycation end products. J Biol Chem. 2008;283:36221–36233. doi: 10.1074/jbc.M806322200. [DOI] [PMC free article] [PubMed] [Google Scholar]
- 37.Kato M, Wang L, Putta S, et al. Posttranscriptional upregulation of Tsc-22 by Ybx1, a target of miR-216a, mediates TGF-{beta}-induced collagen expression in kidney cells. J Biol Chem. 2010 doi: 10.1074/jbc.M110.165027. [DOI] [PMC free article] [PubMed] [Google Scholar]
- 38.Dhawan L, Liu B, Pytlak A, et al. Y-Box Binding Protein 1 and RNase UK114 Mediate Monocyte Chemoattractant Protein 1 mRNA Stability in Vascular Smooth Muscle Cells. Mol Cell Biol. 2012;32:3768–3775. doi: 10.1128/MCB.00846-12. [DOI] [PMC free article] [PubMed] [Google Scholar]
- 39.Reddy MA, Jin W, Villeneuve L, et al. Pro-inflammatory role of microrna-200 in vascular smooth muscle cells from diabetic mice. Arterioscler Thromb Vasc Biol. 2012;32:721–729. doi: 10.1161/ATVBAHA.111.241109. [DOI] [PMC free article] [PubMed] [Google Scholar]
- 40.Kato M, Arce L, Wang M, et al. A microRNA circuit mediates transforming growth factor-beta1 autoregulation in renal glomerular mesangial cells. Kidney Int. 2011;80:358–368. doi: 10.1038/ki.2011.43. [DOI] [PMC free article] [PubMed] [Google Scholar]
- 41.Wong WT, Tian XY, Xu A, et al. Angiotensin II type 1 receptor-dependent oxidative stress mediates endothelial dysfunction in type 2 diabetic mice. Antioxid Redox Signal. 2010;13:757–768. doi: 10.1089/ars.2009.2831. [DOI] [PubMed] [Google Scholar]
- 42.Singh R, Alavi N, Singh AK, et al. Role of angiotensin II in glucose-induced inhibition of mesangial matrix degradation. Diabetes. 1999;48:2066–2073. doi: 10.2337/diabetes.48.10.2066. [DOI] [PubMed] [Google Scholar]
- 43.Mauer M, Zinman B, Gardiner R, et al. Renal and retinal effects of enalapril and losartan in type 1 diabetes. N Engl J Med. 2009;361:40–51. doi: 10.1056/NEJMoa0808400. [DOI] [PMC free article] [PubMed] [Google Scholar]
- 44.Yuan H, Lanting L, Xu ZG, et al. Effects of cholesterol-tagged small interfering RNAs targeting 12/15-lipoxygenase on parameters of diabetic nephropathy in a mouse model of type 1 diabetes. Am J Physiol Renal Physiol. 2008;295:F605–617. doi: 10.1152/ajprenal.90268.2008. [DOI] [PMC free article] [PubMed] [Google Scholar]
- 45.Putta S, Lanting L, Sun G, et al. Inhibiting microRNA-192 ameliorates renal fibrosis in diabetic nephropathy. J Am Soc Nephrol. 2012;23:458–469. doi: 10.1681/ASN.2011050485. [DOI] [PMC free article] [PubMed] [Google Scholar]
- 46.Yu J, Feng Q, Ruan Y, et al. Microplate-based platform for combined chromatin and DNA methylation immunoprecipitation assays. BMC Mol Biol. 2011;12:49. doi: 10.1186/1471-2199-12-49. [DOI] [PMC free article] [PubMed] [Google Scholar]
Associated Data
This section collects any data citations, data availability statements, or supplementary materials included in this article.


