

Abstract
Non-invasive, cost-effective biomarkers that allow accurate monitoring of graft function are needed in kidney transplantation. Since microRNAs (miRNAs) have emerged as promising disease biomarkers we sought to establish an miRNA signature in urinary cell pellets comparing kidney transplant patients diagnosed with chronic allograft dysfunction (CAD) with interstitial fibrosis and tubular atrophy and those recipients with normal graft function. Overall, we evaluated 191 samples from 125 deceased donor primary kidney transplant recipients in the discovery, initial validation and the longitudinal validation studies for non-invasive monitoring of graft function. Of 1,733 mature miRNAs studied using microarrays, 22 were found to be differentially expressed between groups. Ontology and pathway analyses showed inflammation as the principal biological function associated with these miRNAs. Twelve selected miRNAs were longitudinally evaluated in urine samples of an independent set of 66 patients, at two time-points post-kidney transplant. A subset of these miRNAs was found to be differentially expressed between groups early post-kidney transplant before histological allograft injury was evident. Thus, a panel of urine miRNAs was identified as potential biomarkers for monitoring graft function and anticipating progression to CAD in kidney transplant patients.
Keywords: urinary cell pellets, microRNA, chronic allograft dysfunction, biomarkers
INTRODUCTION
A major obstacle in the management of kidney transplant recipients is the lack of specific biomarkers for continuous monitoring of graft function post-kidney transplantation (KT). The current gold standard is the histological evaluation of biopsies. Additional markers such as serum creatinine (Cr), estimated glomerular filtration rate (eGFR) and/or proteinuria (1-9) are routinely used to monitor graft function. Unfortunately, these currently available methods are either ineffective, inaccurate or invasive (5-9) and suffer from limitations in predicting outcomes (10-16).
Non-invasive, cost-effective biomarkers that allow frequent and accurate monitoring of graft function are needed in KT (14-16). Recently, microRNAs (miRNAs) have emerged as promising biomarkers for a variety of different pathologies (17, 18). Often found in association with exosomes, miRNAs are now shown to be stably expressed in serum, plasma, urine, saliva, and other body fluids. Lower complexity than mRNAs, no post processing modification, tissue specific expression, and amplifiable signals make miRNAs in the urine ideal candidates as non-invasive biomarkers of kidney disease. As a biofluid, the urine allows repeated and non-invasive collection, and its molecular composition highly reflects intra-renal events (19-21). We and others have published the utility of assessing mRNAs levels in urinary pellet for the evaluation of acute cellular rejection (ACR) (22, 23), BK virus nephropathy (24) and chronic allograft dysfunction (CAD) with interstitial fibrosis and tubular atrophy (IF/TA) (25, 26). However, so far, there have been only been few studies reported evaluating global miRNA expression changes associated with ACR or CAD with IF/TA in kidney allografts (27-30). Thus, the use of miRNA profiles as non-invasive biomarkers for monitoring graft function might have potential for non-invasively monitoring graft function and deserves further exploration.
We recently reported a miRNA profile of allograft tissue using microarrays, where miR-142-3p, miR-204, and miR-211 were differentially expressed between patients with histological diagnosis CAD with IF/TA when compared to patients with normal histology and functioning allografts (normal allograft function: NAF), in both allograft tissue biopsies and paired urinary cell pellet samples (30). Similar IF/TA-like expression changes were also detected in urinary cell pellets of patients with stable graft function, but that later developed CAD. This preliminary report suggested that miRNAs could be used to non-invasively monitor graft function. Detection of individual miRNAs (first identified in tissue samples) in urinary cell pellets using reverse transcriptase-quantitative PCR (RT-QPCR), also suggested the feasibility of generating a miRNA signatures from urinary cell pellet samples.
Based on our initial encouraging results, we now expand our CAD with IF/TA tissue miRNA signature by establishing a miRNA signature in urinary cell pellets using microarrays, and prospectively evaluating a combined panel of tissue/urine differentially expressed miRNAs. In order to validate the initially identified biomarkers and to establish a global miRNA signature in urine samples, we employed a well-designed methodological approach to integrate the transcriptional profiles of tissue biopsies and urinary cell pellet samples from patients with and without biopsy-proven CAD with IF/TA. A selected panel of 12 combined (tissue and urinary cell pellet) differentially expressed miRNA markers were tested in an independent cohort of kidney transplant recipients at two time points post-KT to assess their utility for the monitoring of graft function.
RESULTS
Use of Urinary Cell Pellets to Monitor Graft Function
As first step in our study, we aimed to evaluate the utility of urinary cells pellets versus urinary exosomes as targets for evaluating kidney allograft using mRNA/miRNA measurements. After evaluating the expression of mRNAs representing specific regions of the kidney, such as the nephron and the collecting duct in both urinary cell pellets and urinary exosomes, we observed expression of all the evaluated mRNA in both sample types. Even when the level of expression of the studied genes was lower in urinary exosomes, they were comparable between sample types (Supplemental information. mRNA/miRNA detection in urine samples: exosomes versus sediments). Similar findings were observed for the tested miRNAs. Thus, this preliminary data was used as a proof of principle to support our hypothesis that urinary cell pellets represent an appropriate source of mRNAs/miRNAs for evaluating kidney function, warranting cross-sectional and prospective miRNA studies in our patient cohorts. Moreover, technical issues associated with isolation of urinary exosomes (e.g., ultracentrifugation, RNA concentration) limit the utility of potential new biomarkers to be readily adaptable in the clinical setting.
Identification of MiRNA Signatures in Urinary Cell Pellet
The overall study design is shown in the Figure 1. Demographic and clinical patient data can be found in Table 1. Urinary cell pellets from patients with histological diagnosed CAD with IF/TA and patients with NAF were selected for the initial discovery phase. These patients included the same cohort of enrolled cases for the evaluation and establishment of the global miRNA signature in allograft tissue recently reported (30) and an additional set to increase the sample size. From this analysis, 22 miRNAs were identified as significantly differentially expressed (FDR = 15%, and ≥ 2-fold change) between CAD with IF/TA and NAF samples (Figure 2, and Table 2). Core analysis was performed to interpret the data set in the context of biological processes, pathways and molecular networks. The top scored network (score = 33) showed connective tissue disorders, inflammatory disease, and inflammatory response as the associated network functions. Moreover, inflammatory response was identified as one of the top functions associated with these differentially expressed miRNAs (p=7.03E-18-1.59E-11).
Figure 1. Flow-chart showing the study design.
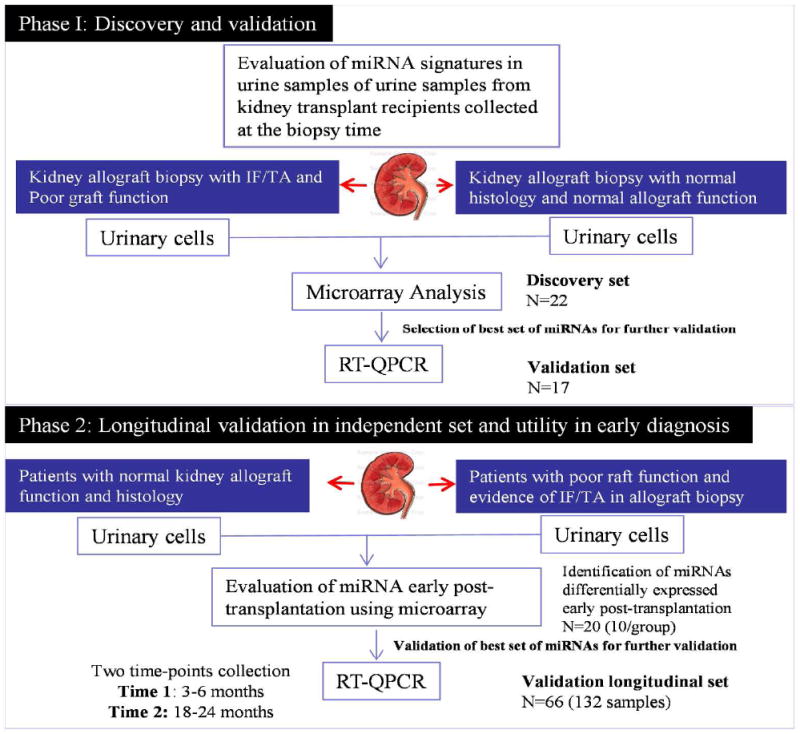
A design using training, validation and longitudinally analyses was used for discovery and validation of miRNAs with potential to detect early allograft injury post KT.
Table 1.
Patient demographics and clinical characteristics by study group
| Training set* | Validation set* | Testing Group** | |||
|---|---|---|---|---|---|
| IF/TA | NFA | IF/TA | NFA | ||
| Recipient Demographics | avg ± std | avg ± std | avg ± std | avg ± std | avg ± std |
| Age | 42.3 ± 17.6 | 43.4 ± 14.1 | 46.1 ± 16.3 | 41.0 ± 11.2 | 52.6 ± 12.6 |
| Race (AA/Ca/O) | 7/2/1 | 10/1/1 | 5/1/1 | 8/0/2 | 59/6/1 |
| Gender (M/F) | 5/5 | 6/6 | 4/3 | 6/4 | 34/32 |
| Donor Demographics | |||||
| Age | 44.0 ± 21.7 | 41.2 ± 17.2 | 54.0 ± 12.0 | 48.7 ± 17.5 | 40.1 ± 16.8 |
| Race (AA/Ca/O) | 5/5/0 | 5/7/0 | 4/3/0 | 2/7/1 | 21/44/1 |
| Gender (M/F) | 5/5 | 5/7 | 2/5 | 3/7 | 41/25 |
| Transplant | |||||
| Donor type (SCD/ECD/DCD) | 5/4/1 | 10/2/0 | 3/3/1 | 9/0/1 | 38/10/18 |
| CIT (min) | 875 ± 375 | 1047 ± 348 | 884 ± 377 | 1045 ± 420 | 1205 ± 387 |
| WIT (min) | 29.8 ± 6.6 | 32.8 ± 10.0 | 29.7 ± 5.9 | 33.6 ± 9.8 | 30.0 ± 6.5 |
| PPP time (min) | 640 ± 556 | 715 ± 402 | 845 ± 279 | 900 ± 356 | 828 ± 359 |
| Last Donor Cr. (mg/dL) | 1.09 ± 0.7 | 0.96 ± 0.4 | 1.12 ± 0.5 | 0.97 ± .5 | 1.1 ± 0.8 |
| DGF | 1 | 0 | 1 | 0 | 23 |
| Acute Rejection | 2 | 0 | 1 | 0 | 5 |
| HLA-A mismatch | 0.8 ± 0.9 | 1.4 ± 0.8 | 1.1 ± 0.9 | 1.2 ± 0.9 | 1.4 ± 0.7 |
| HLA-B mismatch | 1.3 ± 1.0 | 1.8 ± 0.4 | 1.7 ± 0.8 | 1.7 ± 0.5 | 1.7 ± 0.5 |
| HLA-DR mismatch | 1.1 ± 0.9 | 1.3 ± 0.7 | 1.3 ± 1.0 | 0.9 ± 0.7 | 1.2 ± 0.7 |
| HLA Total mismatch | 3.3 ± 2.6 | 4.5 ± 1.1 | 4.1 ± 2.0 | 3.8 ± 1.0 | 4.4 ± 1.2 |
| PRA at Tx (T-cell) | 35.0 ± 37.9 | 64.8 ± 38.3 | 31.5 ± 35.8 | 62.1 ± 35.4 | 45.6 ± 38.3 |
| PRA at Tx (B-cell) | 4.7 ± 10.9 | 23.2 ± 29.2 | 4.28 ± 10.0 | 10.4 ± 12.5 | 17.5 ± 27.8 |
| eGFR at 1mo | 57.1 ± 39.1 | 68.8 ± 20.9 | 53.4 ± 31.8 | 59.8 ± 25.6 | 52.9 ± 22.3 |
| eGFR at 3mo | 53.5 ± 37.8 | 73.7 ± 13.4 | 43.6 ± 25.1 | 59.4 ± 27.4 | 56.7 ± 19.2 |
| eGFR at 6mo | 55.4 ± 50.1 | 75.5 ± 10.19 | 54.1 ± 44.7 | 60.8 ± 28.6 | 57.3 ± 20.9 |
| eGFR at 9mo | 45.4 ± 34.9 | 76.9 ± 15.7 | 37.3 ± 16.0 | 63.3 ± 29.0 | 57.6 ± 21.4 |
| eGFR at 12mo | 41.2 ± 21.7 | 75.6 ± 12.8 | 28.5 ± 12.7 | 69.3 ± 16.6 | 56.6 ± 20.8 |
| eGFR at 18 mo | 55.2 ± 47.7 | 77.9 ± 13.3 | 18.5 ± 16.2 | 71.0 ± 21.7 | 56.4 ± 22.7 |
| eGFR at 24 mo (or last known) | 17.0 ± 13.8 | 79.5 ± 31.1 | 17.9 ± 14.4 | 71.6 ± 25.0 | 55.1 ± 25.9 |
Cross-sectional evaluation,
Prospective evaluation (longitudinal study).
CMV: cytomegalovirus; SCD/ECD/DCD: standard criteria donor/extended criteria donor/donation after cardiac death; CIT: cold ischemia time; WIT: warm ischemia time; PPP: pump perfusion preservation; Cr: creatinine; DGF: delayed graft function; PRA: panel reactive antibody; Tx: transplant; eGFR: estimated glomerular filtration rate.
Figure 2.

(A) Volcano plot of miRNA microarray data for NAF and IF/TA samples. The y-axis values show the negative logarithm base 10 of the p-value. The dotted horizontal line on the plot represents the α-level used for this analysis (0.005). The x-axis is shown as the log2-difference in estimated relative expression values. Vertical dotted lines represent the threshold for the log2-fold change (equivalent to a 2 fold change). Thus, the red dots correspond to miRNAs that show a significant (p≤0.005) 2-fold or greater change in expression between NAF and IF/TA samples. B) Principal component analysis of the miRNA results using microarrays showing separation of CAD with IF/TA samples from NAF samples using the expression values of the differentially expressed miRNAs.
Table 2.
List of significantly altered (p<0.01, FDR<15%) miRNAs identified as differentially expressed in urinary cell pellets between subjects with diagnosed CAD with IF/TA and NAF.
| microRNA | IFTA Mean (log2) | NAF Mean (log2) | Fold Change | p-value | q-value |
|---|---|---|---|---|---|
| hsa-miR-140-3p | 9.08 | 5.62 | 11.0 | 4.63E-05 | 1.83E-02 |
| hsa-miR-106b* | 6.48 | 2.85 | 12.4 | 7.13E-05 | 1.83E-02 |
| hsa-miR-125b | 2.86 | 6.86 | -15.9 | 7.97E-05 | 1.83E-02 |
| hsa-miR-200b | 1.94 | 5.03 | -8.5 | 1.24E-04 | 2.14E-02 |
| hsa-miR-200b* | 1.77 | 4.41 | -6.3 | 2.52E-04 | 2.93E-02 |
| hsa-miR-486-5p | 11.59 | 4.72 | 116.9 | 2.56E-04 | 2.93E-02 |
| hsa-miR-99a | 3.03 | 6.34 | -9.9 | 4.31E-04 | 4.23E-02 |
| hsa-miR-185 | 10.13 | 6.68 | 10.9 | 5.05E-04 | 4.33E-02 |
| hsa-miR-425 | 8.52 | 6.48 | 4.1 | 1.04E-03 | 7.51E-02 |
| hsa-miR-92a | 10.65 | 8.68 | 3.9 | 1.09E-03 | 7.51E-02 |
| hsa-miR-513a-5p | 0.76 | 1.12 | -1.3 | 1.61E-03 | 9.27E-02 |
| hsa-miR-423-5p | 6.59 | 4.28 | 4.9 | 1.62E-03 | 9.27E-02 |
| hsa-miR-23b | 7.22 | 9.17 | -3.9 | 1.75E-03 | 9.27E-02 |
| hsa-miR-30a* | 1.03 | 3.23 | -4.6 | 2.56E-03 | 1.11E-01 |
| hsa-miR-193b | 3.21 | 5.89 | -6.4 | 2.66E-03 | 1.11E-01 |
| hsa-miR-184 | 1.12 | 3.28 | -4.5 | 2.84E-03 | 1.11E-01 |
| hsa-miR-575 | 1.29 | 3.09 | -3.5 | 2.93E-03 | 1.11E-01 |
| hsa-miR-375 | 1.58 | 4.51 | -7.6 | 3.11E-03 | 1.11E-01 |
| hsa-miR-451 | 8.38 | 3.54 | 28.7 | 3.20E-03 | 1.11E-01 |
| hsa-miR-203 | 4.25 | 9.49 | -37.7 | 3.22E-03 | 1.11E-01 |
| hsa-let-7f-2* | 1.07 | 0.80 | 1.2 | 4.12E-03 | 1.35E-01 |
| hsa-miR-345 | 4.60 | 2.50 | 4.3 | 4.64E-03 | 1.45E-01 |
miRNAs in bold were further validated in the longitudinal study.
Validation of MiRNA Array Results Using an Independent Case-Control Group
An set of 5 miRNAs were initially selected for independent validation using RT-QPCR, including two miRNAs differentially expressed in urinary cell pellets (miR-125b, miR-203) and 3 miRNAs that were previously identified in tissue samples and correlated with paired urine samples (miR-142-3p, miR-204, miR-211) (30). Additional criteria for selection of the panel included: array fold change, statistical significance and in silico mRNA target prediction. The initial validation was performed using an independent set of urinary cell pellets (IF/TA= 7 and NAF=10). Differential expression of all 5 miRNAs was confirmed between NAF and CAD with IF/TA patients (Figure 3). The ΔΔCt method was used to calculate the relative expression (fold change) between sample groups. This signature was then expanded (based on criteria described in Methods) and further validated in a larger (N=66), longitudinal independent study, to evaluate utility of the markers for monitoring graft function and progression to CAD.
Figure 3.

(A) RT-QPCR validation of the selected miRNAs. Calculated fold changes (CAD with IF/TA vs. NAF) and p-values are indicated next to each bar. (B) Hierarchical clustering using Ward’s method of the RT-QPCR data obtained during validation of the array results showing separation of CAD with IF/TA and NAF samples. Higher ΔCt values are colored red; lower values are green. (C) Principal component analysis of the RT-QPCR data showing separation of CAD with IF/TA samples from NAF samples using the expression values of the selected miRNAs.
MicroRNA-mRNAs Interaction Network
We performed an integrative analysis of mRNA and miRNA expression profiles and miRNA target predictions from three different algorithms (PITA, TargetScan, and miRanda) through MAGIA (31, 32). The evaluation of mRNA in urinary cells has been a common approach during the last years for evaluating native and allograft kidneys (22-26, 33-35). However, most of the urine samples have total RNA without the required concentration, and/or quality and integrity for microarray analysis. Since our previously published data showed that miRNAs identified in tissues could also be detected in urinary cell pellets (30), these finding supported an integrative analysis using the new miRNA expression data together with our previously published data (25, 36).
Using MAGIA (miRNA and genes integrated analysis) we identified a large network of correlated mRNA-miRNA pairs. Results were mapped using Cytoscape (37). A filtered network corresponding to the 5 miRNA selected for initial independent validation was extracted from the results (Figure 4A). To identify annotated protein interactions, genes identified within this network were queried using STRING (http://string-db.org/) and mapped using Cytoscape (Figure 4B). Eighty-three genes identified in the mRNA-miRNA network were found to have documented protein-protein interactions with at least one other gene from the network. A merging of the two networks can be found in Supplemental Figure 1.
Figure 4.
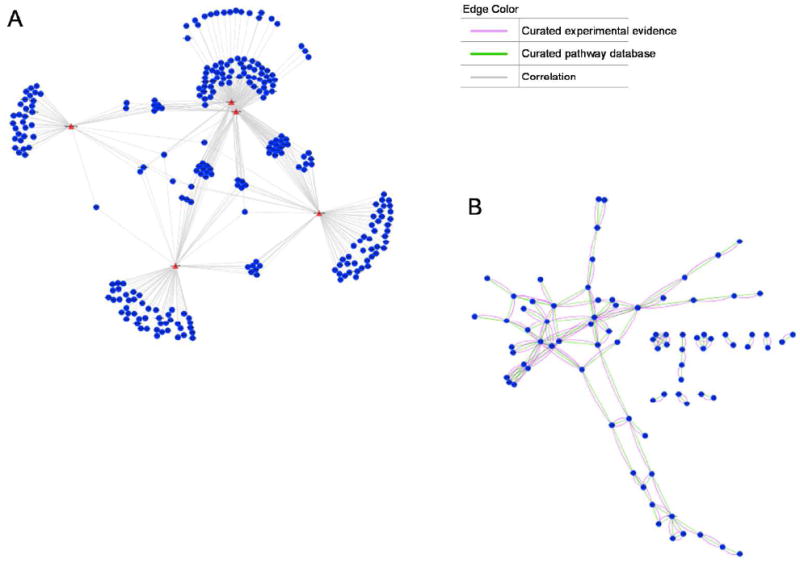
(A) Filtered network corresponding to the 5 miRNA selected for RT-QPCR validation extracted from the overall MAGIA correlation results. Individual miRNAs might regulate the expression of multiple mRNA targets. In the present study we used an initial set of 5 miRNAs identified from tissue and urinary cell pellet signatures from patients with CAD with IF/TA and performed integrative analyses with our already published gene expression data for the same samples (25, 37, 57), to evaluate the utility of miRNA:miRNA data integration and network identification. These analyses facilitate the identification of pathways that associates with specific miRNAs and have the potential for identifying therapeutic targets. Blue circles represent mRNAs and red triangles represent the 5 miRNAs. The figure insert describes the type of interaction. (B) Protein-protein interaction network identified from genes in (A).
Biological Processes and Molecular Functions
Toppgene (http://toppgene.cchmc.org) was used to identify biological processes overrepresented by the 83 genes identified above. Top biological processes included regulation of apoptosis (p=1.87E-07), cell activation (p=1.86E-04), immune system process (p=4.66E-04), protein phosphorylation (p=1.01E-03) and activation of JAK2 kinase activity (p=3.15E-03).
Distinctive MiRNA Profiles Early Post-KT in Urinary Samples from Patients with Good vs. Poor Graft Function at 24-months Post-transplantation
As a preliminary analysis and to justify the prospective evaluation of the selected markers in a larger cohort of samples, we tested differences in urinary cells miRNA profiles using microarrays at 3 months post-KT. Total RNA from urinary cells from a set of 20 patients (N = 10, stable good function at 24 months post-KT, N = 10, poor function at 24 months post-KT) were evaluated. From this analysis a total of 48 miRNAs were differentially expressed between groups (p <0.001, and ≥ 2-fold change) (Figure 5A) justifying further validation in the independent patient set with longitudinal samples using only selected markers. Moreover, from the analysis of differentially expressed miRNAs early post-KT and the 22 miRNAs identified as associated with urinary cells from patients with CAD with IF/TA, 5 miRNAs were identified as common between the signatures (Figure 5B). These common miRNAs corresponded to miR-200b, miR-375, miR-423-5p, miR-193b, and miR-345.
Figure 5.

(A) Volcano plot of miRNA microarray data for urine samples at early post-transplantation. The y-axis values show the negative logarithm base 10 of the p-value. The dotted horizontal line on the plot represents the α-level used for this analysis (0.05). The x-axis is shown as the log2-difference in estimated relative expression values. Vertical dotted lines represent the threshold for the log2-fold change (equivalent to a 2 fold change). Thus, the red dots correspond to miRNAs that show a significant (p≤0.05) 2-fold or greater change in expression between urine samples at 3 months post-KT in patients with stable versus poor graft function at 24 months post-KT. (B) Venn diagram showing overlapping between miRNAs differentially expressed in the CAD signature versus those differentially expressed early post-KT between urine samples from kidney transplant recipients with good vs. poor function at 24 months post-KT.
Prospective Evaluation of MiRNA Expression
We then tested the expression of the selected miRNAs in urinary cell pellets of kidney transplant recipients (N = 66) collected between 3 months and 24 months post-KT. The resulting miRNA panel, included a total of 12 markers (3 miRNAs differentially expressed between tissues (30) and 9 miRNAs from the urinary cell pellet signature (including 3 miRNAs statistically differentially expressed at both 3 months post-KT and CAD with IF/TA signatures)). MiRNAs were selected for validation as described in Methods. We aimed to evaluate the significance of the miRNAs in anticipating the histological damage in the kidney graft that associates to CAD with IF/TA. First, we classified patients depending on graft function at 24-months post-KT (≥40mL/min/1.73m2 or <40mL/min/1.73m2) (38) and presence or absence of histological findings associated with IF/TA in the last protocol biopsy (biopsy collection mean time 13.6±3.5 months post-KT) (defined as TA [ct ≥ 1] and IF [ci ≥ 1] involving more than 25% of the cortical area) (39) as ‘graft with good function (N=41) versus grafts with poor function (N=25)’. MiRNA expression was evaluated both in a cross-sectional and longitudinal manner.
The analysis of samples from both groups at the first time-point early post-KT (mean time collection: 3.73±1.30 months post-KT), showed miR-99a (p=0.029), miR-140-3p (p=0.041), miR-200b (p=0.04), miR-200* (p=0.047), and miR-142-3p (p=0.05) as being differentially expressed between the groups. From the longitudinally evaluation of the selected panel of miRNAs, miR-99a (p=0.05), miR-140-3p (p<0.001), miR-200b (p=0.033) and miR-200* (p=0.0018) were also significantly differentially expressed between groups at the second time-point evaluation (mean time collection = 20 ± 4 months post-KT) (Figure 6).
Figure 6.

Bar graphs showing the mean ΔCt ± SD values for miR-99a, miR-140-3p, miR-200*, and miR-200b measured in urinary cell pellets at early post-KT (time 1) and after 18 months post-KT (time 2). Patients were classified according their graft function as patients with good or poor graft function at 24 months post-KT. P-values between poor vs. good graft function for each miRNA are indicated by asterisks at Time 1 (**) and Time 2 (*).
Comparison Analysis between Proteinuria and miR-200b in the Longitudinal Study
We evaluated the utility of an actual marker of graft function (proteinuria) versus expression of miR-200b, identified as statistically differentially expressed in the CAD with IF/TA signature, in the early global miRNA signature early post-KT and at the two-time longitudinal analysis between groups. Specifically, proteinuria levels (mg/dL) were evaluated in the same samples collected at two time-points post-KT and used in the longitudinal analysis. Pearson’s correlation was used to evaluate the correlation between differentially expressed values of miR-200b and proteinuria. From this analysis, we observed that no correlation between proteinuria and miRNAs was observed at the first time-point analysis (r=0.28, p=0.067), while a trend in correlation was observed at the second time-point (r=0.43, p<0.001).
DISCUSSION
Major progress has been made in extending graft and patient survival after KT as a result of the development of improved immunosuppressive drugs and better patient management. Nonetheless, long-term graft outcomes are suboptimal and patients with failed transplants comprise an increasing re transplantation rate (www.unos.org). Development of individualized treatment strategies will require reliable, reproducible, cost-effective, yet non-invasive biomarkers capable of assessing the risk of graft injury.
Recent data suggest the implication of miRNAs in renal development and renal disease pathophysiology (40, 41), including fibrogenesis (42, 43), regulation of innate and adaptive immunity (44, 45), autoimmune diseases (46), and ACR of the renal allograft (27, 29). Two previous studies have identified miRNAs differentially expressed in graft rejection showing their potential as diagnostic biomarkers (23, 28). Our group recently published a miRNA signature in allograft tissue with histological diagnosis of CAD with IF/TA. Furthermore, we demonstrated the utility of selected miRNAs from the tissue signature as biomarkers in paired urine samples (30). A recent study, showed the utility of miRNA for detecting ACR in urine samples (29). However, the use of miRNAs for monitoring post-transplant kidney graft function has not been further yet explored.
An important part of this study includes the evaluation of the merit of urine samples from kidney transplant recipients as a way to non-invasively evaluate graft function using mRNA from different regions of the nephron and the collecting duct. Moreover, we evaluated differential expression of the studied mRNAs in urinary cell pellets versus urinary exosomes. Our results showed that urinary cell pellets contains mRNAs that are representative of the nephron and the collecting duct and provide similar information that the one provided by urinary exosomes, for the same mRNAs. However, we recognize that additional evaluations of different contribution of extracellular RNAs from cell-free urine, urinary cells pellets, and urinary exosomes as kidney biomarkers are still needed.
Furthermore, and to the best of our knowledge, herein we present the first miRNA signature generated in urine samples from kidney transplant recipients using microarrays. A total of 1,733 human mature miRNA were tested to establish an initial global signature in urine samples between the different groups (Figure 1). Even when the number of patients used for creating this signature is limited, the strict criteria used for selecting the groups (strict clinical / histological condition), provides a strong signature for biomarker validation. Moreover, urine sample collection from CAD with IF/TA patients is limited by the ability of these patients to produce urine, thus limiting the number of available samples. From this analysis, a total of 22 miRNAs were statistically differentially expressed between the groups (CAD versus NAF). Pathway and ontology analyses showed inflammation and fibrosis development patterns associated with the genes targeted for these miRNAs. As a second step, selected miRNAs were validated using RT-QPCR in an independent set of urine samples.
From our in silico results, the miRNA correlation network generated shows numerous mRNA:miRNA pairs identified with several of the mRNAs being correlated to more than one miRNA. When the genes within this network were checked against databases for known protein-protein interactions, we found that several had documented experimental interactions and were functionally related (within the same pathway).
MiR-142-3p is primarily expressed in peripheral blood mononuclear cells (47, 48) and has been implicated in the functional regulation of regulatory T-cells and macrophages (49). MiR-125b has been shown to be expressed in arteriolar renal smooth muscle and juxtaglomerular cells under normal conditions and that its role is to maintain the smooth muscle phenotype of these cells (50). MiR-125b has been also associated with playing a role in inflammation. This miRNA is down-regulated in response to LPS enabling TNF-α translation and resulting in elevated levels of interleukin 6 (IL6), C-reactive protein (CRP), and monocyte chemo-attractant protein 1 (MCP1) (51, 52). Increased levels of miR-125b have also been reported to be necessary in B-cell development (53, 54) and macrophage antigen presentation (55). Studies of miR-203 overexpression, inhibition, and mutagenesis validated posttranscriptional regulation of TNFα and IL24 by miR-203 in cell lines and primary keratinocytes (56). These findings suggest that miR-203 serves to fine-tune cytokine signaling and may dampen skin immune responses by repressing key pro-inflammatory cytokines.
Underlying factorial causes for CAD may in fact be impossible to decipher, when the graft is sampled with established injury on board. As we have shown previously (25, 57), extensive homogeneity of genomic responses are seen at this time. As a consequence, the identified signature may in fact be simply reflecting the current established tissue damage, instead than what initiated such injury. Many of the pathways involved in chronic graft injury might be regulated very early in the course of the damage when the final effects of these alterations are still not evident by histology, suggesting an additional need for early sampling prior to the onset of chronic pathology to identify triggers and early molecular markers for CAD disease progression. Although the study of IF/TA samples is a good starting point, our research focuses on identifying the potential causes leading to IF/TA and establishing potential molecular markers to forecast such events (37).
Following this aim, we evaluated the urinary cell pellet miRNA signature urine samples collected early post-KT and classified depending on patient graft function and histological findings at 24 months after transplantation. From this analysis we obtained early urinary cell pellet signatures differentiating allograft that showed continuous good function from those with decreased or poor function from transplantation. These findings supported the use of miRNAs in urine samples as earlier markers of progression to graft function. Moreover, as we expected, there was overlapping between miRNAs identified as part of the signature that relates with IF/TA and early signatures that associates with progression to CAD.
These encouraging results supported a further prospectively evaluation of the role of 12 selected miRNAs in the development of CAD (defined as grafts with a continued decrease in eGFR and histological evidence of IF/TA). From this longitudinal analysis, we identified a set of miRNAs statistically significantly differentially expressed early post-KT and moreover, a set differentially expressed a both time-points. MiRNA-200b was associated with the initial CAD with IF/TA signature, differentially expressed in the initial independent set of urines from patients classified depending on graft function, and differentially expressed at both time points in the longitudinal evaluation. Recently, miRNA-200b was described as a suppressor of TGFβ1 induced epithelial-to-mesenchymal transition (EMT) via inhibition of ZEB1 and ZEB2 and the extracellular matrix protein fibronectin by directing targeting of its 3’UTR mRNA, independent of pathways directly involved in TGFβ1 signaling (58). It was demonstrated by Xiong et al. (59) that the miR-200 family was responsible for protecting tubular epithelial cells from mesenchymal transition by target suppression of zinc finger E-box-binding homeobox (ZEB) proteins ZEB1 and ZEB2, which are E-cadherin transcriptional repressors. The results suggest that down regulation of the miR-200 family initiates the dedifferentiation of renal tubules and progression of renal fibrosis, which might provide important targets for novel therapeutic strategies. In our study, miR-200b and miR-200b*, were down-regulated in samples with CAD with IF/TA and moreover, in samples collected early after transplant from patients whose kidneys showed poor or no function at 24 months post-transplantation.
The analysis of miRNA expression in urine samples and proteinuria showed no correlation early post-KT, indicating the utility of these markers in early monitoring graft function. This finding supports the use of urinary cells miRNA profiles for the identification of patients at risk for accelerated loss of kidney function at early stages, when intervention is more likely to ameliorate outcomes.
We have identified a number of differentially expressed miRNAs in urinary cell pellets of histologically diagnosed CAD with IF/TA patients. RT-QPCR data generated from urine samples show that IF/TA samples segregate apart from NAF samples based solely on the expression levels of the five miRNAs tested (Figure 2). Moreover, when expanding the signature, 4 miRNAs showed to be potential markers of early kidney allograft injury. The longitudinal nature of the study, the sample size and the select group of patients included in the analyses (e.g., all deceased donor primary KT recipients with same immunosuppressant protocol) reinforces the significance of our findings. Further patient follow-up and sample testing is needed to confirm this observation.
METHODS
Enrolled Cohort
A total of 191 samples from 125 kidney transplant recipients of unique deceased donors were included in the study (Figure 1). Patients were enrolled between May 2004 and November 2010. The study was conducted at University of Virginia and Virginia Commonwealth University after Institutional Review Board approval was obtained at both institutions (UVA 14849, VCU#HM11454). Written informed consent was obtained from all patients. No living donors, HIV positive, and/or re-transplant patients were included. Patients between the ages of 21 and 70 were enrolled in the study. Immunosuppressant protocol consisted of tacrolimus-based therapy, plus mycophenolate mofetil and prednisone. Estimated Glomerular Filtration Rate (eGFR) was calculated using the Modification of Diet in Renal Disease (MDRD) formula (60). Protocol kidney biopsies were performed in all the enrolled patients at 3 and 9-12 months post-transplantation. Blinded centralized histological evaluation was performed by two pathologists using Banff 07 classification (39). Patients that during the follow-up presented causes for late decline in eGFR, (e.g., BK viral nephropathy, original disease recurrence) were not included in the study to avoid potential confounders.
Urine Samples
To generate the initial miRNA signature, urine samples were selected from patients with biopsy proven CAD with IF/TA, (N=10) and from patients with NAF (N=12) (training set). NAF patients were defined as kidney transplant recipients with at least 9 months post-transplant and presenting sustained eGFRs >60mL/min/1.73m2 since the transplantation date and normal histology to the time of sample collection, no reported delayed graft function (DGF), diagnosis of calcineurin inhibitor nephrotoxicity (CNIT) or ACR episodes. DGF was defined as the need for dialysis within the first 7 days post-KT. A second independent set of urinary cell pellets from CAD with IF/TA (N=7) or NAF (N=10) patients was used for validation of the array results (validation set). Finally, a third set (N=132) was used for evaluating a selected panel of miRNA expression with respect to graft function and histological findings at 24 month post-KT (prospective testing group).
Total RNA Isolation
Urinary cell pellets were collected by centrifugation of the collected urine samples at 3,000 xg for 20 minutes at room temperature. A detailed description of methods is included in the Supplemental Information.
MicroRNA Signature Generation and Data analysis
Total RNA (250 ng) from each specimen was labeled using the FlashTag™ Biotin HSR RNA labeling kit (Genisphere Inc., Hatfield, PA). A detailed description of methods is included in the Supplemental Information.
Identification of Differentially Expressed MiRNAs in Urine Samples Early Post-KT between Patient Groups Using Microarrays
To evaluate the hypothesis that differentially expressed miRNA signatures identified early post-KT can be used for identifying early biomarkers of progression to CAD with IF/TA, urine samples collected at 3 months post-KT from 20 kidney transplant recipients (classified as with good kidney function vs. poor graft function following at 24 months post-KT as previously described) were also tested using GeneChip® miRNA v3.0 Array, and scanned on a GeneChip® Scanner 3000 7G.
Selection of MiRNAs for Prospective Validation
From the total of the miRNA that were identified as differentially expressed based on our cut-off criteria, 9 miRNA (41% of the list) were validated in the prospective group of patients. In addition, 3 miRNAs identified as differentially expressed in the recently tissue miRNA signature were also included (30). The total panel of miRNAs used for validation in the prospective set included: miR-125b, miR-203, miR-142-3p, miR-204 (previously described in Validation of Microarray Results), and miR-211 (assay ID: 000514), miR-99a (assay ID: 002141), miR106b* (assay ID: 2380), miR-140-3p (assay ID: 002234), miR-185 (assay ID: 000598), miR-200b (assay ID; 002251), miR-200b* (assay ID: 002274) and miR-486-5p (assay ID: 001278). The selection of miRNA for validation was based on statistical significance, folds changes, and described biological function. We then tested the expression of the selected miRNAs in urinary cell pellets of kidney transplant recipients (N = 66) collected between 3 months and 24 months post-KT.
mRNA:miRNA Interaction Network Analysis
A meta-analysis approach was adopted to compare mRNA and miRNA expression signatures using the web based tool MAGIA (MiRNA and Gene Integrative Analysis) (31, 32). Using this tool, an empirical Bayes test (61), as implemented in the limma package in the R environment (62), is applied separately to the miRNA and mRNA expression data to identify molecules whose expression changes closely correlate with one another. Simultaneously, for predicted mRNA:miRNA interactions identified based on three prediction algorithms (PITA, TargetScan, and miRanda) the inverse Chi-squared approach is used to combine miRNA and mRNA p-values (31, 32). P-values from this test of over-expressed miRNAs are then combined with those of under-expressed mRNAs and vice versa. Network interactions identified by MAGIA were graphed using Cytoscape (37). Biological Processes and molecular functions were identified through the use of ToppGene (http://toppgene.cchmc.org/) and Ingenuity Pathways Analysis (www.ingenuity.com). Functional categories with enrichment (negative binomial) test a p-value <0.05 were considered significant. Biological processes with identical gene lists were considered redundant and manually removed prior to the interpretation of results.
Supplementary Material
Acknowledgments
The research results included in this report were supported by a National Institute of Diabetes and Digestive and Kidney Diseases (NIDDK) grant, R01DK080074.
ABBREVIATIONS
- ACR
acute cellular rejection
- CAD
chronic allograft dysfunction
- DGF
delayed graft function
- eGFR
estimated glomerular filtration rate
- IF
interstitial fibrosis
- MAGIA
MiRNA and Gene Integrative Analysis
- NAF
normal allograft function
- RT-QPCR
real-time quantitative-polymerase chain reaction
- RMA
Robust Multiarray Analysis
- KT
kidney transplant
- TA
tubular atrophy
Footnotes
SUPPORTING INFORMATION
- Supplemental Figure 1. Merging of the mRNA-miRNA co-expression and protein-protein interaction networks from Figure 4.
- Supplemental information about comparison of selected mRNA and miRNAs between urinary cell pellets and urinary exosomes and detailed methodological methods for miRNA microarray reactions and data analysis.
Supplementary information is available at Kidney International’s website
DISCLOSURE
The authors of this manuscript have no conflicts of interest to disclose as described by the journal Kidney International
References
- 1.Al-Awwa IA, Hariharan S, First MR. Importance of allograft biopsy in renal transplant recipients: correlation between clinical and histological diagnosis. Am J Kidney Dis. 1998;31(Suppl 1):S15–18. doi: 10.1053/ajkd.1998.v31.pm9631859. [DOI] [PubMed] [Google Scholar]
- 2.John R, Herzenberg AM. Our approach to a renal transplant biopsy. J Clin Pathol. 2010;63:26–37. doi: 10.1136/jcp.2009.067983. [DOI] [PubMed] [Google Scholar]
- 3.Kozakowski N, Regele H. Biopsy diagnostics in renal allograft rejection: from histomorphology to biological function. Transpl Int. 2009;22:945–953. doi: 10.1111/j.1432-2277.2009.00885.x. [DOI] [PubMed] [Google Scholar]
- 4.Mannon RB, Kirk AD. Beyond histology: novel tools to diagnose allograft dysfunction. Clin J Am Soc Nephrol. 2006;1:358–366. doi: 10.2215/CJN.01681105. [DOI] [PubMed] [Google Scholar]
- 5.Gourishankar S, Leduc R, Connett J, et al. Pathological and clinical characterization of the ‘troubled transplant’: data from the DeKAF study. Am J Transplant. 2010;10:324–330. doi: 10.1111/j.1600-6143.2009.02954.x. [DOI] [PMC free article] [PubMed] [Google Scholar]
- 6.Rush D. Can protocol biopsy better inform our choices in renal transplantation? Transplant Proc. 2009;41(6 Suppl):S6–8. doi: 10.1016/j.transproceed.2009.06.092. [DOI] [PubMed] [Google Scholar]
- 7.Lezaic V, Naumovic R, Marinkovic J, et al. Donor kidney glomerular filtration rate and post-transplant graft function. Am J Transplant. 2004;4:1669–1674. doi: 10.1111/j.1600-6143.2004.00553.x. [DOI] [PubMed] [Google Scholar]
- 8.Bargnoux AS, Servel AC, Piéroni L, et al. Accuracy of GFR predictive equations in renal transplantation: validation of a new turbidimetric cystatin C assay on Architect c8000. Biology of renal function and renal failure working group. Clin Biochem. 2012;45:151–153. doi: 10.1016/j.clinbiochem.2011.10.018. [DOI] [PubMed] [Google Scholar]
- 9.Buron F, Hadj-Aissa A, Dubourg L, et al. Estimating glomerular filtration rate in kidney transplant recipients: performance over time of four creatinine-based formulas. Transplantation. 2011;92:1005–1011. doi: 10.1097/TP.0b013e3182301602. [DOI] [PubMed] [Google Scholar]
- 10.Eriksen BO, Mathisen UD, Melsom T, et al. The role of cystatin C in improving GFR estimation in the general population. Am J Kidney Dis. 2012;59:32–40. doi: 10.1053/j.ajkd.2011.09.001. [DOI] [PubMed] [Google Scholar]
- 11.Delanaye P, Mariat C, Moranne O, et al. Estimating glomerular filtration rate in 2012: Which adding value for the CKD-EPI equation? Nephrol Ther. 2012;8:199–205. doi: 10.1016/j.nephro.2012.03.002. [DOI] [PubMed] [Google Scholar]
- 12.Diamantidis CJ, Seliger SL, Zhan M, et al. A Varying Patient Safety Profile Between Black and Nonblack Adults With Decreased Estimated GFR. Am J Kidney Dis. 2012;60:47–53. doi: 10.1053/j.ajkd.2012.01.023. [DOI] [PubMed] [Google Scholar]
- 13.Kwong YT, Stevens LA, Selvin E, et al. Imprecision of urinary iothalamate clearance as a gold-standard measure of GFR decreases the diagnostic accuracy of kidney function estimating equations. Am J Kidney Dis. 2010;56:39–49. doi: 10.1053/j.ajkd.2010.02.347. [DOI] [PMC free article] [PubMed] [Google Scholar]
- 14.Ju W, Smith S, Kretzler M. Genomic biomarkers for chronic kidney disease. Transl Res. 2012;159:290–302. doi: 10.1016/j.trsl.2012.01.020. [DOI] [PMC free article] [PubMed] [Google Scholar]
- 15.Fassett RG, Venuthurupalli SK, Gobe GC, et al. Biomarkers in chronic kidney disease: a review. Kidney Int. 2011;80:806–821. doi: 10.1038/ki.2011.198. [DOI] [PubMed] [Google Scholar]
- 16.Perkins D, Verma M, Park KJ. Advances of genomic science and systems biology in renal transplantation: a review. Semin Immunopathol. 2011;33:211–218. doi: 10.1007/s00281-011-0243-2. [DOI] [PMC free article] [PubMed] [Google Scholar]
- 17.Patel V, Noureddine L. MicroRNAs and fibrosis. Curr Opin Nephrol Hypertens. 2012;21:410–416. doi: 10.1097/MNH.0b013e328354e559. [DOI] [PMC free article] [PubMed] [Google Scholar]
- 18.Kong YW, Ferland-McCollough D, Jackson TJ, et al. microRNAs in cancer management. Lancet Oncol. 2012;13:e249–258. doi: 10.1016/S1470-2045(12)70073-6. [DOI] [PubMed] [Google Scholar]
- 19.Beltrami C, Clayton A, Phillips AO, et al. Analysis of urinary microRNAs in chronic kidney disease. Biochem Soc Trans. 2012;40:875–879. doi: 10.1042/BST20120090. [DOI] [PubMed] [Google Scholar]
- 20.Matheson A, Willcox MD, Flanagan J, Walsh BJ. Urinary biomarkers involved in type 2 diabetes: a review. Diabetes Metab Res Rev. 2010;26:150–171. doi: 10.1002/dmrr.1068. [DOI] [PubMed] [Google Scholar]
- 21.Caubet C, Lacroix C, Decramer S, et al. Advances in urinary proteome analysis and biomarker discovery in pediatric renal disease. Pediatr Nephrol. 2010;25:27–35. doi: 10.1007/s00467-009-1251-5. [DOI] [PubMed] [Google Scholar]
- 22.Afaneh C, Muthukumar T, Lubetzky M, et al. Urinary cell levels of mRNA for OX40,OX40L, PD-1, PD-L1, or PD-L2 and acute rejection of human renal allografts. Transplantation. 2010;90:1381–1387. doi: 10.1097/TP.0b013e3181ffbadd. [DOI] [PMC free article] [PubMed] [Google Scholar]
- 23.Muthukumar T, Dadhania D, Ding R, et al. Messenger RNA for FOXP3 in the urine of renal-allograft recipients. N Engl J Med. 2005;353:2342–2351. doi: 10.1056/NEJMoa051907. [DOI] [PubMed] [Google Scholar]
- 24.Dadhania D, Snopkowski C, Ding R, et al. Validation of noninvasive diagnosis of BK virus nephropathy and identification of prognostic biomarkers. Transplantation. 2010;90:189–197. doi: 10.1097/TP.0b013e3181e2a932. [DOI] [PMC free article] [PubMed] [Google Scholar]
- 25.Mas V, Maluf D, Archer K, et al. Establishing the molecular pathways involved in chronic allograft nephropathy for testing new noninvasive diagnostic markers. Transplantation. 2007;83:448–457. doi: 10.1097/01.tp.0000251373.17997.9a. [DOI] [PubMed] [Google Scholar]
- 26.Mas VR, Mas LA, Archer KJ, et al. Evaluation of gene panel mRNAs in urine samples of kidney transplant recipients as a non-invasive tool of graft function. Mol Med. 2007;13:315–324. doi: 10.2119/2007-00017.Mas. [DOI] [PMC free article] [PubMed] [Google Scholar]
- 27.Sui W, Dai Y, Huang Y, et al. Microarray analysis of MicroRNA expression in acute rejection after renal transplantation. Transpl Immunol. 2008;19:81–85. doi: 10.1016/j.trim.2008.01.007. [DOI] [PubMed] [Google Scholar]
- 28.Anglicheau D, Sharma VK, Ding R, et al. MicroRNA expression profiles predictive of human renal allograft status. Proc Natl Acad Sci U S A. 2009;106:5330–5335. doi: 10.1073/pnas.0813121106. [DOI] [PMC free article] [PubMed] [Google Scholar]
- 29.Lorenzen JM, Volkmann I, Fiedler J, et al. Urinary miR-210 as a mediator of acute T-cell mediated rejection in renal allograft recipients. Am J Transplant. 2011;11:2221–2227. doi: 10.1111/j.1600-6143.2011.03679.x. [DOI] [PubMed] [Google Scholar]
- 30.Scian MJ, Maluf DG, David KG, et al. MicroRNA profiles in allograft tissues and paired urines associate with chronic allograft dysfunction with IF/TA. Am J Transplant. 2011;11:2110–2122. doi: 10.1111/j.1600-6143.2011.03666.x. [DOI] [PMC free article] [PubMed] [Google Scholar]
- 31.Sales G, Coppe A, Bisognin A, et al. MAGIA, a web-based tool for miRNA and Genes Integrated Analysis. Nucleic Acids Res. 2010;38(Web Server issue):W352–9. doi: 10.1093/nar/gkq423. [DOI] [PMC free article] [PubMed] [Google Scholar]
- 32.Bisognin A, Sales G, Coppe A, et al. MAGIA2: from miRNA and genes expression data integrative analysis to microRNA-transcription factor mixed regulatory circuits (2012 update) Nucleic Acids Res. 2012l;40(Web Server issue):W13–21. doi: 10.1093/nar/gks460. [DOI] [PMC free article] [PubMed] [Google Scholar]
- 33.He W, Tan RJ, Li Y, et al. Matrix metalloproteinase-7 as a surrogate marker predicts renal Wnt/β-catenin activity in CKD. J Am Soc Nephrol. 2012;23:294–304. doi: 10.1681/ASN.2011050490. [DOI] [PMC free article] [PubMed] [Google Scholar]
- 34.Szeto CC, Chow KM, Lai KB, et al. mRNA expression of target genes in the urinary sediment as a noninvasive prognostic indicator of CKD. Am J Kidney Dis. 2006;47(4):578–86. doi: 10.1053/j.ajkd.2005.12.027. [DOI] [PubMed] [Google Scholar]
- 35.Wang G, Lai FM, Lai KB, et al. Messenger RNA expression of podocyte-associated molecules in the urinary sediment of patients with diabetic nephropathy. Nephron Clin Pract. 2007;106:c169–79. doi: 10.1159/000104428. [DOI] [PubMed] [Google Scholar]
- 36.Scian MJ, Maluf DG, Archer KJ, et al. Gene expression changes are associated with loss of kidney graft function and interstitial fibrosis and tubular atrophy: diagnosis versus prediction. Transplantation. 2011;91:657–665. doi: 10.1097/TP.0b013e3182094a5a. [DOI] [PMC free article] [PubMed] [Google Scholar]
- 37.Shannon P, Markiel A, Ozier O, et al. Cytoscape: a software environment for integrated models of biomolecular interaction networks. Genome Res. 2003;13:2498–2504. doi: 10.1101/gr.1239303. [DOI] [PMC free article] [PubMed] [Google Scholar]
- 38.Kidney Disease: Improving Global Outcomes (KDIGO) Transplant Work Group. KDIGO clinical practice guideline for the care of kidney transplant recipients. Am J Transplant. 2009;9(Suppl 3):S1. doi: 10.1111/j.1600-6143.2009.02834.x. [DOI] [PubMed] [Google Scholar]
- 39.Solez K, Colvin RB, Racusen, et al. Banff 07 classification of renal allograft pathology: updates and future directions. Am J Transplant. 2008;8:753–760. doi: 10.1111/j.1600-6143.2008.02159.x. [DOI] [PubMed] [Google Scholar]
- 40.Chandrasekaran K, Karolina DS, Sepramaniam S, et al. Role of microRNAs in kidney homeostasis and disease. Kidney Int. 2012;81:617–27. doi: 10.1038/ki.2011.448. [DOI] [PubMed] [Google Scholar]
- 41.Bhatt K, Mi QS, Dong Z. microRNAs in kidneys: biogenesis, regulation, and pathophysiological roles. Am J Physiol Renal Physiol. 2011;300:F602–10. doi: 10.1152/ajprenal.00727.2010. [DOI] [PMC free article] [PubMed] [Google Scholar]
- 42.Kato M, Natarajan R. MicroRNA circuits in transforming growth factor-β actions and diabetic nephropathy. Semin Nephrol. 2012;32:253–60. doi: 10.1016/j.semnephrol.2012.04.004. [DOI] [PMC free article] [PubMed] [Google Scholar]
- 43.Li JY, Yong TY, Michael MZ, Gleadle JM. Review: The role of microRNAs in kidney disease. Nephrology (Carlton) 2010;15:599–608. doi: 10.1111/j.1440-1797.2010.01363.x. [DOI] [PubMed] [Google Scholar]
- 44.Elias S, Mandelboim O. Battle of the midgets: innate microRNA networking. RNA Biol. 2012;9(6):792–8. doi: 10.4161/rna.19717. [DOI] [PubMed] [Google Scholar]
- 45.Liston A, Papadopoulou AS, Danso-Abeam D, Dooley J. MicroRNA-29 in the adaptive immune system: setting the threshold. Cell Mol Life Sci. 2012;69(21):3533–41. doi: 10.1007/s00018-012-1124-0. [DOI] [PMC free article] [PubMed] [Google Scholar]
- 46.Hu R, O’Connell RM. MicroRNA control in the development of systemic autoimmunity. Arthritis Res Ther. 2013;15(1):202. doi: 10.1186/ar4131. [DOI] [PMC free article] [PubMed] [Google Scholar]
- 47.Merkerova M, Belickova M, Bruchova H. Differential expression of microRNAs in hematopoietic cell lineages. Eur J Haematol. 2008;81:304–310. doi: 10.1111/j.1600-0609.2008.01111.x. [DOI] [PubMed] [Google Scholar]
- 48.Chen CZ, Li L, Lodish HF, et al. MicroRNAs modulate hematopoietic lineage differentiation. Science. 2004;303:83–86. doi: 10.1126/science.1091903. [DOI] [PubMed] [Google Scholar]
- 49.Huang B, Zhao J, Lei Z, et al. miR-142-3p restricts cAMP production in CD4+CD25- T cells and CD4+CD25+ TREG cells by targeting AC9 mRNA. EMBO Rep. 2009;10(2):180–185. doi: 10.1038/embor.2008.224. [DOI] [PMC free article] [PubMed] [Google Scholar]
- 50.Medrano S, Monteagudo MC, Sequeira-Lopez ML, et al. Two microRNAs, miR-330 and miR-125b-5p, mark the juxtaglomerular cell and balance its smooth muscle phenotype. Am J Physiol Renal Physiol. 2012;302:F29–37. doi: 10.1152/ajprenal.00460.2011. [DOI] [PMC free article] [PubMed] [Google Scholar]
- 51.Tili E, Michaille JJ, Cimino A, et al. Modulation of miR-155 and miR-125b levels following lipopolysaccharide/TNF-alpha stimulation and their possible roles in regulating the response to endotoxin shock. J Immunol. 2007;179:5082–5089. doi: 10.4049/jimmunol.179.8.5082. [DOI] [PubMed] [Google Scholar]
- 52.Tsitsiou E, Lindsay MA. microRNAs and the immune response. Curr Opin Pharmacol. 2009;9:514–520. doi: 10.1016/j.coph.2009.05.003. [DOI] [PMC free article] [PubMed] [Google Scholar]
- 53.Sonkoly E, Stahle M, Pivarcsi A. MicroRNAs: novel regulators in skin inflammation. Clin Exp Dermatol. 2008;33:312–315. doi: 10.1111/j.1365-2230.2008.02804.x. [DOI] [PubMed] [Google Scholar]
- 54.Malumbres R, Sarosiek KA, Cubedo E, et al. Differentiation stage-specific expression of microRNAs in B lymphocytes and diffuse large B-cell lymphomas. Blood. 2009;113:3754–3764. doi: 10.1182/blood-2008-10-184077. [DOI] [PMC free article] [PubMed] [Google Scholar]
- 55.Chaudhuri AA, So AY, Sinha N, et al. MicroRNA-125b potentiates macrophage activation. J Immunol. 2011;187:5062–5068. doi: 10.4049/jimmunol.1102001. [DOI] [PMC free article] [PubMed] [Google Scholar]
- 56.Primo MN, Bak RO, Schibler B, Mikkelsen JG. Regulation of pro-inflammatory cytokines TNFα and IL24 by microRNA-203 in primary keratinocytes. Cytokine. 2012;60:741–748. doi: 10.1016/j.cyto.2012.07.031. [DOI] [PubMed] [Google Scholar]
- 57.Maluf DG, Mas VR, Archer KJ, et al. Molecular pathways involved in loss of kidney graft function with tubular atrophy and interstitial fibrosis. Mol Med. 2008;14:276–285. doi: 10.2119/2007-00111.Maluf. [DOI] [PMC free article] [PubMed] [Google Scholar]
- 58.Tang O, Chen X, Shen S, Hahn M, et al. miRNA-200b represses transforming growth factor beta1-induced EMT and fibronectin expression in kidney proximal tubular cells. Am J Physiol Renal Physiol. 2013 Feb 13; doi: 10.1152/ajprenal.00302.2012. Epub ahead of print. [DOI] [PubMed] [Google Scholar]
- 59.Xiong M, Jiang L, Zhou Y, et al. The miR-200 family regulates TGF-β1-induced renal tubular epithelial to mesenchymal transition through Smad pathway by targeting ZEB1 and ZEB2 expression. Am J Physiol Renal Physiol. 2012;302:F369–79. doi: 10.1152/ajprenal.00268.2011. [DOI] [PubMed] [Google Scholar]
- 60.Levey AS, Bosch JP, Lewis JB, et al. A more accurate method to estimate glomerular filtration rate from serum creatinine: A new prediction equation. Modification of Diet in Renal Disease Study Group. Ann Intern Med. 1999;130:461–470. doi: 10.7326/0003-4819-130-6-199903160-00002. [DOI] [PubMed] [Google Scholar]
- 61.Noma H, Matsui S. The optimal discovery procedure in multiple significance testing: an empirical Bayes approach. Stat Med. 2012;31:165–176. doi: 10.1002/sim.4375. [DOI] [PubMed] [Google Scholar]
- 62.Benjamini Y, Hochberg Y. Controlling the false discovery rate: A practical and powerful approach to multiple testing. Journal of the Royal Statistical Society. Series B (Methodological) 1995;57:Z289–300. [Google Scholar]
Associated Data
This section collects any data citations, data availability statements, or supplementary materials included in this article.