

Abstract
Purpose
Although mean concentrations of hemoglobin A1c (A1C), fasting plasma glucose, and 2-hour plasma glucose differ by demographics, it is unclear what other characteristics of the distributions may differ, such as the amount of asymmetry of the distribution (skewness) and shift left or right compared to another distribution (shift).
Methods
Using kernel density estimation, we created smoothed plots of the distributions of fasting plasma glucose (N=7,250), 2-hour plasma glucose (N=5,851), and A1C (N=16,209) by age, race-ethnicity, and sex in the 2005–2010 National Health and Nutrition Examination Survey, a nationally representative sample of US adults including people with and without diabetes. We tested differences in distributions using cumulative logistic regression.
Results
The distributions were generally unimodal and right-skewed. All distributions were shifted higher and more right-skewed for older age groups (p<0.001 for each marker). Compared to non-Hispanic whites, the distribution of fasting plasma glucose was shifted higher for Mexican-Americans (p=0.01) while the distribution of A1C was shifted higher for non-Hispanic blacks (p<0.001). The distribution of fasting plasma glucose was shifted higher for men (p<0.001) and the distribution of 2-hour plasma glucose was shifted higher for women (p=0.01).
Conclusions
We provide a graphic reference for comparing these distributions and diabetes cutpoints by demographic factors.
Keywords: Hemoglobin A1c, fasting plasma glucose, 2-hour plasma glucose, kernel density estimation, NHANES
Introduction
Mean concentrations of fasting glucose, 2-hour glucose, and hemoglobin A1c (A1C) differ by demographic characteristics. Older people have higher levels of all glucose markers [1–7]. Blacks tend to have higher A1C than whites while fasting glucose and 2-hour glucose concentrations appear similar [5, 7–14]. Although relatively few studies have compared Hispanics with people of other ethnicities, Hispanics may have higher levels of glucose biomarkers than non-Hispanic whites [8, 10, 12, 15, 16]. There are no clear differences in A1C by sex, while some studies have shown fasting glucose may be higher in men and 2-hour glucose higher in women [6, 7, 17–19].
The extent to which the distributions of glucose measures differ by demographic characteristics is unclear. There are several ways in which the distributions could differ, some of which will have little or no effect on the mean levels of a variable. A distribution that is shifted left or right relative to another distribution is reflected in a comparison of means. Differences in the level of asymmetry of the two distributions, or skewness, will be somewhat reflected in a comparison of means but will be indistinguishable from a distribution shift. Differences in kurtosis, or the thickness of the tails, will not be evident when comparing the mean levels among two groups. Previous studies have indicated glucose biomarkers are often skewed and occasionally bimodal, but the shapes of the distributions of fasting glucose, 2-hour glucose, and A1C have not been explored in the US general population, and differences in the distributions by demographic characteristics have not been fully characterized [5, 20–22].
We characterized the distributions of fasting glucose, 2-hour glucose, and A1C by age group, race-ethnicity, and sex using kernel density plots, which display smoothed distributions [23]. To do so, we analyzed data from the 2005–2010 National Health and Nutrition Examination Survey (NHANES), which was designed to be representative of the US general population.
Methods
Study population
The NHANES is a stratified, multistage probability survey designed to be representative of the civilian, non-institutionalized US population including people with and without diabetes [24]. It consists of an in-home interview and a subsequent visit to a mobile examination center. Our aim was to allow comparisons across demographic groups for a given marker. Because fasting glucose, 2-hour glucose, and A1C were measured in different subsamples, we analyzed each biomarker using a different study sample. In 2005–2010, 18,318 adults ≥18 years of age were interviewed and 17,689 were subsequently examined (96.6%). We excluded pregnant women (n=479) and individuals with missing data for A1C (n=1001), yielding 16,209 participants who were available for A1C analyses. Approximately half of the examination sample (n=8,332) was randomly assigned to a morning examination session during which a fasting blood sample was drawn and an oral glucose tolerance test (OGTT) was performed. Our analyses of fasting glucose excluded persons who did not fast between 8 and 24 hours (n=883) or had missing data for fasting glucose (n=199), resulting in 7,250 participants. Our analyses of 2-hour plasma glucose from an OGTT further excludes participants who were not administered an OGTT because they were taking insulin (n=214), oral diabetes medication (n=563), or met another exclusion criteria such as having refused the OGTT, had hemophilia, or had recent chemotherapy (n=623), yielding 5,850 participants.
The 2005–2010 NHANES protocol was approved by the National Center for Health Statistics of the Centers for Disease Control and Prevention Institutionalized Review Board. All participants gave written informed consent.
Data Collection
During the in-home interview, a standardized questionnaire was used to collect demographic information including age, race-ethnicity, and sex. During the visit to the mobile examination center, height and weight were measured and body mass index (BMI, weight/height2) was calculated. A blood specimen was drawn from the participant’s antecubital vein by a trained phlebotomist according to a standardized protocol. A1C was measured using a Tosoh A1C 2.2 Plus Glycohemoglobin Analyzer or a Tosoh G7 Automated HPLC Analyzer, which had reportable ranges of 3.4–18.8% (14–182 mmol/mol) and 3.0–19.0% (9–184 mmol/mol), respectively [24]. The inter-assay coefficient of variation ranged from 0.7–1.7% and 0.8–1.5%, respectively. Both analyzers used in A1c measurement were standardized by participating in the National Glycohemoglobin Standardization Program (NGSP). Certain hemoglobinopathies may affect the A1C measurement [25–28], but hemoglobinopathies were not determined in NHANES. Eligible participants were administered a 75-g (or a calibrated dose for participants weighing <94 pounds) glucose load (Trutol) oral-glucose tolerance test and a blood sample was drawn 2 hours later. Fasting and 2-hour glucose were measured in plasma by a hexokinase method using a Roche/Hitachi 911 Analyzer and Roche Modular P Chemistry Analyzer, which had an analytical measurement range of 2–750 mg/dL in 2005–2006 and 0–750 mg/dL in 2007–2010. The inter-assay coefficient of variation ranged from 0.8–2.6%.
Statistical Analysis
Distributions of fasting glucose, 2-hour glucose, and A1C were plotted using weighted kernel density estimation, a non-parametric method of estimating the probability density function [23]. Kernel density plots smooth over small fluctuations in data due to random sampling variation and therefore may better reflect the underlying distribution in the source population than, for example, a histogram of the study data. We do not show the y-axes since these are normalized distributions and the y-axes do not have useful interpretations; the goal is to show the shape of the overall distributions. For all kernel density plots, we used a bandwidth double that given by “Silverman’s rule of thumb”. Silverman’s rule of thumb is 0.9*A*n−0.2, where A = min(SD; IR range/1.34) and SD = standard deviation and IR = interquartile range [23]. First, kernel density plots for all participants and for participants who were not previously diagnosed with diabetes were superimposed. Since our goal was to characterize the entire US population, subsequent analyses including kernel density plots by age group, race-ethnicity, and sex included all participants. Mean, percentiles, and mode (the estimated most common value in the population indicated as the highest point in the estimated kernel density distribution) were calculated. To test for differences in the kernel density plots, we used cumulative logistic regression [29] on deciles of A1C, fasting glucose, or 2-hour glucose to compare age (18–39, 40–59, and ≥60 years), race-ethnicity (non-Hispanic white, non-Hispanic black, Mexican-American), and sex categories. Other race-ethnicities were included in all analyses except analyses stratified by race-ethnicity. Initial models were unadjusted and subsequent models adjusted for the other demographic variables. An additional model further adjusted for BMI (continuous) and a final model further adjusted for height (continuous) as a proxy for metabolically active tissue which may affect rate of glucose metabolism [18, 30].
Plots were generated using R (version 2.14.0) and additional data analyses were done using SUDAAN (version 10.0.1; Research Triangle Institute, Research Triangle Park, NC) to account for the complex sampling design used by NHANES, including unequal probabilities of selection, over-sampling, non-response, and the stratified, clustered, sample design [24]. Separate sample weights were applied to each analytic population (i.e., fasting plasma glucose, 2-hour plasma glucose, and A1C) so that all three groups were representative of the noninstitutionalized US general population.
Results
The kernel density plots of the overall population were generally unimodal and right skewed (Figure 1). Kernel density plots among people without previously diagnosed diabetes were similar to those that included everyone in the study population except that the fasting glucose and A1C plots were slightly less right-skewed. In subsequent analyses including all participants, kernel density plots of fasting glucose, 2-hour glucose, and A1C stratified by age showed distributions were shifted higher and more right skewed for older age groups (Figure 2). For participants 18–39 years, 40–59 years, and ≥60 years, the median fasting plasma glucose was 94, 99, and 105 mg/dL, respectively; the median 2-hour plasma glucose was 94, 107, and 132 mg/dL, respectively; the median A1C was 5.1, 5.4, and 5.6% (32, 36, and 38 mmol/mol), respectively (Table 1). Modes of the distributions for these respective ages were 95, 98, and 102 mg/dL for fasting plasma glucose; 90, 100, and 119 mg/dL for 2-hour plasma glucose; 5.2, 5.4, and 5.6% (33, 36, and 38 mmol/mol) for A1C. In order to test for differences in the entire distributions, we used cumulative logistic regression on deciles of A1C, fasting glucose, or 2-hour glucose. Compared to younger age groups, participants in older age groups had higher cumulative odds of being in higher deciles of fasting plasma glucose, 2-hour plasma glucose, and A1C (each p<0.001) and results were similar after adjustment for race-ethnicity, sex, BMI, and height (Table 2), illustrating the well-known increase in glucose intolerance with age.
Figure 1.
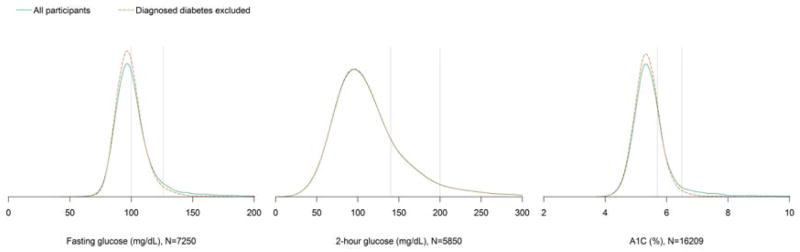
Kernel density plots of fasting plasma glucose, 2-hour plasma glucose, and A1C among the total population and after excluding participants with previously diagnosed diabetes. The vertical lines denote the American Diabetes Association cutpoints for prediabetes (5.7% [39 mmol/mol], 100 mg/dL, and 140 mg/dL) and diabetes (6.5% [48 mmol/mol], 126 mg/dL, and 200 mg/dL). Among participants without diagnosed diabetes, 38.9% had a fasting plasma glucose 100–125 mg/dL, 3.5% had a fasting plasma glucose ≥126 mg/dL, 27.4% had a 2-hour plasma glucose 140–199 mg/dL, 5.4% had a 2-hour plasma glucose ≥200 mg/dL, 20.9% had an A1C 5.7–6.4%, and 2.3% had an A1C ≥6.5%.
Figure 2.

Kernel density plots of fasting plasma glucose, 2-hour plasma glucose, and A1C by A) age group, B) race-ethnicity, and C) sex. The vertical lines denote the American Diabetes Association cutpoints for prediabetes (5.7% [39 mmol/mol], 100 mg/dL, and 140 mg/dL) and diabetes (6.5% [48 mmol/mol], 126 mg/dL, and 200 mg/dL). Differences in distributions were tested using cumulative logistic regression as presented in Table 2.
Table 1.
Percentiles, mean, and mode of the kernel density distribution of fasting plasma glucose, 2-hour plasma glucose, and A1C by age, race-ethnicity, and sex
| 5th | 10th | 25th | 50th | 75th | 90th | 95th | Mean | Mode | |
|---|---|---|---|---|---|---|---|---|---|
| Fasting plasma glucose, N=7250 | |||||||||
| Overall | 83 | 86 | 91 | 98 | 107 | 122 | 144 | 105 | 97 |
| Age | |||||||||
| 18–39 | 80 | 84 | 88 | 94 | 100 | 107 | 115 | 98 | 95 |
| 40–59 | 84 | 88 | 93 | 99 | 107 | 121 | 145 | 107* | 98 |
| ≥60 | 86 | 90 | 96 | 105 | 119 | 144 | 169 | 114* | 102 |
| Race-ethnicity | |||||||||
| Non-Hispanic white | 83 | 86 | 92 | 98 | 107 | 122 | 139 | 104 | 96 |
| Non-Hispanic black | 81 | 84 | 90 | 97 | 105 | 128 | 158 | 106 | 95 |
| Mexican-American | 84 | 87 | 93 | 99 | 109 | 131 | 174 | 110* | 98 |
| Sex | |||||||||
| Men | 85 | 89 | 94 | 100 | 109 | 125 | 149 | 108 | 99 |
| Women | 81 | 84 | 89 | 96 | 104 | 120 | 141 | 102* | 95 |
| 2-hour plasma glucose, N=5850 | |||||||||
| Overall | 62 | 70 | 85 | 105 | 133 | 173 | 206 | 116 | 96 |
| Age | |||||||||
| 18–39 | 58 | 65 | 78 | 94 | 113 | 136 | 157 | 100 | 90 |
| 40–59 | 63 | 71 | 86 | 107 | 133 | 170 | 197 | 117* | 100 |
| ≥60 | 74 | 84 | 105 | 132 | 171 | 220 | 256 | 144* | 119 |
| Race-ethnicity | |||||||||
| Non-Hispanic white | 61 | 70 | 84 | 106 | 134 | 177 | 210 | 117 | 96 |
| Non-Hispanic black | 65 | 72 | 84 | 102 | 124 | 153 | 181 | 110* | 96 |
| Mexican-American | 63 | 73 | 87 | 107 | 135 | 176 | 214 | 120 | 100 |
| Sex | |||||||||
| Men | 59 | 68 | 84 | 104 | 131 | 170 | 205 | 115 | 95 |
| Women | 64 | 72 | 85 | 107 | 134 | 176 | 206 | 117 | 97 |
| A1C, N=16209 | |||||||||
| Overall | 4.7 (28) | 4.8 (29) | 5.1 (32) | 5.4 (36) | 5.7 (39) | 6.1 (43) | 6.8 (51) | 5.6 (38) | 5.3 (34) |
| Age | |||||||||
| 18–39 | 4.6 (27) | 4.7 (28) | 4.9 (30) | 5.1 (32) | 5.4 (36) | 5.6 (38) | 5.8 (40) | 5.3 (34) | 5.2 (33) |
| 40–59 | 4.8 (29) | 4.9 (30) | 5.2 (33) | 5.4 (36) | 5.7 (39) | 6.2 (44) | 7.0 (53) | 5.6 (38)* | 5.4 (36) |
| ≥60 | 5.0 (31) | 5.1 (32) | 5.4 (36) | 5.6 (38) | 6.0 (42) | 6.8 (51) | 7.5 (58) | 5.9 (41)* | 5.6 (38) |
| Race-ethnicity | |||||||||
| Non-Hispanic white | 4.7 (28) | 4.8 (29) | 5.1 (32) | 5.3 (34) | 5.6 (38) | 6.0 (42) | 6.6 (49) | 5.5 (37) | 5.3 (34) |
| Non-Hispanic black | 4.7 (28) | 4.9 (30) | 5.2 (33) | 5.5 (37) | 5.9 (41) | 6.5 (48) | 7.6 (60) | 5.8 (40)* | 5.5 (37) |
| Mexican-American | 4.7 (28) | 4.9 (30) | 5.1 (32) | 5.4 (36) | 5.7 (39) | 6.3 (45) | 7.6 (60) | 5.7 (39)* | 5.3 (34) |
| Sex | |||||||||
| Men | 4.7 (28) | 4.8 (29) | 5.1 (32) | 5.4 (36) | 5.7 (39) | 6.1 (43) | 7.0 (53) | 5.6 (38) | 5.3 (34) |
| Women | 4.7 (28) | 4.9 (30) | 5.1 (32) | 5.3 (34) | 5.7 (39) | 6.1 (43) | 6.7 (50) | 5.5 (37)* | 5.3 (34) |
A1c is presented in % (mmol/mol)
p-value<0.05 compared to first category (i.e., 18–39 years, non-Hispanic white, or men)
Table 2.
Cumulative odds ratios (95% confidence intervals) of fasting plasma glucose, 2-hour plasma glucose, or A1C decile associated with age, race-ethnicity, and sex
| Unadjusted | Adjusted for age, race-ethnicity, and sex | Adjusted for age, race- ethnicity, sex, and BMI | Adjusted for age, race-ethnicity, sex, BMI, and height | |
|---|---|---|---|---|
| Fasting plasma glucose, N=7250 | ||||
| Age | ||||
| 18–39 | 1.00 | 1.00 | 1.00 | 1.00 |
| 40–59 | 2.59 (2.16–3.10) | 2.82 (2.40–3.31) | 2.61 (2.20–3.09) | 2.61 (2.20–3.09) |
| ≥60 | 5.60 (4.80–6.54) | 6.56 (5.52–7.80) | 6.52 (5.47–7.78) | 6.48 (5.41–7.76) |
| Race-ethnicity | ||||
| Non-Hispanic white | 1.00 | 1.00 | 1.00 | 1.00 |
| Non-Hispanic black | 0.84 (0.66–1.07) | 1.06 (0.89–1.27) | 0.86 (0.71–1.05) | 0.86 (0.71–1.04) |
| Mexican-American | 1.28 (1.02–1.61) | 1.80 (1.48–2.18) | 1.72 (1.43–2.08) | 1.70 (1.40–2.07) |
| Sex | ||||
| Men | 1.00 | 1.00 | 1.00 | 1.00 |
| Women | 0.52 (0.47–0.58) | 0.44 (0.39–0.50) | 0.43 (0.37–0.49) | 0.41 (0.34–0.51) |
| 2-hour plasma glucose, N=5850 | ||||
| Age | ||||
| 18–39 | 1.00 | 1.00 | 1.00 | 1.00 |
| 40–59 | 2.05 (1.79–2.35) | 2.05 (1.76–2.40) | 1.91 (1.64–2.23) | 1.88 (1.61–2.19) |
| ≥60 | 6.06 (4.96–7.40) | 6.36 (5.20–7.79) | 6.29 (5.17–7.66) | 5.66 (4.66–6.88) |
| Race-ethnicity | ||||
| Non-Hispanic white | 1.00 | 1.00 | 1.00 | 1.00 |
| Non-Hispanic black | 0.86 (0.74–1.01) | 1.05 (0.91–1.21) | 0.89 (0.76–1.04) | 0.87 (0.75–1.02) |
| Mexican-American | 1.13 (0.95–1.34) | 1.63 (1.37–1.94) | 1.55 (1.30–1.84) | 1.28 (1.07–1.54) |
| Sex | ||||
| Men | 1.00 | 1.00 | 1.00 | 1.00 |
| Women | 1.16 (1.04–1.3) | 1.10 (0.96–1.25) | 1.10 (0.97–1.25) | 0.75 (0.61–0.92) |
| A1C, N=16209 | ||||
| Age | ||||
| 18–39 | 1.00 | 1.00 | 1.00 | 1.00 |
| 40–59 | 3.50 (3.25–3.78) | 3.94 (3.62–4.29) | 3.72 (3.43–4.04) | 3.70 (3.41–4.02) |
| ≥60 | 8.89 (7.93–9.96) | 11.02 (9.86–12.31) | 10.91 (9.82–12.12) | 10.44 (9.35–1.66) |
| Race-ethnicity | ||||
| Non-Hispanic white | 1.00 | 1.00 | 1.00 | 1.00 |
| Non-Hispanic black | 1.93 (1.69–2.21) | 2.82 (2.48–3.20) | 2.49 (2.21–2.81) | 2.47 (2.19–2.78) |
| Mexican-American | 1.20 (1.02–1.41) | 2.01 (1.71–2.35) | 1.90 (1.63–2.21) | 1.74 (1.48–2.04) |
| Sex | ||||
| Men | 1.00 | 1.00 | 1.00 | 1.00 |
| Women | 0.98 (0.93–1.04) | 0.88 (0.82–0.94) | 0.89 (0.83–0.96) | 0.76 (0.67–0.85) |
Kernel density plots of fasting glucose, 2-hour glucose, and A1C stratified by race-ethnicity are presented in Figure 2. Compared to non-Hispanic whites, the distribution of fasting glucose for Mexican-Americans was shifted slightly higher while the distribution of A1C for non-Hispanic blacks was shifted higher. Compared to non-Hispanic blacks, the distributions of fasting glucose and 2-hour glucose for Mexican-Americans were shifted higher and the distribution of A1C for Mexican-Americans was shifted lower. For non-Hispanic whites, non-Hispanic blacks, and Mexican-Americans, the median fasting glucose was 98, 97, and 99 mg/dL, respectively; the median 2-hour glucose was 106, 102, and 107 mg/dL, respectively; the median A1C was 5.3, 5.5, and 5.4% (34, 37, and 36 mmol/mol), respectively (Table 1). Modes of the distributions for these respective race-ethnicities were 96, 95, and 98 mg/dL for fasting plasma glucose; 96, 96, and 100 mg/dL for 2-hour plasma glucose; 5.3, 5.5, and 5.3% (34, 37, and 34 mmol/mol) for A1C. Compared to non-Hispanic whites, non-Hispanic blacks had similar cumulative odds of being in higher deciles of fasting and 2-hour plasma glucose; however, non-Hispanic blacks had higher cumulative odds of being in higher deciles of A1C (p<0.001) in unadjusted and age, sex, BMI, and height adjusted models (Table 2). Compared to non-Hispanic whites, Mexican-Americans had higher cumulative odds of being in higher deciles of fasting glucose, 2-hour glucose, and A1C (each p<0.05) in unadjusted and age, sex, BMI, and height adjusted models (except for unadjusted 2-hour glucose [p=0.18]). Compared to non-Hispanic blacks, Mexican-Americans had higher cumulative odds of being in higher deciles of fasting glucose and 2-hour glucose (each p<0.01) and lower cumulative odds of being in higher deciles of A1C (p<0.001) in unadjusted and age, sex, BMI, and height adjusted models.
Kernel density plots stratified by sex showed the fasting glucose distribution was shifted higher for men, the 2-hour glucose distribution was shifted higher for women, and A1C distributions were nearly identical (Figure 2). For men and women, the median fasting glucose was 100 and 96 mg/dL, respectively; the median 2-hour glucose was 104 and 107 mg/dL, respectively; the median A1C was 5.4 and 5.3% (36 and 34 mmol/mol), respectively (Table 1). Modes of the distributions for men and women were 99 and 95 mg/dL, respectively, for fasting plasma glucose; 95 and 97 mg/dL, respectively, for 2-hour plasma glucose; both 5.3% (34 mmol/mol) for A1C. Compared to men, women had lower cumulative odds of being in higher deciles of fasting glucose (p<0.001) and higher cumulative odds of being in higher deciles of 2-hour glucose (p=0.01) in unadjusted models (Table 2). After adjustment for age, race-ethnicity, and BMI, women had lower cumulative odds of being in higher deciles of fasting glucose and A1C (each p<0.01), while differences in 2-hour glucose were no longer significant (p=0.14). After additional adjustment for height, women had lower cumulative odds of being in higher deciles of fasting glucose, 2-hour glucose, and A1C (each p<0.01).
Discussion
We characterized the distributions of fasting plasma glucose, 2-hour plasma glucose, and A1C in the 2005–2010 National Health and Nutrition Examination Survey, a nationally representative sample of the general non-institutionalized U.S. population. These results illustrate the differences in distributions between glucose biomarkers and their variation by age, race-ethnicity, and sex. The distributions of all biomarkers were shifted higher and more right skewed for older age groups. The shift in older ages was fluid affecting people throughout the entire distribution for each higher age group, and not merely reflecting a higher prevalence of diabetes in older age groups. Age was more strongly associated with A1C than fasting glucose or 2-hour glucose. Although previous studies have shown A1C levels increase with age, the effect of age on A1C is similar to the effect of age on average plasma glucose (based on 7 or 8 days of continuous glucose monitoring during a 12 week study) [31].
The distribution of A1C was shifted higher and more right skewed for non-Hispanic blacks, even after adjustment for age, sex, BMI, and height. This difference may due to more than just a difference in prevalence of diabetes since even the low side of the A1C distribution differs between non-Hispanic blacks and other race-ethnicities. The distributions of all three biomarkers were shifted slightly higher for Mexican-Americans compared to other race-ethnic groups (except A1C compared to non-Hispanic blacks), and the differences substantially increased after adjusting for age in regression models. The differences in A1C by race-ethnicity are consistent with previous studies that found mean concentrations differed by race-ethnicity, even at the same blood glucose levels [7–9, 13, 15, 32]. It is not clear why these differences exist, but there are several possibilities including genetics [33, 34], erythrocyte lifespan [35], and rate of hemoglobin glycation [36]. Despite the differences in A1C levels, race-ethnicity did not modify the association between A1C and cardiovascular outcomes and death in a previous study; the hazard ratios of coronary heart disease, ischemic stroke, and death associated with higher levels of A1C were similar for white and black participants [37].
The distribution of fasting glucose was shifted higher for men while a difference by sex for 2-hour glucose and A1C depended on which covariates were adjusted in the model. Several previous studies found men have higher levels of fasting glucose while women have higher levels of 2-hour glucose [18, 30, 38, 39]. Our study is consistent with previous studies [18, 30] that found differences in fasting glucose were not due to confounding by age or adiposity. A physiologic cause is possible, but the mechanism for the difference by sex has not been elucidated. Higher unadjusted 2-hour glucose in women may be due to women receiving the same amount of glucose during oral-glucose tolerance tests despite having, on average, less fat-free mass and consequently less metabolically active tissue [18]. The 2005–2010 NHANES did not measure fat-free mass. When we adjusted for height as a proxy for fat-free mass in cumulative logistic regression models, men had higher 2-hour glucose levels than women, which is consistent with previous studies [18, 30]. Although we considered height a proxy for fat-free mass, it may affect 2-hour glucose levels through another unknown mechanism. Iron deficiency results in higher A1C levels independent of plasma glucose levels [40] and since it is more common among women [41], it may cause a relatively more right skewed distribution of A1C for women.
We found the distributions of fasting glucose, 2-hour glucose, and A1C to be unimodal, a finding that persisted even after varying the smoothing bandwidth. However, previous studies characterizing these distributions have found they follow bimodal distributions [21, 22] in populations that have a high prevalence of diabetes. In comparison, the NHANES participants in our study were representative of the non-institutionalized US population (except 2-hour plasma glucose analyses excluded people taking insulin or oral diabetes medication) and relatively healthy, which resulted in no noticeable second peak in the distribution.
Rather than test for differences in mean levels by demographics, we used cumulative logistic regression on deciles of glucose biomarkers to test for differences across the entire distribution while taking into account the complex sampling design used in NHANES. While this method may identify differences in the distribution beyond differences in mean, it is likely to not be very sensitive to certain differences, particularly differences in kurtoses in otherwise similar distributions. Another potential limitation is NHANES did not collect information on hemoglobinopathies or thalassemias, which may affect measurement of A1C. Despite these limitations, our study has a number of strengths. We used kernel density estimation to create smooth plots of the distributions of fasting plasma glucose, 2-hour plasma glucose, and A1C. These distributions are derived from NHANES data and these data, including the analytic populations for all three biomarkers we investigated, are designed to be representative of the US noninstitutionalized civilian population. Also, NHANES data were collected using a rigorous study protocol with extensive quality control procedures including technicians trained and certified in data collection procedures.
To look at the potential clinical impact of these observed associations, we provide a visual reference for comparing distributions of glucose biomarkers and cutpoints for prediabetes and diabetes by age, race-ethnicity, and sex. Longitudinal data are needed to determine if these differences have any clinical difference in terms of progression to diabetes. Distribution variation may be particularly important for diagnosing prediabetes since the modes of the distributions are relatively close to the prediabetes cutpoints whereby even relatively small differences may have a substantial impact on the number of people defined as having prediabetes. Variable cutpoints have been used in definitions of other diseases, such as the World Health Organization definition of metabolic syndrome which varies by sex and race-ethnicity [42]. However, many factors need to be considered in an evaluation of cutpoints used to define diabetes and prediabetes. Our data should be used in conjunction with other studies comparing progression of diabetes and long-term complications when evaluating whether cutpoints should differ by age, race-ethnicity, and sex. The differences in glucose biomarker distributions by age, race-ethnicity, and sex may highlight the importance of considering which biomarker is used when comparing diabetes prevalence among groups with different demographic profiles.
Acknowledgments
The findings and conclusions in this report are those of the authors and do not necessarily represent the official position of the National Institute of Diabetes and Digestive and Kidney Diseases.
This work was supported by a contract from the National Institute of Diabetes and Digestive and Kidney Diseases (GS10F0381L).
No potential conflicts of interest relevant to this article were reported.
The authors thank Danita Byrd-Clark (Social & Scientific Systems, Inc.) for assistance with programming.
Abbreviations
- A1C
hemoglobin A1c
- BMI
body mass index
- NHANES
National Health and Nutrition Examination Survey
- OGTT
oral glucose tolerance test
Footnotes
Publisher's Disclaimer: This is a PDF file of an unedited manuscript that has been accepted for publication. As a service to our customers we are providing this early version of the manuscript. The manuscript will undergo copyediting, typesetting, and review of the resulting proof before it is published in its final citable form. Please note that during the production process errors may be discovered which could affect the content, and all legal disclaimers that apply to the journal pertain.
References
- 1.Karve A, Hayward RA. Prevalence, diagnosis, and treatment of impaired fasting glucose and impaired glucose tolerance in nondiabetic U.S. adults. Diabetes Care. 2010;33(11):2355–9. doi: 10.2337/dc09-1957. [DOI] [PMC free article] [PubMed] [Google Scholar]
- 2.Meigs JB, Nathan DM, Cupples LA, Wilson PW, Singer DE. Tracking of glycated hemoglobin in the original cohort of the Framingham Heart Study. J Clin Epidemiol. 1996;49(4):411–7. doi: 10.1016/0895-4356(95)00513-7. [DOI] [PubMed] [Google Scholar]
- 3.Pani LN, Korenda L, Meigs JB, Driver C, Chamany S, Fox CS, et al. Effect of aging on A1C levels in individuals without diabetes: evidence from the Framingham Offspring Study and the National Health and Nutrition Examination Survey 2001–2004. Diabetes Care. 2008;31(10):1991–6. doi: 10.2337/dc08-0577. [DOI] [PMC free article] [PubMed] [Google Scholar]
- 4.Rhee MK, Ziemer DC, Kolm P, Phillips LS. Postchallenge glucose rises with increasing age even when glucose tolerance is normal. Diabet Med. 2006;23(11):1174–9. doi: 10.1111/j.1464-5491.2006.01956.x. [DOI] [PubMed] [Google Scholar]
- 5.Selvin E, Coresh J, Zhu H, Folsom A, Steffes MW. Measurement of HbA1c from stored whole blood samples in the Atherosclerosis Risk in Communities study. J Diabetes. 2010;2(2):118–24. doi: 10.1111/j.1753-0407.2010.00070.x. [DOI] [PMC free article] [PubMed] [Google Scholar]
- 6.Yashin AI, Ukraintseva SV, Arbeev KG, Akushevich I, Arbeeva LS, Kulminski AM. Maintaining physiological state for exceptional survival: What is the normal level of blood glucose and does it change with age? Mech Ageing Dev. 2009;130(9):611–8. doi: 10.1016/j.mad.2009.07.004. [DOI] [PMC free article] [PubMed] [Google Scholar]
- 7.Ziemer DC, Kolm P, Weintraub WS, Vaccarino V, Rhee MK, Twombly JG, et al. Glucose-independent, black-white differences in hemoglobin A1c levels: a cross-sectional analysis of 2 studies. Ann Intern Med. 2010;152(12):770–7. doi: 10.7326/0003-4819-152-12-201006150-00004. [DOI] [PubMed] [Google Scholar]
- 8.Herman WH, Ma Y, Uwaifo G, Haffner S, Kahn SE, Horton ES, et al. Differences in A1C by race and ethnicity among patients with impaired glucose tolerance in the Diabetes Prevention Program. Diabetes Care. 2007;30(10):2453–7. doi: 10.2337/dc06-2003. [DOI] [PMC free article] [PubMed] [Google Scholar]
- 9.Kirk JK, D'Agostino RB, Jr, Bell RA, Passmore LV, Bonds DE, Karter AJ, et al. Disparities in HbA1c levels between African-American and non-Hispanic white adults with diabetes: a meta-analysis. Diabetes Care. 2006;29(9):2130–6. doi: 10.2337/dc05-1973. [DOI] [PMC free article] [PubMed] [Google Scholar]
- 10.Davidson MB, Schriger DL. Effect of age and race/ethnicity on HbA1c levels in people without known diabetes mellitus: implications for the diagnosis of diabetes. Diabetes Res Clin Pract. 2010;87(3):415–21. doi: 10.1016/j.diabres.2009.12.013. [DOI] [PubMed] [Google Scholar]
- 11.Kamps JL, Hempe JM, Chalew SA. Racial disparity in A1C independent of mean blood glucose in children with type 1 diabetes. Diabetes Care. 2010;33(5):1025–7. doi: 10.2337/dc09-1440. [DOI] [PMC free article] [PubMed] [Google Scholar]
- 12.Saaddine JB, Fagot-Campagna A, Rolka D, Narayan KM, Geiss L, Eberhardt M, et al. Distribution of HbA(1c) levels for children and young adults in the U.S: Third National Health and Nutrition Examination Survey. Diabetes Care. 2002;25(8):1326–30. doi: 10.2337/diacare.25.8.1326. [DOI] [PubMed] [Google Scholar]
- 13.Selvin E, Steffes MW, Ballantyne CM, Hoogeveen RC, Coresh J, Brancati FL. Racial differences in glycemic markers: a cross-sectional analysis of community-based data. Ann Intern Med. 2011;154(5):303–9. doi: 10.1059/0003-4819-154-5-201103010-00004. [DOI] [PMC free article] [PubMed] [Google Scholar]
- 14.Wisdom K, Fryzek JP, Havstad SL, Anderson RM, Dreiling MC, Tilley BC. Comparison of laboratory test frequency and test results between African-Americans and Caucasians with diabetes: opportunity for improvement. Findings from a large urban health maintenance organization. Diabetes Care. 1997;20(6):971–7. doi: 10.2337/diacare.20.6.971. [DOI] [PubMed] [Google Scholar]
- 15.Kirk JK, Passmore LV, Bell RA, Narayan KM, D'Agostino RB, Jr, Arcury TA, et al. Disparities in A1C levels between Hispanic and non-Hispanic white adults with diabetes: a meta-analysis. Diabetes Care. 2008;31(2):240–6. doi: 10.2337/dc07-0382. [DOI] [PubMed] [Google Scholar]
- 16.Herman WH, Dungan KM, Wolffenbuttel BH, Buse JB, Fahrbach JL, Jiang H, et al. Racial and ethnic differences in mean plasma glucose, hemoglobin A1c, and 1,5-anhydroglucitol in over 2000 patients with type 2 diabetes. J Clin Endocrinol Metab. 2009;94(5):1689–94. doi: 10.1210/jc.2008-1940. [DOI] [PubMed] [Google Scholar]
- 17.Carrera T, Bonamusa L, Almirall L, Navarro JM. Should age and sex be taken into account in the determination of HbA1c reference range? Diabetes Care. 1998;21(12):2193–4. doi: 10.2337/diacare.21.12.2193. [DOI] [PubMed] [Google Scholar]
- 18.Sicree RA, Zimmet PZ, Dunstan DW, Cameron AJ, Welborn TA, Shaw JE. Differences in height explain gender differences in the response to the oral glucose tolerance test- the AusDiab study. Diabet Med. 2008;25(3):296–302. doi: 10.1111/j.1464-5491.2007.02362.x. [DOI] [PubMed] [Google Scholar]
- 19.Yang YC, Lu FH, Wu JS, Chang CJ. Age and sex effects on HbA1c. A study in a healthy Chinese population. Diabetes Care. 1997;20(6):988–91. doi: 10.2337/diacare.20.6.988. [DOI] [PubMed] [Google Scholar]
- 20.Fan J, May SJ, Zhou Y, Barrett-Connor E. Bimodality of 2-h plasma glucose distributions in whites: the Rancho Bernardo study. Diabetes Care. 2005;28(6):1451–6. doi: 10.2337/diacare.28.6.1451. [DOI] [PubMed] [Google Scholar]
- 21.Flock EV, Bennett PH, Savage PJ, Webner CJ, Howard BV, Rushforth NB, et al. Bimodality of glycosylated hemoglobin distribution in Pima Indians: relationship to fasting hyperglycemia. Diabetes. 1979;28(11):984–9. doi: 10.2337/diab.28.11.984. [DOI] [PubMed] [Google Scholar]
- 22.Rushforth NB, Bennett PH, Steinberg AG, Burch TA, Miller M. Diabetes in the Pima Indians. Evidence of bimodality in glucose tolerance distributions. Diabetes. 1971;20(11):756–65. doi: 10.2337/diab.20.11.756. [DOI] [PubMed] [Google Scholar]
- 23.Silverman BW. Density estimation for statistics and data analysis. London: Chapman and Hall; 1986. [Google Scholar]
- 24.Centers for Disease Control and Prevenetion (CDC). National Center for Health Statistics (NCHS) National Health and Nutrition Examination Survey Questionnaire. Hyattsvile, MD: U.S. Department of Health and Human Services, Centers for Disease Control and Prevention; 2012. http://www.cdc.gov/nchs/nhanes/nhanes_questionnaires.htm. [Google Scholar]
- 25.Little RR, Rohlfing CL, Tennill AL, Hanson SE, Connolly S, Higgins T, et al. Measurement of Hba(1C) in patients with chronic renal failure. Clin Chim Acta. 2013;418:73–6. doi: 10.1016/j.cca.2012.12.022. [DOI] [PMC free article] [PubMed] [Google Scholar]
- 26.Lin CN, Emery TJ, Little RR, Hanson SE, Rohlfing CL, Jaisson S, et al. Effects of hemoglobin C, D, E, and S traits on measurements of HbA1c by six methods. Clin Chim Acta. 2012;413(7–8):819–21. doi: 10.1016/j.cca.2011.12.019. [DOI] [PMC free article] [PubMed] [Google Scholar]
- 27.Roberts WL, Safar-Pour S, De BK, Rohlfing CL, Weykamp CW, Little RR. Effects of hemoglobin C and S traits on glycohemoglobin measurements by eleven methods. Clin Chem. 2005;51(4):776–8. doi: 10.1373/clinchem.2004.047142. [DOI] [PubMed] [Google Scholar]
- 28.Rohlfing CL, Connolly SM, England JD, Hanson SE, Moellering CM, Bachelder JR, et al. The effect of elevated fetal hemoglobin on hemoglobin A1c results: five common hemoglobin A1c methods compared with the IFCC reference method. Am J Clin Pathol. 2008;129(5):811–4. doi: 10.1309/YFVTUD0GHJF7D16H. [DOI] [PubMed] [Google Scholar]
- 29.Heeringa SGWB, Berglund PA. Applied Survey Data Analysis. Boca Raton, FL: Chapman and Hall; 2010. [Google Scholar]
- 30.Faerch K, Borch-Johnsen K, Vaag A, Jorgensen T, Witte DR. Sex differences in glucose levels: a consequence of physiology or methodological convenience? The Inter99 study. Diabetologia. 2010;53(5):858–65. doi: 10.1007/s00125-010-1673-4. [DOI] [PubMed] [Google Scholar]
- 31.Alam T, Weintraub N, Weinreb J. What is the proper use of hemoglobin A1c monitoring in the elderly? J Am Med Dir Assoc. 2005;6(3):200–4. doi: 10.1016/j.jamda.2005.03.012. [DOI] [PubMed] [Google Scholar]
- 32.Nathan DM, Kuenen J, Borg R, Zheng H, Schoenfeld D, Heine RJ. Translating the A1C assay into estimated average glucose values. Diabetes Care. 2008;31(8):1473–8. doi: 10.2337/dc08-0545. [DOI] [PMC free article] [PubMed] [Google Scholar]
- 33.Cohen RM, Snieder H, Lindsell CJ, Beyan H, Hawa MI, Blinko S, et al. Evidence for independent heritability of the glycation gap (glycosylation gap) fraction of HbA1c in nondiabetic twins. Diabetes Care. 2006;29(8):1739–43. doi: 10.2337/dc06-0286. [DOI] [PubMed] [Google Scholar]
- 34.Snieder H, Sawtell PA, Ross L, Walker J, Spector TD, Leslie RD. HbA(1c) levels are genetically determined even in type 1 diabetes: evidence from healthy and diabetic twins. Diabetes. 2001;50(12):2858–63. doi: 10.2337/diabetes.50.12.2858. [DOI] [PubMed] [Google Scholar]
- 35.Sacks DB. A1C versus glucose testing: a comparison. Diabetes Care. 2011;34(2):518–23. doi: 10.2337/dc10-1546. [DOI] [PMC free article] [PubMed] [Google Scholar]
- 36.Hempe JM, Gomez R, McCarter RJ, Jr, Chalew SA. High and low hemoglobin glycation phenotypes in type 1 diabetes: a challenge for interpretation of glycemic control. J Diabetes Complications. 2002;16(5):313–20. doi: 10.1016/s1056-8727(01)00227-6. [DOI] [PubMed] [Google Scholar]
- 37.Selvin E, Steffes MW, Zhu H, Matsushita K, Wagenknecht L, Pankow J, et al. Glycated hemoglobin, diabetes, and cardiovascular risk in nondiabetic adults. N Engl J Med. 2010;362(9):800–11. doi: 10.1056/NEJMoa0908359. [DOI] [PMC free article] [PubMed] [Google Scholar]
- 38.Glumer C, Jorgensen T, Borch-Johnsen K. Prevalences of diabetes and impaired glucose regulation in a Danish population: the Inter99 study. Diabetes Care. 2003;26(8):2335–40. doi: 10.2337/diacare.26.8.2335. [DOI] [PubMed] [Google Scholar]
- 39.Williams JW, Zimmet PZ, Shaw JE, de Courten MP, Cameron AJ, Chitson P, et al. Gender differences in the prevalence of impaired fasting glycaemia and impaired glucose tolerance in Mauritius. Does sex matter? Diabet Med. 2003;20(11):915–20. doi: 10.1046/j.1464-5491.2003.01059.x. [DOI] [PubMed] [Google Scholar]
- 40.Coban E, Ozdogan M, Timuragaoglu A. Effect of iron deficiency anemia on the levels of hemoglobin A1c in nondiabetic patients. Acta Haematol. 2004;112(3):126–8. doi: 10.1159/000079722. [DOI] [PubMed] [Google Scholar]
- 41.Cook JD, Finch CA, Smith NJ. Evaluation of the iron status of a population. Blood. 1976;48(3):449–55. [PubMed] [Google Scholar]
- 42.Alberti KG, Eckel RH, Grundy SM, Zimmet PZ, Cleeman JI, Donato KA, et al. Harmonizing the metabolic syndrome: a joint interim statement of the International Diabetes Federation Task Force on Epidemiology and Prevention; National Heart, Lung, and Blood Institute; American Heart Association; World Heart Federation; International Atherosclerosis Society; and International Association for the Study of Obesity. Circulation. 2009;120(16):1640–5. doi: 10.1161/CIRCULATIONAHA.109.192644. [DOI] [PubMed] [Google Scholar]