Abstract
Many of the cell's macromolecular machines contain multiple components that transiently associate with one another. This compositional and dynamic complexity presents a challenge for understanding how these machines are constructed and function. Colocalization single molecule spectroscopy enables simultaneous observation of individual components of these machines in real-time and grants a unique window into processes that are typically obscured in ensemble assays. Colocalization experiments can yield valuable information about assembly pathways, compositional heterogeneity, and kinetics that together contribute to the development of richly detailed reaction mechanisms. This review focuses on recent advances in colocalization single molecule spectroscopy and how this technique has been applied to enhance our understanding of transcription, RNA splicing, and translation.
1. Introduction
All life relies on cellular machines to carry out essential steps in gene expression, environmental response, cell division, and growth. Understanding the biochemistry behind how these machines function is essential for understanding cellular biology. Some of these machines are composed of just a handful of components while others such as the ribosome contain many dozens. As the number of components increase, biochemical assays can quickly become muddled by the simultaneous accumulation of many different species doing many different things. For example, in an experiment containing one protein and one RNA component there may be at least three species present: the RNA by itself, the protein by itself, and the RNA/protein complex. Any one of these individual species may obscure observation of the other two. When this scenario is amplified to machines containing dozens of components, it can quickly be appreciated how even the simplest experiment becomes convoluted. This observation is particularly true of ensemble assays that only reveal the averaged behavior of the species present. One way to circumvent this complication is to study each species individually using a single molecule approach.
In contrast with bulk biochemical assays, single molecule fluorescence methods provide unique insights by observation of individual complexes in real time as they progress along their own reaction pathways.1 With these methods, reaction heterogeneity can be directly assessed and studied as a feature of the system, rather than a complicating factor. Furthermore, the need for synchronizing multi-step reactions can be eliminated when studying single molecules. Individual reaction trajectories are studied and assembled into common patterns of behavior post-experiment. This enables many experiments where traditional methods for reaction synchronization (e.g., stopped-flow, rapid chemical quench) are either impractical or impossible due to system complexity.
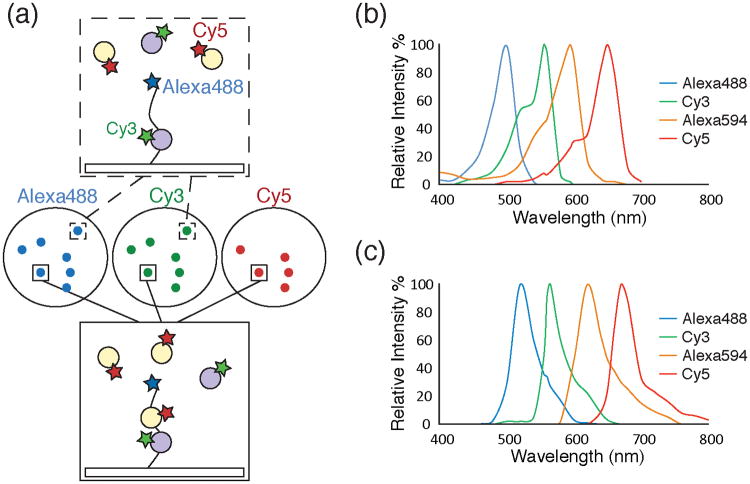
Colocalization single molecule fluorescence experiments employ real-time imaging of biomolecules conjugated to spectrally discernible fluorescent dyes. When a complex is formed, the biomolecules and their fluorescence emission colocalize to the same location (Figure 1a). Analysis of these microscopic images reveals both the identity and abundance of the components of a complex. While single molecule fluorescence resonance energy transfer (smFRET) and force experiments have been applied to studies of biomolecules for many years1,2,3, single molecule colocalization microscopy has only recently come to the forefront for studies of macromolecular machines.
Figure 1.
a) Schematic of a single molecule colocalization experiment. Images (center circles) can be acquired using three different excitation wavelengths (Alexa488™, 488nm, blue; Cy3, 532nm, green; Cy5, 633nm, red). The images show fluorescently labeled molecules as diffraction limited spots. A surface tethered molecule (top box) labeled with Alexa488™ interacting with a Cy3-labeled partner (grey circle, green star) will appear as colocalized spots in the blue and green images. Another surface tethered molecule (bottom box) interacting with both Cy3- and Cy5-labeled partners (the latter represented by orange circles with red stars) will appear as colocalized spots in the blue, green, and red images. b) A plot of excitation spectra for selected organic fluorophores useful for single molecule colocalization experiments.61 c) A plot of emission spectra for the same fluorophores as in 1b.61 The fluorophores depicted in 1b and 1c show well separated fluorescence excitation and emission spectra suitable for multi-wavelength colocalization experiments.
In this review, we focus on the fundamentals of colocalization microscopy and how this technique has been used to study the cellular machinery involved in gene expression: RNA polymerase, the spliceosome, and the ribosome. In the past few years, colocalization techniques have provided astounding new insights into these megaDalton-scale cellular machines. We spotlight how multi-component systems assemble to form functional enzymes and how colocalization methods supply new details into the pathways, kinetics, and conformational dynamics associated with these processes. Finally, we provide examples where colocalization methods in combination with other techniques have yielded novel insights into cellular machines that could not have been obtained by use of either method individually.
2. Fundamentals of Colocalization Microscopy
When carrying out a single molecule colocalization experiment, three common procedures are often followed. First, the biomolecules are derivitized with fluorophores that can be optically distinguished from one another. Second, a microscope is used that is capable of distinguishing between the fluorophores. Finally, single molecules are imaged and identified. In the following section, we briefly discuss common tactics for carrying out each of these three steps. The fundamental approaches described below have been used in many colocalization experiments and provide a starting foundation for discussing the experiments that follow on transcription, splicing, and translation.
2.1. Fluorophores for Colocalization Studies
Appropriate choice of fluorophores is critical for unambiguously identifying each component in a colocalization experiment. A number of fluorophores in the visible and infrared (IR) spectrum can be employed for single molecule assays. While in principle fluorescent proteins may be used, in practice, the increased photostability and photon output of organic fluorophores greatly facilitates observation of single molecules. The choice of fluorophore is coupled to the optical design of the colocalization microscope since a different laser may be necessary to excite each fluorophore and fluorophore emission may need to be monitored individually. Some widely used fluorophores for colocalization experiments are those excited by blue (488 nm, Alexa488™), green (532nm, Cy3), orange (594nm, Alexa594™), and red (633nm, Cy5) lasers (Figure 1b, c). These fluorophores can be excited using commercial solid state or gas lasers and their fluorescence can be distinguished using readily available dichroic mirrors and filters. Since each fluorophore in a colocalization experiment is often directly excited, the need for fluorophores that constitute efficient FRET pairs is eliminated. This also permits observation of large biomolecular assemblies where fluorophores may be separated by distances beyond the FRET detection limit. In addition to spectral properties, choosing the optimal fluorophores for a colocalization experiment often requires knowledge of the relative rates of fluorophore photobleaching and the timescale of the biological process being investigated. Some fluorophores (e.g., Cy5) can exhibit short lifetimes and may be better suited for studying either rapid processes or when used in combination with time-lapse imaging.
2.2. Microscopes for Colocalization Studies
Single fluorescent biomolecules are often observed using either confocal or total internal reflection fluorescence (TIRF) microscopy. These excitation schemes limit the excitation volume to facilitate detection of single fluorophores with great sensitivity, and both methods can be used for colocalization studies. Confocal methods, particularly when combined with an alternating laser excitation (ALEX) protocol4, can detect complexes in dilute (< 1 nM) solution that transiently pass through the excitation volume. TIRF microscopy, on the other hand, relies on imaging complexes tethered to a glass surface but permits tracking individual reaction trajectories over a range of time scales from milliseconds to hours. Herein we focus primarily on the application of TIRF for single molecule colocalization experiments. Specifics of confocal ALEX experiments and more general information on TIRF microscopy and surface-tethering of biomolecules can be found elsewhere.4,5
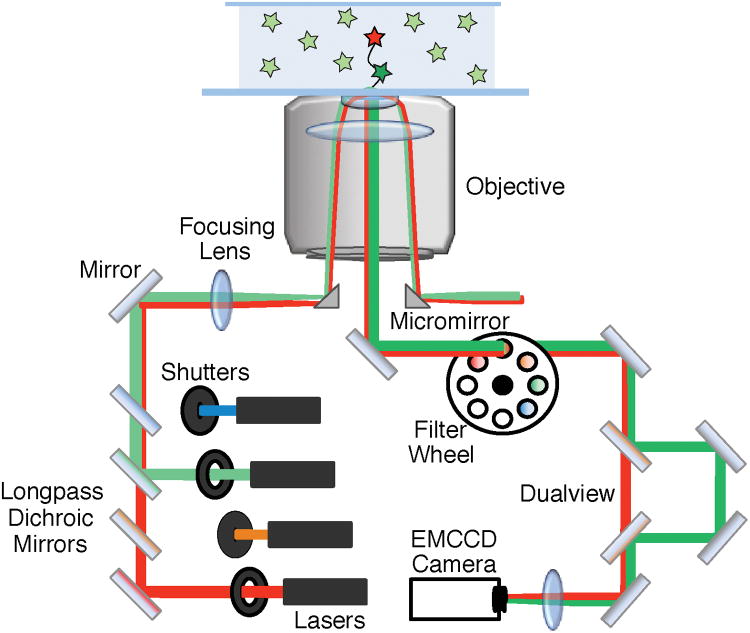
TIRF microscopes typically generate total internal reflection (TIR) by either focusing the excitation lasers into a quartz prism or through a high numerical aperture (NA) objective (Figure 2).5 For the latter method, both the excitation and emission light pass through the objective; consequently, the laser light must be removed from the fluorescence signal to avoid saturating the detector. On commercial microscopes, this is often achieved by isolating the fluorescence signal by passage through a series of filters and dichroic mirrors. As more lasers and fluorophores are included in the colocalization experiment, correspondingly more (or more sophisticated) optics are necessary. This increase in the number of optical components may result in fewer photons reaching the detector and reduced sensitivity. Recently, an alternative excitation scheme for objective-based TIR called micromirror TIRF (mmTIRF) has been developed that eliminates the need for these dichroic mirrors.6
Figure 2.
The basic components of an objective-based mmTIRF microscope. This diagram shows simultaneous excitation using both a red and green laser (red and green lines). The beams are combined using longpass dichroic mirrors and directed onto the back aperture of the objective using a micromirror. TIR occurs at the interface of the slide and the solution containing the fluorescent sample resulting in selective excitation of molecules near the surface. The excitation beam is directed out of the objective and away from the emission path using a second micromirror. The emission signal from the excited fluorophores (shown in the center of the objective) is directed to the EMCCD camera using a 45° mirror. Residual laser light can be removed using filters. In this diagram, emission signal from the green fluorophore is spatially separated from the red fluorophore emission using a dualview apparatus. The emission signals are focused onto an EMCCD camera – generating separate images for the green and red fluorophores.
mmTIRF uses two very small (< 3 mm) broadband mirrors at the base of the objective to direct the excitation into and out of the back aperture (Figure 2). Consequently, excitation and emission light remain spatially separated. mmTIRF eliminates the need for many of the wavelength selective optics in the excitation and emission pathways and results in high photon collection efficiency.6 Since broadband mirrors are used, multiple laser lines can simultaneously be focused into the objective without the need for additional dichroic mirrors.
After the fluorescence exits the mmTIRF objective, the emission signal is collected on an EMCCD camera. Since the fluorescence emission contains light from multiple fluorophores, it must be separated by wavelength in order to individually identify each fluorophore. This is routinely accomplished with a “dualview” apparatus (Figure 2) that uses dichroic mirrors to create two images (e.g., a short wavelength image < 635 nm and a long wavelength image > 635 nm) that are then projected onto the camera(s).7
2.3. Observation of Single Molecules
The most critical experimental parameter to consider in a single molecule colocalization experiment is verifying that single molecules are, in fact, being imaged. If the imaging surface is only sparsely decorated with tethered molecules, this results in a field of view containing discrete spots of fluorescence that are well separated from one another (Figure 1a). For colocalization experiments containing higher surface densities, the location of each molecule can be determined with very high precision by fitting each fluorescence spot to a 2D Gaussian and determining its center with subpixel (and sometimes subnanometer) accuracy.8,9 The presence of single molecules can also be validated with the observation of single-step photobleaching profiles. Key to all of these measurements is a high level of fluorophore incorporation to avoid populating the surface with “dark” molecules that can lead to spurious results.
3. Transcription Initiation
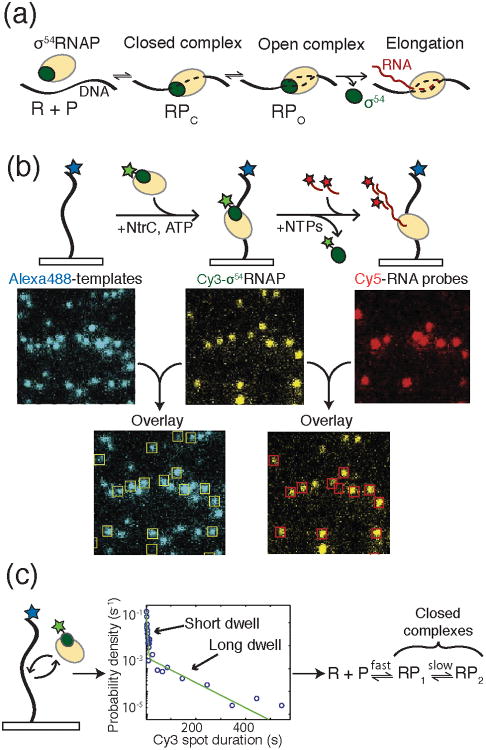
The transcription of genetic material into protein-coding mRNAs is a fundamental process in all life forms and is carried out by macromolecular machines called RNA polymerases (RNAPs). Without question, initiation of transcription is also one of the most highly regulated processes in the cell since expression of a single gene can dramatically alter cellular fate.10 Initiation has long been known to proceed through a series of reaction intermediates (Figure 3a). First, RNAP and transcription factors associate with promoter elements within the DNA. Since the DNA remains double stranded at this stage, this is referred to as a “closed” complex. Conformational changes then occur in which the DNA is melted and the single stranded template enters the RNAP active site forming “open” complex. Once RNA synthesis has initiated and RNAP escapes the promoter, the highly processive elongation complex is formed.11
Figure 3.
a) During bacterial transcription initiation, the RNAP holoenzyme first recognizes and binds to promoter DNA to form the closed complex (RPc). Upon DNA melting, open complex (RPo) is formed. Finally, RNAP escapes the promoter to form the elongation complex. b) Experimental setup for CoSMoS analysis of bacterial transcription initiation by Friedman and Gelles. DNA templates were immobilized on a glass surface and labeled with Alexa488™ (blue star). Binding of the σ54-RNAP holoenzyme to the template was monitored by colocalization of the DNA and Cy3-labeled σ54 (green star). Production of RNA was then detected by hybridization of Cy5-labeled DNA oligos and colocalization with the DNA templates and RNAP holoenzyme. c) In an experiment colocalizing RNAP holoenzyme with template DNA in the absence of the NtrC activator, two dwell times were detected following histogram analysis of σ54-RNAP spot duration. The data were consistent with the formation of two closed complexes being present in the initiation pathway. Images and data were reproduced in this figure from reference 13 and with permission from Elsevier.
While the general paradigm described above has been studied for decades, understanding the detailed kinetics of transcription initiation, even within the simplest bacterial promoters and operons, has proven to be a formidable challenge.12 Due to the number of components involved in transcription and the number of states those components can occupy, bulk initiation assays can quickly become convoluted. Yet, defining the kinetic features of initiation is essential for understanding how organisms respond to their environment, how genetic networks function, and how to rationally design synthetic gene circuits.13 Utilizing a mmTIRF microscope along with Colocalization Single Molecule Spectroscopy (CoSMoS), Friedman and Gelles have recently implemented colocalization assays to kinetically define the mechanism of transcription initiation at an activator-dependent σ54 bacterial promoter for the first time.13
In order to study transcription from the σ54 transcription factor-dependent glnALG operon promoter, Friedman and Gelles colocalized Alexa488™-labeled DNA templates with the E. coli RNAP holoenzyme containing both RNAP and Cy3-σ54 (Figure 3b). Like many eukaryotic promoters, transcription from glnALG was additionally dependent on the presence of an activator protein (NtrC) that hydrolyzes ATP to promote the closed→open transition. With all factors in place, addition of NTPs resulted in elongation, which was detected by the loss of Cy3-σ54 and the appearance of Cy5-labeled oligos annealing to the RNA product (Figure 3b). A key feature of this experimental design was the ability to distinguish productive initiation complexes that produced RNA transcripts from unproductive RNAP binding and dissociation events. This distinction is enormously difficult to carry out utilizing bulk assays. Using this system, Friedman and Gelles were able to vary the experimental conditions to additionally probe different stages of bacterial promoter recognition and transcription initiation by RNAP.
In the absence of NtrC and nucleotides, the RNAP/σ54 holoenzyme is only capable of forming a closed complex with the DNA template. By measuring the dwell times of RNAP/Cy3-σ54 holoenzyme spots that colocalized with DNA, Friedman and Gelles were able to describe the kinetics of closed complex formation (Figure 3c). Surprisingly, they observed two types of closed complex: a short-lived promoter-specific complex (τS = 2.3 s) and a stable long-lived complex (τL = 79 s) (Figure 3c). The short-lived complex proved to be a precursor to formation of the long-lived complex, which itself was a precursor for formation of open complex. These results are consistent with proposals based on footprinting data that an “early melted” DNA complex exists prior to open complex formation.14,15 In this scenario, the long-lived complex likely contains the “early-melted” DNA structure. Notably, the formation of both closed complexes was reversible.
By including all components necessary for transcription and simultaneously monitoring loss of Cy3-σ54 and the appearance of Cy5-labeled transcripts, Friedman and Gelles further showed that once open complexes were formed, they became kinetically stable and highly likely to produce transcripts. Dissociation of the open complex proved to be >1,000-fold slower than the conversion to elongation complex resulting in the high commitment of open complexes for RNA synthesis. Further, Cy3-σ54 was nearly always lost and did not remain bound to either the promoter or RNAP. Taken together with their data on closed complex formation, Friedman and Gelles provided a thermodynamic rationale for the requirement of the NtrC activator and ATP hydrolysis for transcription from a σ54 promoter and postulated that activators cannot easily modulate transcription after open complex formation given RNAP's high commitment towards elongation.
Transcription by human RNA polymerase II (Pol II) is more complicated than its bacterial counterparts requiring, for example, more than 45 separate proteins for de novo Pol II initiation.16 Using a highly purified in vitro transcription system containing Pol II and a host of transcription factors (TFIIA, TFIIB, TFIID, TFIIE, TFIIF, and TFIIH), Revyakin et al. have successfully recapitulated transcription initiation on surface tethered DNA templates and tracked RNA production with single molecule resolution.16 Developing this single molecule assay was in itself a remarkable accomplishment. Because of the inefficiency of in vitro human Pol II transcription (<0.1 transcript per DNA template per hour), the authors imaged a large number of molecules (1000-3000) and over a long time period (≥1 h) to obtain a significant number of transcription events. This was accomplished by observing thousands of templates simultaneously using a large 100 × 100 μm field of view, localizing each template with a precision of < 20 nm, and fabricating an active microscope stage stabilization system to compensate for sample drift. In order to successfully detect Pol II transcription, Revyakin and coworkers developed Cy3- and Cy5-labeled “floppy” probes devoid of appreciable secondary structure (Figure 4a, b). Only these rationally designed probes were capable of hybridizing to the nascent transcripts during the single molecule assay.
Figure 4.
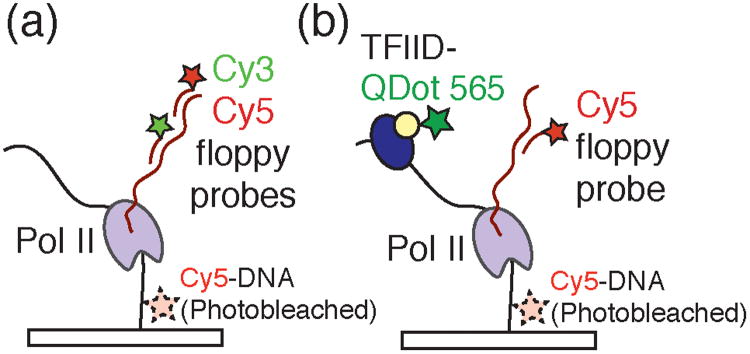
a) Experimental design employed by Revyakin et al. to detect single Pol II transcription complexes by colocalizing DNA template molecules with Cy3- and Cy5-labeled floppy probes complementary to the transcript. Immobilized Cy5-DNA templates were imaged, their locations determined, and photobleached prior to addition of the transcription assay components. b) To monitor both transcription and dynamics of the eukaryotic general transcription factors, Revyakin et al. labeled the multicomponent TFIID transcription factor with a quantum dot (QDot 565) and colocalized TFIID fluorescence with DNA templates and Cy5-labeled probes.
Previous studies have hinted at the presence of a general transcription factor scaffold that remains associated with DNA and poises the template for multiple rounds of transcription.17 By counting the number of polymerase re-initiation events on the same DNA molecule, Revyakin et al. directly showed that each round of transcription is independent and non-cooperative with previous events. These data are inconsistent with scaffold-promoted re-initation of transcription. The authors further employed quantum dot 565-labeled holo-TFIID (Q-IID) to study this general transcription factor's interactions with the DNA template during initiation. TFIID is itself an enormous macromolecular complex comprised of 17 polypeptides including the TATA-box binding protein. Association of Q-IID with immobilized DNA templates was monitored and correlated with the appearance of floppy probes bound to productive transcription complexes (Figure 4b). The authors noted a long wait time prior to the observation of Q-IID binding events (Twait = 1020 s), consistent with a model that promoter binding by Q-IID is a rate-limiting step in transcription initiation. Taken together with their studies of transcription re-initiation, this result implies that the human transcription machinery has not employed general transcription factor scaffolds to avoid rate-limiting steps in initiation. This work, combined with the studies by Friedman and Gelles, put single molecule colocalization methods at the forefront of techniques for providing mechanistic and kinetic insights into transcription initiation from bacteria to humans.
4. Spliceosome Catalyzed RNA Splicing
In eukaryotes, the direct products of transcription are often precursor mRNAs (pre-mRNAs) that must be extensively edited to produce functional mRNAs. In one series of editing steps, non-coding intronic sequences are excised and exonic sequences are ligated together by pre-mRNA splicing (Figure 5).18 Which sequences are kept in the mRNA and which are removed is governed by alternative splicing: a phenomenon that potentially results in multiple mRNA sequences being produced from a single gene.
Figure 5.
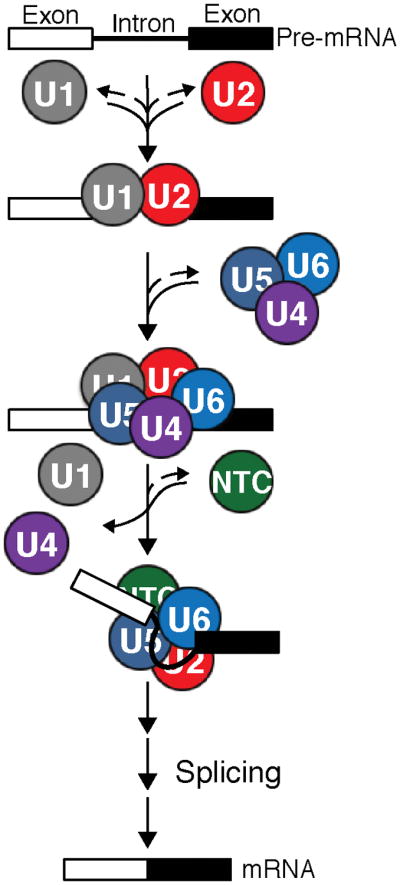
Pre-mRNAs contain introns (lines) that are removed by the spliceosome along with concomitant ligation of protein-coding exons (boxes) to produce mRNAs. The major subcomplexes of the spliceosome (the U1 and U2 snRNPs, the U4/U6.U5 tri-snRNP, and the protein-only NTC) assemble stepwise on each intron to carry out the splicing reaction with the help of a number of additional trans-acting factors (not shown).
Splicing is catalyzed by a multi-megaDalton machine consisting of five RNA-protein complexes called small nuclear ribonucleoproteins (snRNPs) and dozens of other protein factors.18 These components assemble into spliceosomes around each intron to be excised (Figure 5). Assembly begins with U1 and U2 snRNPs associating with the 5′ splice site (5′SS) and branch site (BS) of the pre-mRNA, respectively. This is then followed by addition of the U4/U6.U5 tri-snRNP and the protein-only nineteen complex (NTC) (Figure 5). Assembled spliceosomes subsequently proceed through various stages of activation and catalysis before the machinery is disassembled and the components are recycled. Throughout splicing, extensive conformational and compositional dynamics of the spliceosome result in accurate recognition of the splice sites and creation of the spliceosomal active site. Since it is not yet possible to reconstitute spliceosome assembly from purified components, many in vitro splicing assays are conducted in whole cell extracts (WCE) or by affinity purifying spliceosomes from WCE post-assembly.
The inability to efficiently reconstitute many of the spliceosomal subcomplexes from purified components represents a formidable challenge for studying spliceosome formation by single molecule fluorescence. To overcome this obstacle, Hoskins et al. combined chemical biology tools and genetic engineering to fluorescently label endogenous spliceosomal subcomplexes in yeast whole cell extract (WCE).19 Hoskins et al. genetically fused either SNAP20 or E. coli dihydrofolate reductase (eDHFR) tags21 (Figure 6a, b) to protein components of the S. cerevisiae spliceosome. The SNAP tag is a modified human DNA repair enzyme that can form covalent adducts with benzylguanine-fluorophores. eDHFR tags form tight complexes with fluorescently labeled trimethoprim (TMP) analogs.22 These protein tags were then specifically derivitized with fluorophores in WCE, thus creating fluorescent spliceosomes. Combined use of these orthogonal tags enabled simultaneous monitoring of two different spliceosomal subcomplex interactions with immobilized, fluorescent pre-mRNAs by CoSMoS (Figure 7a).
Figure 6.
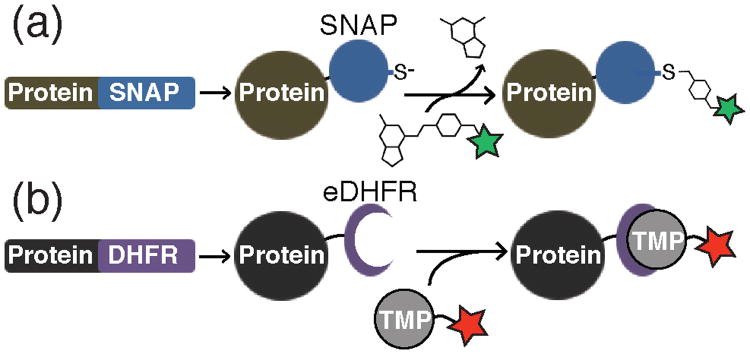
Preparation of fluorescent proteins by fusion to either the SNAP or eDHFR tags. a) Protein-SNAP fusions can be covalently labeled by reaction with benzylguanine dye conjugates. The fluorophore is transferred to an active site cysteine and guanine is released. b) Protein-eDHFR fusions can be non-covalently labeled by incubation with fluorescent derivatives of TMP to form a very tight enzyme-inhibitor complex.
Figure 7.
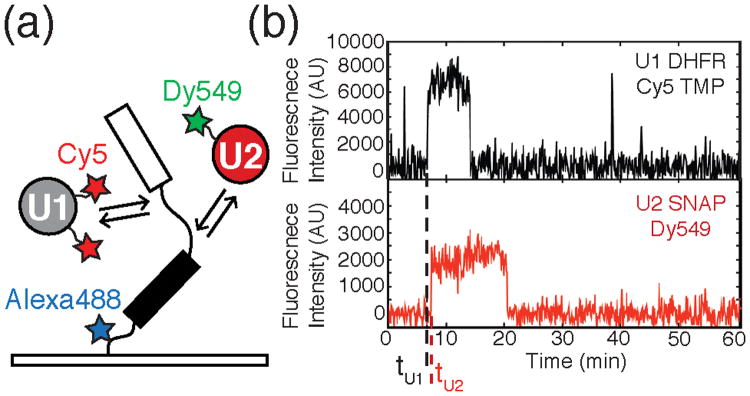
a) Schematic of a CoSMoS experiment designed to study spliceosome assembly. The experiment contains a pre-mRNA fluorescently labeled with Alexa488™ and tethered to a slide surface over which yeast WCE containing Cy5-DHFR-U1 and Dy549-SNAP-U2 is flowed. Spliceosomes then proceed to assemble on the substrate. b) Fluorescence intensity traces generated from the CoSMoS experiment described in 7a. High fluorescence intensity indicates the presence of the fluorescently labeled snRNP. The black and red traces represent the labeled U1 and U2 respectively. The dashed lines tU1 and tU2 mark times at which U1 and U2 associated with the pre-mRNA. This data would indicate that U1 binding precedes U2 association. Data reproduced in this figure from reference 19.
CoSMoS assays of spliceosome assembly on individual RP51A pre-mRNA molecules revealed the relative binding times (e.g., tU1 and tU2, Figure 7b) of each subcomplex.19 From these measurements, both the kinetics and order of addition of each subcomplex were determined. Data obtained from these experiments showed that assembly on RP51A occurs predominantly through the U1→U2→U4/U6.U5→NTC pathway and that pre-association of the five snRNPs cannot be required to form functional spliceosomes. Kinetic analysis of the CoSMoS data revealed that no single assembly step is rate limiting for the overall reaction. Interestingly, Hoskins et al. observed that association of each subcomplex is reversible. This implies that pre-mRNAs are not committed to splicing at early assembly steps, but rather the probability of mRNA formation increases with the arrival of each subcomplex. The ability for spliceosomes to disassociate at multiple stages during assembly hints that these steps could serve as potential points of regulation.
Along with revealing new insights into the behavior of spliceosomal subcomplexes during assembly, CoSMoS in combination with smFRET (FRET-CoSMoS) has been used to probe pre-mRNA conformational rearrangements during assembly. By site-specifically labeling RP51A pre-mRNA with a FRET acceptor (Cy5) near the 5′ SS and a FRET donor (Cy3) upstream of the BS, Crawford et al. monitored the proximity of the 5′ SS and BS as spliceosomes assembled (Figure 8a).23 Since spliceosome components were also labeled with Atto488 SNAP tag fluorophores, conformational changes could be directly correlated with the arrivals of specific subcomplexes (Figure 8a). The use of the dual-labeled pre-mRNA additionally allowed splicing events to be detected directly by monitoring for loss of the Cy3-labeled intron. Conformational changes occurring in catalytically active spliceosomes could, therefore, be segregated from those occurring in dead end complexes.
Figure 8.

a) For a FRET-CoSMoS experiment, Crawford et al. surface-tethered a pre-mRNA construct containing a FRET donor (Cy3) near the BS and a FRET acceptor (Cy5) near the 5′SS to report on pre-mRNA conformation. FRET efficiency was then correlated with the arrival or departure of labeled spliceosome subcomplexes (e.g., Atto488 labeled U1). b) Images showing the FRET efficiency (intensity of Cy5 signal) before and after the arrival of U1. Before U1 arrival (left) there is a strong fluorescent signal from the FRET acceptor (five images top left) and no signal from U1 (single image bottom left). After the arrival of U1 (single image, bottom right) there is a decrease in fluorescence intensity from the FRET acceptor. These results are consistent with the splice sites moving further apart when the pre-mRNA is occupied by U1. Images reproduced in this figure from reference 23 and with permission from the National Academy Sciences of the United States of America.
Crawford et al. observed that labeled pre-mRNAs in buffer displayed a range of FRET efficiencies (EFRET) consistent with many possible conformations. Upon incubation with yeast WCE, U1 binding was often accompanied by a shift towards lower EFRET values (< 0.2, Figure 8b)—potentially indicative of an increase in distance between the 5′ SS and BS.23 These low EFRET values persisted through association of both the U2 snRNP and U4/U6.U5 tri-snRNP. Only after association of the NTC, did splice site proximity substantially increase. Significantly, these changes followed NTC binding and were not concomitant with binding. This suggests that the splice sites are only brought closer to one another, potentially in a catalytically competent conformation, after spliceosome activation and after all major spliceosome components are present. This separation may be critical for preventing pre-mature cleavage of the transcript or for facilitating spliceosome disassembly prior to intron excision. Once the higher FRET state was reached, pre-mRNAs that ultimately spliced showed a substantial increase in FRET dynamics prior to intron loss. The real-time monitoring of both splice-site proximity and intron loss afforded by FRET-CoSMoS provides an alternative to bulk assays (e.g., crosslinking) that may irreversibly trap transient species and fail to distinguish between active spliceosomes and dead end complexes.
Colocalization techniques have also recently been applied to study human splicing factors. Unlike their yeast counterparts, the vast majority of human pre-mRNAs are alternatively spliced into different mRNAs.24 Alternative splicing is highly regulated by a number of splicing regulatory proteins including polypyrimidine-tract binding protein (PTB).25,26 PTB is essential for regulating the splicing of an array of transcripts in diverse human tissues27, and the mechanism(s) by which the regulation occurs remain a subject of intense investigation.
Key to understanding potential mechanisms of splicing repression by PTB is determining the stoichiometry of the pre-mRNA:PTB complex. However, like spliceosome assembly, PTB:pre-mRNA complexes are often studied in nuclear cell extracts (NCE) using proteins expressed at very low levels. To overcome this barrier, Cherny et al. used a single molecule colocalization assay to study complex formation between PTB fusions with green fluorescent protein (GFP) and Cy5-labeled RNAs containing exon 3 of the TPM1 pre-mRNA along with flanking intronic sequence.28 These complexes were assembled in NCE before affinity purification in situ on a microscope slide. Using both photobleaching and integrated intensity analysis, Cherny et al. showed that 5 or 6 molecules of PTB colocalized with the RNA. These data exclude models in which many PTB proteins coat long stretches (500 nt or more) of TPM1 to occlude splice sites and provide evidence for exon 3 repression occurring by formation of more complex structures.
In addition to exon repression, alternative splicing can also occur through selection of alternative splice sites by U1 or other subcomplexes within the same intronic sequence. Work by Hodson et al. used colocalization experiments to analyze 5′ SS selection in pre-mRNAs that contain multiple 5′ SS and determine if a single U1 could bind to multiple SS or if multiple U1s would bind a single pre-mRNA.29 Hodson et al. fused a GFP variant to the U1 snRNP protein U1A enabling colocalization of U1 with Cy5-labeled globin pre-mRNA. Similar to the experiments described above with PTB, Hodson et al. first incubated fluorescent, biotinylated globin pre-mRNAs containing variable numbers of 5′ SS with NCE containing fluorescent U1. This was then followed by in situ purification and colocalization analysis. By counting the number of U1s bound to each pre-mRNA, they were able to conclude that superfluous U1 snRNPs were ejected in the presence of ATP. Thus, ATP-dependent association of other factors onto the substrate may facilitate removing U1 snRNPs not destined for spliceosome assembly. While the mechanisms of how secondary U1 snRNPs are removed are still unknown, colocalization spectroscopy has yielded new insights into this process by providing detailed stoichiometric information that is typically inaccessible by other techniques.
5. Ribosomal Translation of mRNAs
Mature mRNAs are translated by the ribosome into proteins. The ribosome is a macromolecular complex composed of RNAs and proteins that must come together on mRNA to catalyze protein synthesis. Once the complex is assembled, aminoacylated tRNAs are then escorted to the ribosome, codon/anticodon interactions with the mRNA are formed, and amino acid transfer occurs to produce a nascent polypeptide.30 The ribosome has been the focus of many single molecule investigations31,32 and several steps in protein synthesis catalyzed by the E. coli ribosome have additionally been investigated by single molecule colocalization techniques.
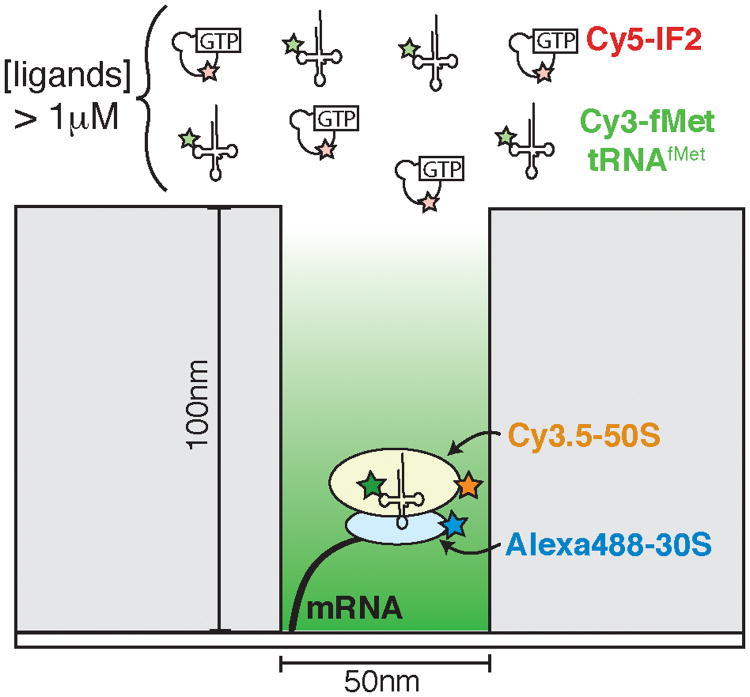
The cellular abundance of the translation machinery is much higher than that of either RNAP or splicing factors.33,34 Efficient translation has evolved to require μM or higher concentrations of tRNAs, initiation factors and elongation factors. This is well beyond the limit for discerning surface-tethered fluorophores above background fluorescence by conventional TIRF microscopy. As an alternative approach, Puglisi and coworkers have pioneered the use of zero mode waveguides (ZMWs) in combination with colocalization techniques to investigate translation. As illustrated in Figure 9, ZMWs are microfabricated, metallic structures deposited on optically transparent substrates.35 The structures contain small chambers with diameters (50-200 nm) smaller than the wavelengths of light typically used to excite fluorophores in a single molecule experiment. These small reaction chambers optically confine the observation volume to a few zeptoliters (10−21 l). This greatly reduces background fluorescence and permits the use of much higher concentrations of fluorescent molecules. Most importantly, this small volume permits single molecule experiments to be carried out at physiologically relevant concentrations of biomolecules and ligands.
Figure 9.
A cartoon depiction of a zero mode waveguide (ZMW) being used to study bacterial translation initiation. Each waveguide represents a nanometer-scale reaction chamber and many thousands of ZMWs can be imaged simultaneously. The dimensions of the waveguide result in a great reduction in background fluorescence. Fluorescently labeled components (here, Cy3-fMet-tRNAfMet and Cy5-IF2) can be added in solution to near physiological concentrations without obstructing observation, thus enabling the study of translation at the single molecule level.
Similar to spliceosomes, ribosomes are also assembled from individual subcomplexes on their substrates in a process involving a number of discrete steps and regulated by many different factors.36 While the components and kinetics of translation initiation have been well studied using a variety of methods,37,38 many important questions remain unresolved concerning assembly order and coordination between initiation factors. To address these issues, Tsai et al. assayed the timing of different factors arriving and dissociating during translation initiation using single molecule colocalization in ZMWs.39
In experiments containing Cy3-labeled fMet-tRNAfMet, Cy5-labeled initiation factor 2 (IF2), Alexa488™-labeled 30S ribosomal subunits, and Cy3.5-labeled 50S subunits, Tsai et al. were able to determine the binding order between IF2 and fMet-tRNAfMet to the 30S subunit (Figure 10a, b).39 In the most frequently observed pathway (Figure 10b, c), IF2 and initiator tRNA bound simultaneously within the time resolution of the experiment to form the 30S pre-initiation complex (PIC). Similar to the FRET-CoSMoS studies of spliceosome assembly that utilized intron loss as a metric to identify functional spliceosomes, binding of the 50S subunit was used to identify formation of functional PICs. By combining data from many single molecules, Tsai et al. concluded that PIC assembly proceeded through heterogeneous pathways that were highly tunable depending on the concentration of each factor (Figure 10c).
Figure 10.
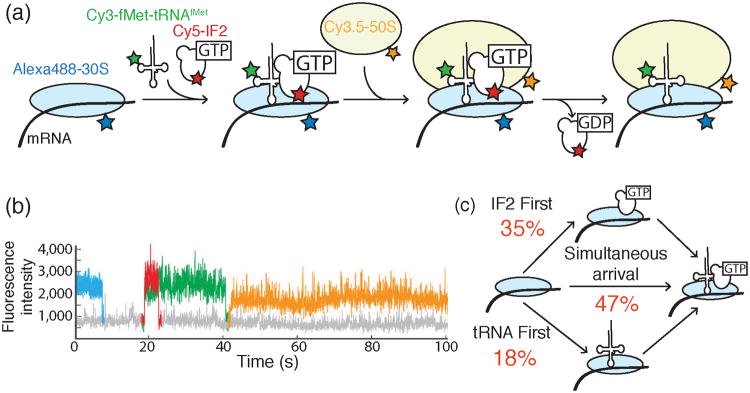
a) Design of a 4-color colocalization assay for studying bacterial translation initiation. Cy3-fMet-tRNAfMet (green) and Cy5-labeled IF2 (red) associate with Alexa488™-labeled 30S subunits (blue) bound to mRNA. Subsequently, the Cy3.5-labeled 50S subunit (orange) joins to form a catalytically competent ribosome. b) Representative fluorescence intensity traces indicating the timing of the arrival and departure of each fluorescently labeled component illustrated in part (a) and using the same color scheme. Here, IF2 and fMet-tRNAfMet bind to the 30S-mRNA complex simultaneously to form the 30S PIC. Appearance of the Cy3.5-50S subunit was used to discern correctly assembled PICs from dead end complexes. c) Gathering data from many initiation events revealed that productive PICs can form either by IF2 first, tRNA first, or IF2/tRNA coincident binding pathways. The fractions of PICs formed from each pathway are shown in red. Images and data were reproduced in this figure from reference 39 and with permission from Nature Publishing Group.
Tsai et al. additionally discovered that IF2 departure from the assembled 70S complex provided an essential switch from initiation to translation elongation.39 In experiments that colocalized Cy3-fMet-tRNAfMet loaded onto the 30S PIC, Cy3.5-50S subunits, Cy5-IF2, and Cy2-tRNAPhe (the cognate tRNA for the second codon of the mRNA), a lag phase between presumptive GTP hydrolysis by IF2 and stable tRNAPhe association was observed. Stabilizing IF2 binding by the addition of a non-hydrolyzable nucleotide analog, GDPNP, resulted in transient binding of tRNAPhe. This indicates that the tRNA may sample the initiation complex prior to elongation but cannot stably associate. Thus, both IF2 and GTP hydrolysis act as essential “guides” for elongation-competent ribosome formation.
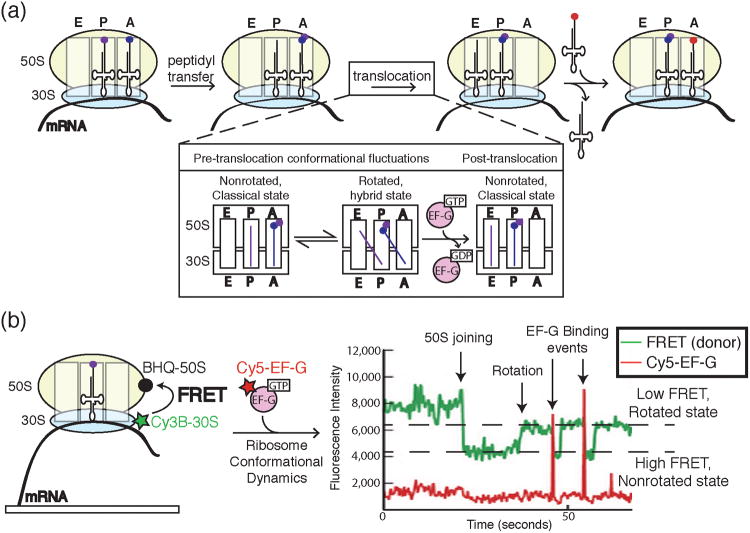
In the elongating ribosome, tRNAs are transferred between three binding sites: the A, P and E sites.30 Elongation occurs by binding of aminoacylated tRNAs to the ribosomal A site followed by peptidyl transfer from the tRNA located in the P site. tRNAs are then translocated as the ribosome moves forward one codon such that the P site tRNA now occupies the E site prior to ejection and the A site tRNA harboring the nascent polypeptide is transferred to the P site (Figure 11a). Utilizing ZMWs and colocalization methods, Uemura et al. were able to watch individual tRNAs move within the ribosome in real time by colocalizing different fluorescently labeled tRNAs with an immobilized mRNA in complex with a 70S ribosome.40 These experiments probed how ejection of the E site tRNA was coupled to arrival of the A site aminoacyl tRNA. Uemura et al. almost never observed ribosomes that simultaneously contained three tRNA molecules. In fact, no correlation between arrivals of tRNAs at the A site and tRNA departures at the E site could be found. Thus, tRNAs are rapidly dissociated from the E site independent on the arrival of a tRNA to the A site.
Figure 11.
a) A cartoon representation of key steps in peptide bond formation by the ribosome and translocation along mRNA. The ribosome contains three sites for tRNA binding: the A, P, and E sites. Following peptidyl transfer, the ribosomal subunits undergo conformational dynamics between rotated and non-rotated states. EF-G binding and hydrolysis of GTP leads to successful translocation of the ribosome along the mRNA and concomitant transfer of the P and A site tRNAs to the E and P sites, respectively. The aminoacylated tRNA cognate to the next codon is now free to enter the empty A site. b) Chen et al. correlated ribosome conformation and Cy5-labeled EF-G binding by combining FRET with colocalization assays in ZMWs. Ribosomes were labeled with a FRET donor (Cy3B) in the 30S subunit and FRET quencher (BHQ) in the 50S subunit. Close proximity of Cy3B and BHQ in the nonrotated state caused a decrease in Cy3B signal and an increase in FRET to the quencher. Rotation of the ribosome resulted in decreased FRET and an increase in Cy3B signal. Single molecule data showed ribosomes fluctuating between rotated and nonrotated states with EF-G preferentially binding the rotated state. Images and data were reproduced in this figure from reference 45 and with permission from Nature Publishing Group.
In addition to tRNA movement during translation, the ribosome itself undergoes significant conformational rearrangements during each round of peptidyl transfer. During elongation, the ribosome undergoes a rotation of the small subunit relative to the large subunit known as a “ratcheting”.41,42,43,44 This ratcheting motion is essential for formation of the hybrid tRNA state that leads ultimately to translocation (Figure 11a). Again using ZMWs, Chen et al. followed ribosome conformational changes during translocation using a single molecule colocalization approach.45 In this particular experimental design, ribosome ratcheting was detected by monitoring fluorescence signals from Cy3B-labeled 30S subunits bound to 50S subunits containing a nonfluorescent FRET acceptor (i.e., a quencher, Figure 11b). In the non-rotated state, the Cy3B and quencher were proximal leading to high FRET and a low Cy3B fluorescence signal. However, in the rotated state FRET was reduced leading to an increase in Cy3B fluorescence. Similar to the FRET-CoSMoS approach used to study spliceosome assembly, the fluorescence of Cy3B was then used to report on ribosome conformation as a function of colocalization with Cy5-labeled tRNA or elongation factor G (EF-G) (Figure 11b).
Colocalization of Cy5-EF-G with translating ribosomes indicated that EF-G binding precedes translocation, but does not necessarily induce translocation.45 EF-G departure was completely uncoupled from ribosomal ratcheting. Upon kinetic analysis of EF-G binding events, it appeared that binding of EF-G does not always result in GTP hydrolysis: only a subset of EF-G binding events lead to GTP hydrolysis and subsequent translocation. Further, the authors observed that EF-G arrives more quickly to and dissociates more slowly from the ratcheted ribosome state than to the classical state. In contrast, the tRNA-EF-Tu-GTP ternary complex preferentially binds the classical state. This segregation of ribosome binding states for elongation factors uncovered by Chen et al. helps to explain the conundrum of why EF-Tu ternary complexes and EF-G do not competitively inhibit each other during translation. In sum, this recent trio of manuscripts exemplifies the utility of combining nanostructured devices with colocalization techniques for studying cellular machines under conditions that replicate in vivo kinetics.
6. Summary and Perspective
As described above, colocalization studies have significantly advanced our understanding of transcription, splicing, and translation. In addition, these methods have already been applied to a number of other biological processes. Single molecule colocalization has provided new insights into systems as diverse as telomerase46, nucleosomes47, viral packaging48, and branched actin network formation.49 To one degree or another, all of these studies exploit single molecule colocalization's ability to track reactions in real-time and to correlate specific events along the reaction pathway with the molecular composition of individual complexes.
As evidenced by the utility of combining colocalization studies with FRET or ZMWs, the blending of colocalization methods with other technologies will likely expand this technique to new realms. In addition to ZMWs, other tools have been developed to permit use of higher concentrations of fluorescent ligands in TIRF microscopy. Both Photoactivation Diffusion Excitation (PhaDE)50 and Convex Lens Induced Confinement (CLIC)51 provide alternatives to ZMWs that require less specialized instrumentation and microfabrication techniques. Both CLIC and PhaDE should be compatible with a number of colocalization experiments. Anti-Brownian Electrophoretic (ABEL) traps, on the other hand, may permit colocalization experiments to be performed on the second timescale without the need for surface tethering.52,53 Recently, single molecule fluorescence experiments have been combined with single molecule force analysis.54,55 While the high power trapping lasers increase the likelihood of photobleaching of common fluorophores (“opticution”), the new insights that could be gained by monitoring force as a function of colocalization of biomolecules should spur further developments.
Ultimately, the goal of many single molecule laboratories is to develop methods for studying single biomolecules in vivo. Colocalization assays represent a unique challenge for experiments carried out inside the cell. A number of super-resolution methods (e.g., STORM, PALM)56 can be used to observe single molecules in vivo. However, expanding these methods to studies of colocalization is nontrivial since the stochastic nature of these imaging methods may reduce the probability of two fluorophores that are part of the same biomolecular complex being imaged. Nonetheless, super-resolution colocalization experiments combined with fluorescence in situ hybridization (FISH) has enabled identification of mRNAs in fixed yeast cells.57 Lubeck and Cai colocalized multiple FISH probes containing different colored fluorophores to a particular mRNA with high precision by Gaussian fitting of the colocalized spots. This combination of colors generated a visual barcode for the transcript. Extending this result permitted combinatorial labeling and simultaneous visualization of 32 different RNAs in yeast.
Recently, several groups have made great strides in single molecule colocalization in live cells using a variety of approaches. Reyes-Lamothe and coworkers have used slimfield microscopy of living E. coli to study DNA replication.58 Replisome components fused to yellow fluorescent protein (YPet) were counted as they colocalized to replication forks. In live yeast, transcription kinetics have been monitored by colocalizing two different colored fluorescent proteins to the same transcript.59 In mouse embryonic fibroblasts, Grünwald and Singer have used super-registration colocalization microscopy to study interactions between an actin mRNA harboring multiple copies of yellow fluorescent protein and the nuclear pore complex labeled with a red fluorescent protein (tandem dimer tomato).60 Using this microscopic assay, they were able to determine that docking/undocking of the mRNA to the nuclear pore and not transport is rate-limiting for mRNA entry to the cytoplasm. Common to all of these approaches is the combination of genetic and fluorescence microscopy tools to elucidate biochemistry in vivo. Experiments such as these show the potential for colocalization methods to provide unique insights into cell biology and ensure that colocalization single molecule microscopy will continue to yield new discoveries into the most complex cellular processes.
Acknowledgments
We acknowledge support from startup funding from the University of Wisconsin – Madison, Wisconsin Alumni Research Foundation (WARF), and the Department of Biochemistry. AAH, JDL, and MLR are also supported by a K99/R00 award from the National Institutes of Health (R00 GM086471), the Arnold and Mabel Beckman Foundation, and the Hatch Act Formula Fund from the USDA (WIS 01625). MLR is supported by the Molecular Biophysics Training Program (NIH T32-GM08293). We thank members of the Hoskins laboratory, Eric Anderson, Dan Araki, and Michael Bellecourt for comments on the manuscript.
Biographies
Joshua D. Larson: Joshua earned his bachelor's degree in biology from the University of Wisconsin - Stevens Point. He spent two years teaching high school physics and chemistry in West Africa as a United States Peace Corps volunteer. He worked for two years with Patrick Hoffman at the University of Wisconsin - Madison studying the effects of cereal grain prolamin content on starch digestion in ruminants. He is currently working towards his doctorate in biophysics at UW-Madison. His research is focused on 5′ splice site recognition during pre-mRNA splicing using single molecule colocaliztion spectroscopy. Joshua has constructed two total internal reflectance fluorescence microscopes.
Margaret L. Rodgers: Margaret received her B.S. in biochemistry with a minor in biophysics from the University of Michigan – Ann Arbor in 2011. As an undergraduate, she worked with Nils Walter studying folding of the preQ1 riboswitch using single molecule FRET. Currently, she is pursuing a PhD in biophysics at the University of Wisconsin – Madison. Her thesis work focuses on spliceosome assembly and recycling utilizing CoSMoS and single molecule FRET. In 2013, she was awarded a Molecular Biophysics Training Grant funded by the NIH.
Aaron A. Hoskins: Aaron Hoskins obtained a B.S. in chemistry from Purdue University in 2000. His undergraduate research led him to pursue graduate studies in biochemistry at MIT with JoAnne Stubbe. He received a PhD in biological chemistry in 2006. From 2006-2011, he was a postdoctoral fellow with Melissa Moore and Jeff Gelles at UMass Medical School and Brandeis University, respectively. During this time he was awarded a NIH K99/R00 career transition award. In 2011, he started his laboratory at U. Wisconsin-Madison where he uses single molecule fluorescence microscopy to study RNA splicing. He was recently named a 2013 Beckman Young Investigator.

References
- 1.Walter NG, Huang CY, Manzo AJ, Sobhy MA. Nat Methods. 2008;5:475–489. doi: 10.1038/nmeth.1215. [DOI] [PMC free article] [PubMed] [Google Scholar]
- 2.Lamichhane R, Solem A, Black W, Rueda D. Methods. 2010;52:192–200. doi: 10.1016/j.ymeth.2010.06.010. [DOI] [PMC free article] [PubMed] [Google Scholar]
- 3.Dulin D, Lipfert J, Moolman MC, Dekker NH. Nat Rev Genet. 2013;14:9–22. doi: 10.1038/nrg3316. [DOI] [PubMed] [Google Scholar]
- 4.Kapanidis AN, Laurence TA, Lee NK, Margeat E, Kong X, Weiss S. Acc Chem Res. 2005;38:523–533. doi: 10.1021/ar0401348. [DOI] [PubMed] [Google Scholar]
- 5.Single Molecule Techniques: A Laboratory Manual. Cold Spring Harbor Laboratory Press; New York: 2008. [Google Scholar]
- 6.Friedman LJ, Chung J, Gelles J. Biophys J. 2006;91:1023–1031. doi: 10.1529/biophysj.106.084004. [DOI] [PMC free article] [PubMed] [Google Scholar]
- 7.Chapter 7 - Total Internal Reflection Fluorescence Microscopy. 1st. Vol. 89. Elsevier Inc.; 2008. [DOI] [PubMed] [Google Scholar]
- 8.Pertsinidis A, Zhang Y, Chu S. Nature. 2010;466:647–651. doi: 10.1038/nature09163. [DOI] [PubMed] [Google Scholar]
- 9.Yildiz A, Selvin PR. Acc Chem Res. 2005;38:574–582. doi: 10.1021/ar040136s. [DOI] [PubMed] [Google Scholar]
- 10.Browning DF, Busby SJ. Nat Rev Microbiol. 2004;2:57–65. doi: 10.1038/nrmicro787. [DOI] [PubMed] [Google Scholar]
- 11.Haugen SP, Ross W, Gourse RL. Nat Rev Microbiol. 2008;6:507–519. doi: 10.1038/nrmicro1912. [DOI] [PMC free article] [PubMed] [Google Scholar]
- 12.Gourse RL, Landick R. Cell. 2012;148:635–637. doi: 10.1016/j.cell.2012.01.042. [DOI] [PMC free article] [PubMed] [Google Scholar]
- 13.Friedman LJ, Gelles J. Cell. 2012;148:679–689. doi: 10.1016/j.cell.2012.01.018. [DOI] [PMC free article] [PubMed] [Google Scholar]
- 14.Sclavi B, Zaychikov E, Rogozina A, Walther F, Buckle M, Heumann H. Proc Natl Acad Sci USA. 2005;102:4706–4711. doi: 10.1073/pnas.0408218102. [DOI] [PMC free article] [PubMed] [Google Scholar]
- 15.Davis CA, Bingman CA, Landick R, Record MT, Saecker RM. Proc Natl Acad Sci USA. 2007;104:7833–7838. doi: 10.1073/pnas.0609888104. [DOI] [PMC free article] [PubMed] [Google Scholar]
- 16.Revyakin A, Zhang Z, Coleman RA, Li Y, Inouye C, Lucas JK, Park SR, Chu S, Tjian R. Genes Dev. 2012;26:1691–1702. doi: 10.1101/gad.194936.112. [DOI] [PMC free article] [PubMed] [Google Scholar]
- 17.Yudkovsky N, Ranish JA, Hahn S. Nature. 2000;408:225–229. doi: 10.1038/35041603. [DOI] [PubMed] [Google Scholar]
- 18.Wahl MC, Will CL, Lührmann R. Cell. 2009;136:701–718. doi: 10.1016/j.cell.2009.02.009. [DOI] [PubMed] [Google Scholar]
- 19.Hoskins AA, Friedman LJ, Gallagher SS, Crawford DJ, Anderson EG, Wombacher R, Ramirez N, Cornish VW, Gelles J, Moore MJ. Science. 2011;331:1289–1295. doi: 10.1126/science.1198830. [DOI] [PMC free article] [PubMed] [Google Scholar]
- 20.Juillerat A, Gronemeyer T, Keppler A, Gendreizig S, Pick H, Vogel H, Johnsson K. Chem Biol. 2003;10:313–317. doi: 10.1016/s1074-5521(03)00068-1. [DOI] [PubMed] [Google Scholar]
- 21.Miller LW, Cai Y, Sheetz MP, Cornish VW. Nat Methods. 2005;2:255–257. doi: 10.1038/nmeth749. [DOI] [PubMed] [Google Scholar]
- 22.Birdsall B, Burgen AS, Roberts GC. Biochemistry. 1980;19:3723–3731. doi: 10.1021/bi00557a013. [DOI] [PubMed] [Google Scholar]
- 23.Crawford DJ, Hoskins AA, Friedman LJ, Gelles J, Moore MJ. Proc Natl Acad Sci USA. 2013;110:6783–6788. doi: 10.1073/pnas.1219305110. [DOI] [PMC free article] [PubMed] [Google Scholar]
- 24.Wang ET, Sandberg R, Luo S, Khrebtukova I, Zhang L, Mayr C, Kingsmore SF, Schroth GP, Burge CB. Nature. 2008;456:470–476. doi: 10.1038/nature07509. [DOI] [PMC free article] [PubMed] [Google Scholar]
- 25.Keppetipola N, Sharma S, Li Q, Black DL. Crit Rev Biochem Mol Biol. 2012;47:360–378. doi: 10.3109/10409238.2012.691456. [DOI] [PMC free article] [PubMed] [Google Scholar]
- 26.Matlin AJ, Clark F, Smith CWJ. Nat Rev Mol Cell Biol. 2005;6:386–398. doi: 10.1038/nrm1645. [DOI] [PubMed] [Google Scholar]
- 27.Black DL. Annu Rev Biochem. 2003;72:291–336. doi: 10.1146/annurev.biochem.72.121801.161720. [DOI] [PubMed] [Google Scholar]
- 28.Cherny D, Gooding C, Eperon GE, Coelho MB, Bagshaw CR, Smith CWJ, Eperon IC. EMBO J. 2010;29:2161–2172. doi: 10.1038/emboj.2010.103. [DOI] [PMC free article] [PubMed] [Google Scholar]
- 29.Hodson MJ, Hudson AJ, Cherny D, Eperon IC. Nucleic Acids Res. 2012;40:6850–6862. doi: 10.1093/nar/gks322. [DOI] [PMC free article] [PubMed] [Google Scholar]
- 30.Green R, Noller HF. Annu Rev Biochem. 1997;66:679–716. doi: 10.1146/annurev.biochem.66.1.679. [DOI] [PubMed] [Google Scholar]
- 31.Marshall RA, Aitken CE, Dorywalska M, Puglisi JD. Annu Rev Biochem. 2008;77:177–203. doi: 10.1146/annurev.biochem.77.070606.101431. [DOI] [PubMed] [Google Scholar]
- 32.Aitken CE, Petrov A, Puglisi JD. Annu Rev Biophys. 2010;39:491–513. doi: 10.1146/annurev.biophys.093008.131427. [DOI] [PubMed] [Google Scholar]
- 33.Huh WK, Falvo JV, Gerke LC, Carroll AS, Howson RW, Weissman JS, O'Shea EK. Nature. 2003;425:686–691. doi: 10.1038/nature02026. [DOI] [PubMed] [Google Scholar]
- 34.Bakshi S, Siryaporn A, Goulian M, Weisshaar JC. Mol Microbiol. 2012;85:21–38. doi: 10.1111/j.1365-2958.2012.08081.x. [DOI] [PMC free article] [PubMed] [Google Scholar]
- 35.Levene MJ, Korlach J, Turner SW, Foquet M, Craighead HG, Webb WW. Science. 2003;299:682–686. doi: 10.1126/science.1079700. [DOI] [PubMed] [Google Scholar]
- 36.Laursen BS, Sørensen HP, Mortensen KK, Sperling-Petersen HU. Microbiol Mol Biol Rev. 2005;69:101–123. doi: 10.1128/MMBR.69.1.101-123.2005. [DOI] [PMC free article] [PubMed] [Google Scholar]
- 37.Myasnikov AG, Simonetti A, Marzi S, Klaholz BP. Curr Opin Struct Biol. 2009;19:300–309. doi: 10.1016/j.sbi.2009.04.010. [DOI] [PubMed] [Google Scholar]
- 38.Kozak M. Gene. 1999;234:187–208. doi: 10.1016/s0378-1119(99)00210-3. [DOI] [PubMed] [Google Scholar]
- 39.Tsai A, Petrov A, Marshall RA, Korlach J, Uemura S, Puglisi JD. Nature. 2012;487:390–393. doi: 10.1038/nature11172. [DOI] [PMC free article] [PubMed] [Google Scholar]
- 40.Uemura S, Aitken CE, Korlach J, Flusberg BA, Turner SW, Puglisi JD. Nature. 2010;464:1012–1017. doi: 10.1038/nature08925. [DOI] [PMC free article] [PubMed] [Google Scholar]
- 41.Moazed D, Noller HF. Nature. 1989;342:142–148. doi: 10.1038/342142a0. [DOI] [PubMed] [Google Scholar]
- 42.Hashem Y, des Georges A, Fu J, Buss SN, Jossinet F, Jobe A, Zhang Q, Liao HY, Grassucci RA, Bajaj C, Westhof E, Madison-Antenucci S, Frank J. Nature. 2013;494:385–389. doi: 10.1038/nature11872. [DOI] [PMC free article] [PubMed] [Google Scholar]
- 43.Frank J. Curr Opin Struct Biol. 2012;22:778–785. doi: 10.1016/j.sbi.2012.08.001. [DOI] [PMC free article] [PubMed] [Google Scholar]
- 44.Korostelev A, Ermolenko DN, Noller HF. Curr Opin Chem Biol. 2008;12:10–10. doi: 10.1016/j.cbpa.2008.08.037. [DOI] [PMC free article] [PubMed] [Google Scholar]
- 45.Chen J, Petrov A, Tsai A, O'Leary SE, Puglisi JD. Nat Struct Mol Biol. 2013;20:718–727. doi: 10.1038/nsmb.2567. [DOI] [PMC free article] [PubMed] [Google Scholar]
- 46.Wu JY, Stone MD, Zhuang X. Nucleic Acids Res. 2010;38:e16. doi: 10.1093/nar/gkp1033. [DOI] [PMC free article] [PubMed] [Google Scholar]
- 47.Blosser TR, Yang JG, Stone MD, Narlikar GJ, Zhuang X. Nature. 2009;462:1022–1027. doi: 10.1038/nature08627. [DOI] [PMC free article] [PubMed] [Google Scholar]
- 48.Chou YY, Vafabakhsh R, Doğanay S, Gao Q, Ha T, Palese P. Proc Natl Acad Sci USA. 2012;109:9101–9106. doi: 10.1073/pnas.1206069109. [DOI] [PMC free article] [PubMed] [Google Scholar]
- 49.Smith BA, Daugherty-Clarke K, Goode BL, Gelles J. Proc Natl Acad Sci USA. 2013;110:1285–1290. doi: 10.1073/pnas.1211164110. [DOI] [PMC free article] [PubMed] [Google Scholar]
- 50.Loveland AB, Habuchi S, Walter JC, van Oijen AM. Nat Methods. 2012;9:987–992. doi: 10.1038/nmeth.2174. [DOI] [PMC free article] [PubMed] [Google Scholar]
- 51.Leslie SR, Fields AP, Cohen AE. Anal Chem. 2010;82:6224–6229. doi: 10.1021/ac101041s. [DOI] [PMC free article] [PubMed] [Google Scholar]
- 52.Cohen AE, Moerner WE. Proc Natl Acad Sci USA. 2006;103:4362–4365. doi: 10.1073/pnas.0509976103. [DOI] [PMC free article] [PubMed] [Google Scholar]
- 53.Wang Q, Goldsmith RH, Jiang Y, Bockenhauer SD, Moerner WE. Acc Chem Res. 2012;45:1955–1964. doi: 10.1021/ar200304t. [DOI] [PMC free article] [PubMed] [Google Scholar]
- 54.Lang MJ, Fordyce PM, Engh AM, Neuman KC, Block SM. Nat Methods. 2004;1:133–139. doi: 10.1038/nmeth714. [DOI] [PMC free article] [PubMed] [Google Scholar]
- 55.Comstock MJ, Ha T, Chemla YR. Nat Methods. 2011;8:335–340. doi: 10.1038/nmeth.1574. [DOI] [PMC free article] [PubMed] [Google Scholar]
- 56.Huang B, Babcock H, Zhuang X. Cell. 2010;143:1047–1058. doi: 10.1016/j.cell.2010.12.002. [DOI] [PMC free article] [PubMed] [Google Scholar]
- 57.Lubeck E, Cai L. Nat Methods. 2012;9:743–748. doi: 10.1038/nmeth.2069. [DOI] [PMC free article] [PubMed] [Google Scholar]
- 58.Reyes-Lamothe R, Sherratt DJ, Leake MC. Science. 2010;328:498–501. doi: 10.1126/science.1185757. [DOI] [PMC free article] [PubMed] [Google Scholar]
- 59.Hocine S, Raymond P, Zenklusen D, Chao JA, Singer RH. Nat Methods. 2013;10:119–121. doi: 10.1038/nmeth.2305. [DOI] [PMC free article] [PubMed] [Google Scholar]
- 60.Grünwald D, Singer RH. Nature. 2010;467:604–607. doi: 10.1038/nature09438. [DOI] [PMC free article] [PubMed] [Google Scholar]
- 61.Fluorescence SpectraViewer. Invitrogen [Google Scholar]


