Abstract
Mutations in Ras isoforms such as K-Ras, N-Ras, and H-Ras contribute to roughly 85, 15, and 1 % of human cancers, respectively. Proper membrane targeting of these Ras isoforms, a prerequisite for Ras activity, requires farnesylation or geranylgeranylation at the C-terminal CAAX box. We devised an in vivo screening strategy based on monitoring Ras activation and phenotypic physiological outputs for assaying synthetic Ras function inhibitors (RFI). Ras activity was visualized by the trans-location of RBDRaf1-GFP to activated Ras at the plasma membrane. By using this strategy, we screened one synthetic farnesyl substrate analog (AGOH) along with nine putative inhibitors and found that only m-CN-AGOH inhibited Ras activation. Phenotypic analysis of starving cells could be used to monitor polarization, motility, and the inability of these treated cells to aggregate properly during fruiting body formation. Incorporation of AGOH and m-CN-AGOH to cellular proteins was detected by western blot. These screening assays can be incorporated into a high throughput screening format using Dictyostelium discoideum and automated microscopy to determine effective RFIs. These RFI candidates can then be further tested in mammalian systems.
Keywords: Ras function inhibitors, RBD, Polarity, Development
Introduction
Ras proteins are monomeric small guanosine triphosphatases (GTPases) which regulate normal cellular proliferation [1]. Aberrant signaling through Ras pathways occurs both as the result of mutations in Ras and from the mis-regulation of genes upstream and downstream of Ras [1-3]. 20 % of human tumors have activating point mutations in Ras, with most found in KRAS (about 85 % of total), then NRAS (about 15 %), and lastly HRAS (<1 %) [2]. These mutations all affect the GTPase activity of RAS, preventing GTPase-activating proteins from promoting hydrolysis of GTP on RAS and therefore causing RAS to accumulate in the GTP-bound active form [2, 4]. Ras GTPases activate four major effector pathways including Raf protein kinases, phosphatidyl inositol 3-kinase (PI3K), Ral guanine nucleotide dissociation stimulator (RAL GDS), and phospholipase C-epsilon. While Raf regulates cell cycle progression and transcription, PI3K plays a role in cell survival, transcription, translation, and cytoskeletal signaling [5]. Ral GDS regulates transcription, vesicle transport, and cell cycle progression [2].
Post-translational prenylation plays a critical role in the proper localization and activation of Ras [2, 6-8]. Post-translational farnesylation of Ras catalyzed by protein farnesyltransferase (FTase) is obligatory for protein function and sub-cellular localization. FTase catalyzes the transfer of a farnesyl group from farnesyl diphosphate (FPP) to proteins with a cysteine residue located in a C-terminal CAAX motif where C is the modified cysteine, A is often an aliphatic residue, and X is Ser, Met, Ala, or Gln [9-12]. When X is a Leu, Ilu, or Val, proteins are geranylgeranylated by geranylgeranyl transferase type 1 (GGTase I) [9]. After prenylation, the AAX peptide is cleaved by the endopeptidase Ras-converting enzyme1. This is followed by methylation of the carboxyl terminus of the terminal farnesylated cysteine residue by S-isoprenyl cysteine O-methyltransferase [13-15].
K-Ras is a major driver of the aggressive nature of many cancers, including tumor growth, invasiveness, metastasis, and therapeutic resistance [16-22]. As a result, methodologies for therapeutically targeting K-Ras and Ras signal transduction pathways have been highly sought. To date, there are ~20 new Ras-directed therapeutic agents in clinical trials for cancer. Targets include FTase, GGTase I, transforming protein p21-mRNA (H Ras mRNA), c-Raf1 mRNA, mitogen-activated protein kinase kinase, Raf, Epidermal growth factor receptor (EGFR), and ERBB2/HER2/neu [2]. This knowledge led to the development and clinical testing of FTase inhibitors (FTIs) in multiple cancer types [18, 23] including pancreatic cancer [24]. FTIs in clinical trials include CAAX peptidomimetics and FPP analogs [2, 25]. Although initial FTI clinical trials in breast cancer showed substantial responsiveness, more so than other solid tumors [19], the lack of clear survival benefits halted these trials. The lack of FTI clinical efficacy is attributed to alternative prenylation of FTase substrates such as K-Ras, which become geranylgeranylated by GGTase I when FTase is inhibited [26-28]. Therefore, there is a clear need for pharmacological agents that specifically target K-Ras and which can also avoid alternative prenylation [29, 30].
These trials suggest that the development of Ras function inhibitors (RFIs) which do not leave the target proteins as substrates for alternative prenylation by GGTase I is a promising area of research. FTIs have traditionally been screened by measuring the incorporation of radiolabeled precursors of FPP and GGPP into farnesylated proteins [31, 32]. The drawback of this method is low sensitivity, radioactive contamination, and time consumption [33]. Recently, synthetic prenyl substrate analogs and inhibitors have been shown to be incorporated into cellular proteins. In particular, AGOH is a pro-drug version of AGPP and is incorporated into normally prenylated cellular proteins in an FTase-dependent manner [34-39]. To exploit this incorporation, antibodies have been developed against anilinogeranyl (AG) epitopes and used for detecting proteins modified with the AG moiety [8, 39]. Ras modified with farnesyl analogs has also been microinjected into Xenopus laevis oocytes to examine the effects of unnatural prenyl groups on signaling. Oocytes were monitored for downstream Ras effector functions and included germinal vesicle breakdown and MAPK activity [8]. In this method, it was found that hydrophilic farnesyl analogs p-NO2-AGPP, p-CN-AGPP, and Isox-GPP could function as H-RFIs. This procedure requires 3 days for incorporation and multiple steps that include acclimatizing animals, anesthesia, oocyte extraction, purification of H-Ras, modification with FPP analogs, microinjection, and a gel shift assay [8]. Such an elaborate protocol is very difficult to adopt for high throughput assays.
The Dictyostelium discoideum genome contains a protein prenyl transferase α subunit (Gene IDDDB_G0287077), CAAX prenyl protease (Gene IDDDB_G0290849), and isoprenylcysteine carboxyl methyl transferase (Gene ID-DDB_G0272799). These enzymes encompass the post-translational machinery for localization and activation of prenylated proteins. The D. discoideum genome also contains eighteen Ras GTPases (http://dictybase.org). With its simple media requirement for growth, its fast doubling time, rapid signaling responses, and genetic tractability, D. discoideum is a versatile model system for screening Ras function inhibitors. Here, we report a simple screening procedure based on live cell imaging of cells expressing Ras-binding domain of mammalian Raf1 fused to GFP (RBDRaf1-GFP), a biosensor for activated RasG and likely other Ras GTPases [40, 41]. By employing this technique, we successfully identified m-CN-AGOH as a novel Ras function inhibitor. This technology has the potential for use in high throughput screening to identify potential pharmaceutical agents that target Ras and Ras pathways in cancer.
Materials and methods
Chemicals and devices
All analogs (Table 1) were synthesized as described [36, 42, 43]. All compounds were dissolved in DMSO (Sigma) and stored at −20 °C until used. HL5 medium in powder form was purchased from For Medium. Agar and G418 are from Research Products International Corps., and Hygromycin is from Cellgro. Folic acid was obtained from Fisher scientific, cAMP from Sigma chemicals, and the anti-AGPP polyclonal antibody was developed in the Spielmann lab [39]. Blocking buffer and secondary IR dye 680 coupled antibody were purchased from LiCor. Femtotip microinjection needles, micromanipulator, and pump are from Eppendorf International. One-well glass chambers were purchased from Lab-Tek (Nalge Nunc, Naperville, PA) and 0.1-cm electroporation cuvette is from Fisher scientific.
Table 1.
Potential Ras functional inhibitors
| Compound # | Sample Code | Structure | Ras inhibition |
|---|---|---|---|
| 1 | p-tBu-AGOH |
|
No |
| 2 | p-iPr-AGOH |
|
No |
| 3 | p-CF3O-AGOH |
|
No |
| 4 | AGOH |
|
No |
| 5 | p-PhO-AGOH |
|
No |
| 6 | m-CF3O-PGOH |
|
No |
| 7 | p-CF3S-PGOH |
|
No |
| 8 | m-CN-AGOH |
|
Yes |
| 9 | p-CF3O-PGOH |
|
No |
| 10 | BzDMAOH |
|
No GGTI |
| 11 | AFOH |
|
No |
Dictyostelium transformation
Wild-type (A×2) cells were transformed with the plasmids expressing RBDRaf1–GFP [40, 44] and LimE-RFP [45]. Wild-type (A×2) cells transformed with RBDRaf1–GFP alone were used as the control. On the following day, the antibiotic G418 (30 μg/ml) was added to wild-type cells expressing RBDRaf1-GFP alone, while G418 and Hygromycin (35 μg/ml) were added to other wild-type cells expressing both RBDRaf1-GFP and mRFPmars-LimEΔcoil.
Screening strategy for Ras function inhibitors
Mammalian Raf-1 is a MAP kinase kinase kinase, which is a downstream effector of the Ras family of GTPases [2]. In D. discoideum, Raf-1 directly interacts with GTP-bound RasG, but can likely bind to other Ras proteins, as has been shown when RasG is deleted [40, 41]. By taking advantage of these interactions, it is possible to image Ras activation in live cells by fusing the Ras-binding domain of Raf-1 to a fluorescent reporter, the green fluorescent protein (GFP). Here, we used the genetically encoded RBDRaf1-GFP as a probe for detecting activated Ras. We treated RBDRaf1-GFP- and LimE-RFP-expressing cells with the AGOH analogs. LimE-RFP, which fluoresces red, is a biomarker for F-actin [45]. F-actin polymerization results from Ras signaling activation and is a critical component of cell migration. Cells expressing RBDRaf1-GFP alone were used as DMSO-treated control and would be lacking the LimE-RFP expression protein. To insure that both cell lines were equally competent for folic acid stimulation, the control and treated cells were prepared for the assay at the same time and under the same conditions. Cells were stimulated with a uniform stimulus of folic acid and their RBDRaf1-GFP responses measured. Only experiments where the control cells responded were subsequently scored. In no case did the treated cells respond while the control cells did not. Translocation of LimE-RFP to the plasma membrane was also monitored in the inhibitor-treated cells.
Processing and imaging of cells
Wild-type cells expressing RBDRaf1-GFP and LimE-RFP or LimE-RFP (1 × 10⁷ cells) in a Petri dish were treated with 30 μM AGPP analogs overnight (16 h). The following day, these cells were removed from the dish and shaken in 50-ml flask for 3 h at 110 rpm and pulsed with 50 μM folic acid for 3 h. Cells were then washed 3X with development buffer (5 mM Na2HPO4, 5 mM KH2PO4, 1 mM CaCl2, 2 mM MgCl2 pH to 6.5), seeded on the cover glass of a one-well chamber microscope slide, and allowed to adhere for 15 min. 10 μl of 100 μM folic acid was loaded into a Femtotip micropipette, connected to a microinjector, and lowered to the coverslip using a micromanipulator. Positive pressure (50 hPa) was applied by the microinjector. 30 frames were captured with an interval between frames of ~1.5 s. Cells were stimulated with folic acid at the 5th frame of the movie by bringing the micropipette into close proximity of the cells being imaged. The cells were imaged and the translocation of RBDRaf1-GFP and LimE-RFP to the plasma membrane was monitored by a Zeiss Axiovert microscope using a 40X (1.35 NA) oil objective lens and GFP and CY3 filters (Chroma).
Development on agar plate
Cells were treated with a putative RFI or DMSO as described above. A 1 % Agar solution was prepared and poured into a 35-mm Petri dish and allowed to solidify. Cells were washed with developmental buffer (DB) 3X and resuspended in DB containing 30 μM RFI or 10 μl DMSO at a concentration of 1 × 10⁹ cells/ml. For the wash experiments, cells were resuspended in DB alone. 100 μl of a 0.7 × 10⁸ cell suspension was spread onto a DB gar plate. The plate was incubated at 22 °C. Cells were imaged by bright field microscopy at indicated time points.
Early cell polarization and chemotaxis assay
Wild-type cells were developed on the DB agar plate as described above. At the 6th hour of development, cells were resuspended in DB by mechanically pipetting up and down several times. Cells were then positioned on the cover glass of a one-well chamber by micropipetting, allowed to adhere, and then imaged as described above. The chemotaxis assay was performed as described previously [46].
Eccentricity
Polarity of the cell can be measured in terms of eccentricity, which is a parameter associated with conic section. It is a measure of how much the conic section deviates from being circular. The eccentricity of a circle is zero. The eccentricity of an ellipse is >zero, but <1[47]. The formula used was √1-B2/A2, where A is the length and B is the width of the cell [48]. Length and width were measured by drawing straight lines across the cell using Slidebook-5 software.
Detection of AG- and m-CN-AG-modified proteins by western blot
Wild-type cells were treated with 30 μM of m-CN-AGOH, AGOH, or DMSO, separately and overnight. Cells were removed from the plate and washed 3X with DB and suspended at a concentration of 2 × 10⁷ cells/ml in DB. 40 μl of cells were transferred into a microcentrifuge tube containing 10 μl of 5X SDS sample buffer. The sample was heated at 95 °C for 5 min in a hot block. 2.5 μl (4 × 10⁴ cells) cells were loaded into wells of 10 % SDS–polyacrylamide gel. After separation, protein was transferred to a nitrocellulose membrane at 30 V for an hour using the Invitrogen Xcell II blot module. The membrane was incubated with LiCor-Odyssey blocking buffer for an hour and then with anti-AGPP polyclonal antibody (1:2500 dilution) overnight at 4 °C [39]. The membrane was washed 3X for 10 min with TBST and incubated with IR dye 680 coupled secondary antibody for 1 h at room temperature. The membrane was washed three times with TBST, rinsed three times with TBS, and imaged using a LiCor Odyssey IR imager. Lane intensity of blot was determined by ImageJ.
Results
Synthesis and properties of anilinogeranyl diphosphate analogs
FTase-catalyzed transfer of FPP analogs to H-Ras depends on both the shape and size of the analog, [49] but not on analog hydrophobicity. However, Ras function can be inhibited by modification with less hydrophobic FPP analogs such as GPP [8]. We have previously shown that an aniline or phenoxy group is isosteric with the isoprene units of FPP and that analogs with a range of substituents on the aryl group are FTase-transferable substrates [50]. Based on these findings, we synthesized aniline and phenoxy FPP analogs with various aryl group substitutions that make each analog differ in shape, size, and hydrophobicity (Table 1) [36, 42, 43].
Identification of a Ras function inhibitor
Cells expressing RBDRaf1-GFP alone (controls) or with LimE-RFP (treated) were imaged for Ras activation and actin polymerization, respectively, as described in the screening strategy. Inhibition of Ras farnesylation would be expected to inhibit translocation of the RBDRaf1-GFP to the plasma membrane. Of nine putative RFIs (Compounds 1–3, 5–9, 11 in Table 1) screened, only m-CN-AGOH (Compound-8 in Table 1) was found to block translocation of RBDRaf1-GFP and LimE-RFP (Fig. 1A, Supplementary Figure-1). Cells treated with the other putative inhibitors (Supplementary Figure-2) and the substrate analog AGOH (Compound-4 in Table 1; Fig. 1B) appeared to have normal Ras activity and actin polymerization responses.
Fig. 1.
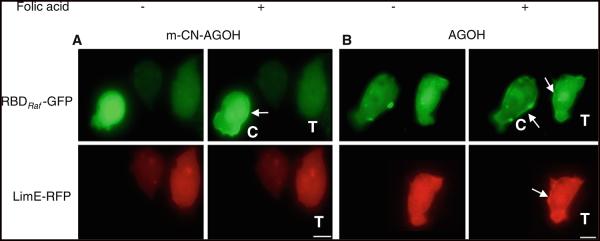
m-CN-AGOH inhibits Ras activation. Cells expressing RBDRaf1-GFP and LimE-RFP were treated with m-CN-AGOH (A) or AGOH (B) and stimulated uniformly with 100 μM folic acid. Putative inhibitor m-CN-AGOH (Compound-8, Table 1) inhibited RBDRaf1-GFP and LimE-RFP translocation to membrane. C and T indicate control and treated cells, respectively. Note that treated cells show no Ras activity or actin response. Substrate analog AGOH did not inhibit the translocation of RBDRaf1-GFP or LimE-RFP. Arrow indicates the recruitment of RBDRaf1-GFP and LimE-RFP to the plasma membrane in response to folic acid stimulation (bar, 5 μm)
m-CN-AGOH delays cell polarization and development
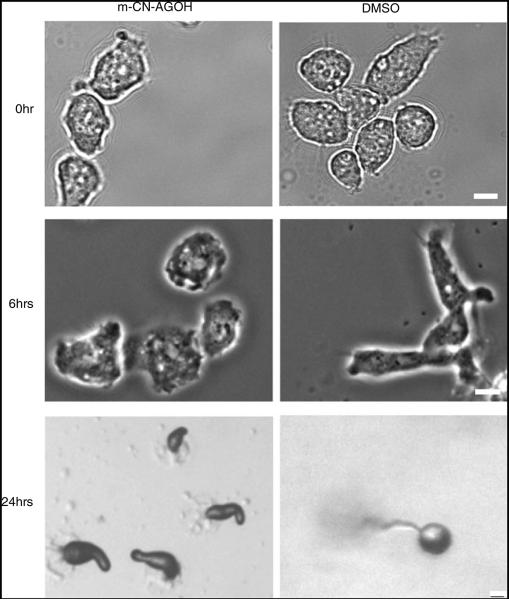
Dictyostelium discoideum cells alter their morphology several hours after starvation and become elongated and polarized, with a distinct anterior and rear [51]. Cells naturally polarize in response to cAMP autocrine signaling and to cAMP gradients during cell migration [52-55]. Signaling proteins such as Ras, PI3K, and PI(3,4,5)P3 localize at the leading edge, while PTEN and Myosin-II localize at the rear and contribute to cell polarity and the migratory response [41, 56-59]. Cells were imaged at 6 h to visualize their ability to polarize in the presence of m-CN-AGOH or DMSO alone. Cells treated with DMSO polarized normally, while m-CN-AGOH-treated cells were still unpolarized at 6 h (Fig. 2).
Fig. 2.
Delayed polarization and development of m-CN-AGOH-treated cells. Cells were treated with either m-CN-AGOH or DMSO as a control. m-CN AGOH-treated cells immediately after starvation (0 h) and after 6 h. The treated cells did not polarize at 6 h, while the control cells were very polarized (bar, 5 μm). The m-CN-AGOH-treated cells also did not form fruiting bodies at 24 h, while the DMSO-treated control cells did develop in a timely manner and formed fruiting bodies (bar, ~50 μm)
Cells have typically aggregated and formed small mounds by 8 h and continue through development to form a multi-cellular fruiting body within 24 h [52-55]. We examined the treated cells by microscopy at 24 h (Fig. 2). Cells treated with DMSO had undergone all steps of the developmental process, culminating into fruiting bodies; however, m-CN-AGOH-treated cells did not develop past the slug stage. This result correlates with the above observation showing the m-CN-AGOH-treated cells did not polarize normally.
m-CN-AGOH inhibits random and directional migration
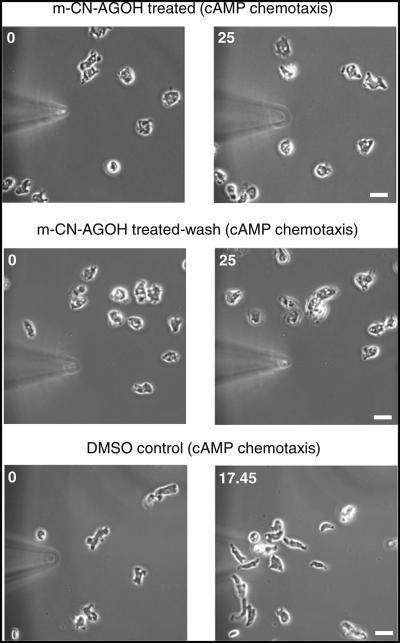
After incubation with m-CN-AGOH for 16 h, cells were developed on a DB agar plate as described above. The effects on random motility and directional migration under cAMP gradient were studied. m-CN-AGPP-treated cells did not chemotax after 6 h of development (Fig. 3). DMSO-treated cells developed and migrated as wild-type cells (Fig. 3). Random motility in the absence of a chemoattractant was slightly inhibited (Supplementary movie-1) when compared to DMSO-treated cells (Supplementary movie-2). Random motility of the DMSO-treated cells was comparable to wild type.
Fig. 3.
m-CN-AGOH inhibited directional migration. Cells were developed and treated with m-CN-AGOH or DMSO as described in the methods and subjected to cAMP chemotaxis. Cells in the continuous presence of m-CN-AGOH or washed did not polarize and migrate toward a cAMP-filled micropipette. DMSO-treated cells polarized and migrated directionally toward the cAMP-filled micro-pipette (bar, 10 μm)
The effect of m-CN-AGOH lasts at least 24 h
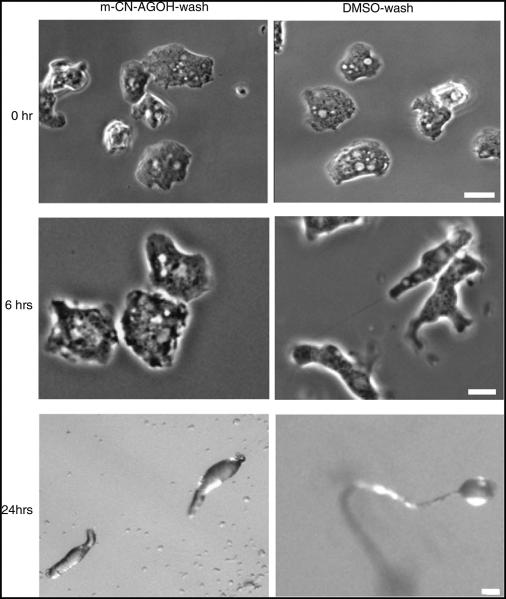
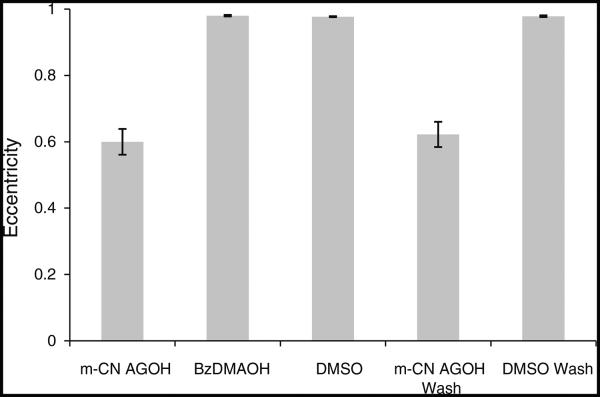
After m-CN-AGOH treatment and washing, cell polarity, development, and migration were monitored. Cells were not polarized after 6 h of starvation and development, and did not form fruiting bodies at 24 h (Fig. 4), while control DMSO-treated cells underwent a normal developmental process. Polarity of the 6 h developed cells was measured in terms of eccentricity as described in the methods (Fig. 5). The eccentricity of 0.59 for m-CN-AGOH-treated cells was significantly lower than 0.98 for DMSO-treated control cells (n = 15, P < 0.005). Similarly, the eccentricity of m-CN-AGOH-washed cells was 0.62, which is significantly lower than DMSO-washed cells (0.97), n = 15, P < 0.005. Cells treated with m-CN-AGOH before and after washing had random motility defects (Supplementary movies-1, 3) and were not able to chemotax in a cAMP gradient after starvation (Fig. 3). These findings clearly indicated that modification of Ras by m-CN-AGOH is irreversible and lasts at least 24 h.
Fig. 4.
The effect of m-CN AGOH lasts for at least 24 h. After treatment with m-CN AGOH and a subsequent wash, cells were imaged at 0, 6, and 24 h. m-CN-AGOH-treated cells did not polarize (bar, 5 μm) or develop, while control cells underwent normal developmental and fruited in 24 h (bar, ~50 μm)
Fig. 5.
m-CN-AGOH significantly inhibited the polarized morphology of cell. Wild-type cells were treated with m-CN-AGOH or DMSO and were developed with respective compounds in DB agar plate for 6 h. Another set of m-CN-AGOH- and DMSO-treated cells were developed in DB agar plate without compounds. Eccentricity was measured as described in the methods. The polarized morphology of m-CN-AGOH-treated cells was significantly inhibited (n = 15, P < 0.005) compared to control cells. Cells were not able to polarize even after being removed from m-CN-AGOH for 6 h (n = 15, P < 0.005)
Incorporation of AGPP analogs to prenylated proteins in Dictyostelium
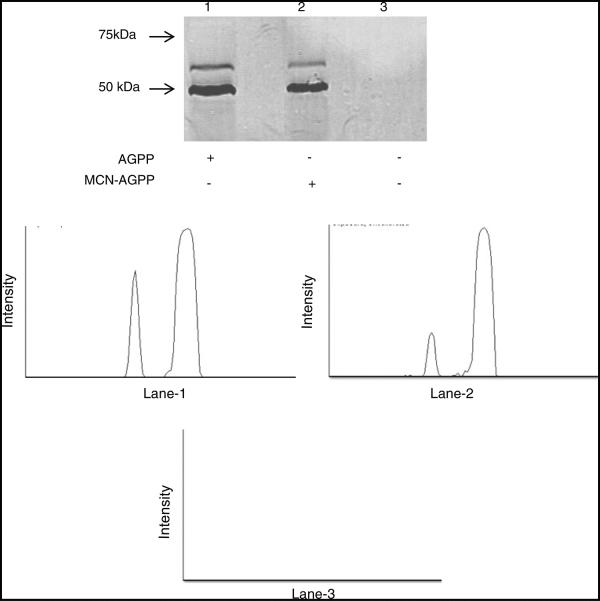
m-CN-AGOH was the only molecule of 10 compounds screened that inhibited prenyl function as assayed by RBDRaf1-GFP membrane translocation. To test whether we could detect incorporation in Ras, we performed Western blotting analysis (Fig. 6). Previously, a polyclonal anti-anilino geranyl antibody was used to detect AGPP- and AGPP analog-modified proteins in mammalian cells and in an in vitro system [39]. We used the same antibody to detect AGPP- and m-CN-AGPP-modified proteins in D. discoideum. We found that both AGPP and m-CN-AGPP were incorporated into proteins with molecular weights of approximately 50 and 60 kDa, respectively. Accordingly, whole-lane densitometry analysis indicated two bands in AGPP- and m-CN-AGPP-treated cells (lane-1 and 2) with slightly different intensity peaks, while no bands were observed in control cells (lane-3). However, incorporation was not detected with molecular weights in the range of Ras (19–27 kDa) or in other small molecular weight G-proteins. This was not completely surprising, at it has been reported that the farnesylated small molecular weight GTPases are present in relatively low abundance [32, 39]. Consequently, the farnesylated small molecular weight GTPases are likely difficult to detect. In another study, only faint bands corresponding to these molecules were found when tritium-labeled farnesol was incubated with glioma cells (C6) or green monkey kidney cells (CV-1) [39, 60]. Since natural levels of endogenous Ras are very low, detection only occurred when using extracts from HEK-293 cells over-expressing a GSTHRas grown in the presence of AGOH with the polyAG-Ab [39]. Interestingly, we also observed two unknown prenylated proteins in D. discoideum, which were a similar size to the mammalian proteins previously observed.
Fig. 6.
Detection of AGOH and m-CN-AGOH incorporation into cellular proteins by western blot. Cells treated with AGOH (lane-1) or m-CN-AGOH (lane-2) or DMSO (lane-3). AGPP and m-CN-AGPP were incorporated into proteins with molecular weight of ~50 and 60 kDa, respectively. No bands were observed in DMSO-treated control cells. Accordingly, two bands were observed in lane-1 and lane-2 and none was observed in lane-3 as supported by densitometry analysis
Discussion
Inhibition of Ras function is a promising approach for developing anticancer therapies. Various agents such as FTIs and the nontoxic farnesylcysteine analog farnesylthiosalicylic acid have been used as methods to restore regulation of Ras–GTP levels and to alter the interaction of Ras–GTP with downstream targets. In the past, RFI screening assays have relied on the monitoring of readouts downstream of Ras signaling pathway such as MAPK activation and germinal vesicle breakdown. This procedure, used in Xenopus oocyte, is time consuming and cannot analyze large numbers of samples in a short time frame [8, 39]. Therefore, designing an assay that can be simple to use for high throughput testing of these small molecule inhibitors is imperative. Live cell imaging of D. discoideum cells expressing RBDRaf1-GFP and treated with various AGOH analogs can be readily performed.
We describe a technique that successfully identified the m-CN-AGOH analog as an RFI. This system provides several readouts which could not be detected by previously described anti-AG antibody-based detection strategies [39]. First, we can monitor Ras activation in real time by stimulating cells with a chemoattractant and monitoring the translocation of the Ras biosensor RBDRaf1-GFP to the plasma membrane. Also, obvious phenotypic changes can be monitored during aggregation, development, and motility. Disruption of these events would be expected if Ras function was inhibited [41, 61]. Consistent with previous observations described in X. laevis oocytes, m-CN-AGOH appears to inhibit Ras function. Loss of Ras activity results in improper regulation of downstream effector molecules, and cells fail to polarize and develop on time. Determination of FPP analog m-CN-AGOH as an RFI was consistent with previous findings [8] showing that hydrophilic FPP analogs are RFIs. Moreover, this is the first time that an RFI has been tested for its in vivo stability and reversibility. In our screening strategy, it was possible to determine the long-term stability of the mCN-AGOH modification. We found that m-CN-AGOH exhibited an inhibitory effect on polarity, development, and motility even after 24 h of removal. It is possible that modification of Ras by m-CN-AGPP dislodges membrane localization and thereby ablates its function. Ras activity was easily visualized with the bright RBDRaf1-GFP reporter and suggests that this biosensor would be useful for high throughput screening of other RFIs using Dictyostelium. Positive hits could then subsequently be tested for other phenotypes such as polarity, development, and motility before screening in a mammalian system.
Supplementary Material
Acknowledgments
We thank Gus Wright for help in editing the manuscript. This work was supported by a NIH Grant R01 GM66152 to HPS and R01 GM080370 to CJ.
Footnotes
Electronic supplementary material The online version of this article (doi:10.1007/s11010-013-1883-4) contains supplementary material, which is available to authorized users.
References
- 1.Bos JL. ras oncogenes in human cancer: a review. Cancer Res. 1989;49(17):4682–4689. [PubMed] [Google Scholar]
- 2.Downward J. Targeting RAS signalling pathways in cancer therapy. Nat Rev Cancer. 2003;3(1):11–22. doi: 10.1038/nrc969. [DOI] [PubMed] [Google Scholar]
- 3.Fernandez-Medarde A, Santos E. Ras in cancer and developmental diseases. Genes Cancer. 2011;2(3):344–358. doi: 10.1177/1947601911411084. [DOI] [PMC free article] [PubMed] [Google Scholar]
- 4.Scheffzek K, et al. The Ras-RasGAP complex: structural basis for GTPase activation and its loss in oncogenic Ras mutants. Science. 1997;277(5324):333–338. doi: 10.1126/science.277.5324.333. [DOI] [PubMed] [Google Scholar]
- 5.Courtney KD, Corcoran RB, Engelman JA. The PI3 K pathway as drug target in human cancer. J Clin Oncol. 2010;28(6):1075–1083. doi: 10.1200/JCO.2009.25.3641. [DOI] [PMC free article] [PubMed] [Google Scholar]
- 6.Kloog Y, Cox AD. RAS inhibitors: potential for cancer therapeutics. Mol Med Today. 2000;6(10):398–402. doi: 10.1016/s1357-4310(00)01789-5. [DOI] [PubMed] [Google Scholar]
- 7.Russo P, et al. Farnesylated proteins as anticancer drug targets: from laboratory to the clinic. Curr Med Chem Anticancer Agents. 2004;4(2):123–138. doi: 10.2174/1568011043482098. [DOI] [PubMed] [Google Scholar]
- 8.Roberts MJ, et al. Hydrophilic anilinogeranyl diphosphate prenyl analogues are Ras function inhibitors. Biochemistry. 2006;45(51):15862–15872. doi: 10.1021/bi061704+. [DOI] [PubMed] [Google Scholar]
- 9.Moores SL, et al. Sequence dependence of protein isoprenylation. J Biol Chem. 1991;266(22):14603–14610. [PubMed] [Google Scholar]
- 10.Roskoski R., Jr Protein prenylation: a pivotal posttranslational process. Biochem Biophys Res Commun. 2003;303(1):1–7. doi: 10.1016/s0006-291x(03)00323-1. [DOI] [PubMed] [Google Scholar]
- 11.Dunten P, et al. Protein farnesyltransferase: structure and implications for substrate binding. Biochemistry. 1998;37(22):7907–7912. doi: 10.1021/bi980531o. [DOI] [PubMed] [Google Scholar]
- 12.Caplin BE, Ohya Y, Marshall MS. Amino acid residues that define both the isoprenoid and CAAX preferences of the Saccharomyces cerevisiae protein farnesyltransferase. Creating the perfect farnesyltransferase. J Biol Chem. 1998;273(16):9472–9479. doi: 10.1074/jbc.273.16.9472. [DOI] [PubMed] [Google Scholar]
- 13.Otto JC, et al. Cloning and characterization of a mammalian prenyl protein-specific protease. J Biol Chem. 1999;274(13):8379–8382. doi: 10.1074/jbc.274.13.8379. [DOI] [PubMed] [Google Scholar]
- 14.Bergo MO, et al. Inactivation of Icmt inhibits transformation by oncogenic K-Ras and B-Raf. J Clin Invest. 2004;113(4):539–550. doi: 10.1172/JCI18829. [DOI] [PMC free article] [PubMed] [Google Scholar]
- 15.Michaelson D, et al. Postprenylation CAAX processing is required for proper localization of Ras but not Rho GTPases. Mol Biol Cell. 2005;16(4):1606–1616. doi: 10.1091/mbc.E04-11-0960. [DOI] [PMC free article] [PubMed] [Google Scholar]
- 16.Cox AD, Der CJ. Ras family signaling: therapeutic targeting. Cancer Biol Ther. 2002;1(6):599–606. doi: 10.4161/cbt.306. [DOI] [PubMed] [Google Scholar]
- 17.Li D, et al. Pancreatic cancer. Lancet. 2004;363(9414):1049–1057. doi: 10.1016/S0140-6736(04)15841-8. [DOI] [PubMed] [Google Scholar]
- 18.Doll RJ, Kirschmeier P, Bishop WR. Farnesyltransferase inhibitors as anticancer agents: critical crossroads. Curr Opin Drug Discov Devel. 2004;7(4):478–486. [PubMed] [Google Scholar]
- 19.Hulko M, et al. The HAMP domain structure implies helix rotation in transmembrane signaling. Cell. 2006;126(5):929–940. doi: 10.1016/j.cell.2006.06.058. [DOI] [PubMed] [Google Scholar]
- 20.Pylayeva-Gupta Y, Grabocka E, Bar-Sagi D. RAS oncogenes: weaving a tumorigenic web. Nat Rev Cancer. 2011;11(11):761–774. doi: 10.1038/nrc3106. [DOI] [PMC free article] [PubMed] [Google Scholar]
- 21.Conroy T, Gavoille C, Adenis A. Metastatic pancreatic cancer: old drugs, new paradigms. Curr Opin Oncol. 2011;23(4):390–395. doi: 10.1097/CCO.0b013e3283473610. [DOI] [PubMed] [Google Scholar]
- 22.Ji B, et al. Ras activity levels control the development of pancreatic diseases. Gastroenterology. 2009;137(3):1072–1082. doi: 10.1053/j.gastro.2009.05.052. [DOI] [PMC free article] [PubMed] [Google Scholar]
- 23.Karp JE. Farnesyl protein transferase inhibitors as targeted therapies for hematologic malignancies. Semin Hematol. 2001;38(3 Suppl 7):16–23. doi: 10.1016/s0037-1963(01)90126-x. [DOI] [PubMed] [Google Scholar]
- 24.VanCutsem E, et al. Phase III trial of gemcitabine plus tipifarnib compared with gemcitabine plus placebo in advanced pancreatic cancer. J Clin Oncol. 2004;20(8):1430–1438. doi: 10.1200/JCO.2004.10.112. [DOI] [PubMed] [Google Scholar]
- 25.Appels NM, Beijnen JH, Schellens JH. Development of farnesyl transferase inhibitors: areview. Oncologist. 2005;10(8):565–578. doi: 10.1634/theoncologist.10-8-565. [DOI] [PubMed] [Google Scholar]
- 26.James GL, Goldstein JL, Brown MS. Polylysine and CVIM sequences of K-RasB dictate specificity of prenylation and confer resistance to benzodiazepine peptidomimetic in vitro. J Biol Chem. 1995;270(11):6221–6226. doi: 10.1074/jbc.270.11.6221. [DOI] [PubMed] [Google Scholar]
- 27.Cox AD, Der CJ. Farnesyltransferase inhibitors and cancer treatment: targeting simply Ras? Biochim Biophys Acta. 1997;1333(1):F51–F71. doi: 10.1016/s0304-419x(97)00011-5. [DOI] [PubMed] [Google Scholar]
- 28.Antonio Mazzocca SG, Andrew Hamilton D, Said Sebti M, Pietro Pantaleo, Vinicio Carloni. Growth inhibition by the farnesyltransferase inhibitor FTI-277 involves Bcl-2 expression and defective association with Raf-1 in liver cancer cell lines. Mol Pharmacol. 2003;63(1):159–166. doi: 10.1124/mol.63.1.159. [DOI] [PubMed] [Google Scholar]
- 29.Fiordalisi JJ, et al. High affinity for farnesyltransferase and alternative prenylation contribute individually to K-Ras4B resistance to farnesyltransferase inhibitors. J Biol Chem. 2003;278(43):41718–41727. doi: 10.1074/jbc.M305733200. [DOI] [PubMed] [Google Scholar]
- 30.Whyte DB, et al. K- and N-Ras are geranylgeranylated in cells treated with farnesyl protein transferase inhibitors. J Biol Chem. 1997;272(22):14459–14464. doi: 10.1074/jbc.272.22.14459. [DOI] [PubMed] [Google Scholar]
- 31.Maltese WA. Posttranslational modification of proteins by isoprenoids in mammalian cells. FASEB J. 1990;4(15):3319–3328. doi: 10.1096/fasebj.4.15.2123808. [DOI] [PubMed] [Google Scholar]
- 32.Andres DA, et al. Rapid identification of cysteine-linked isoprenyl groups by metabolic labeling with [3H]farnesol and [3H]geranylgeraniol. Methods Mol Biol. 1999;116:107–123. doi: 10.1385/1-59259-264-3:107. [DOI] [PubMed] [Google Scholar]
- 33.Gibbs BS, et al. Novel farnesol and geranylgeraniol analogues: a potential new class of anticancer agents directed against protein prenylation. J Med Chem. 1999;42(19):3800–3808. doi: 10.1021/jm9902786. [DOI] [PubMed] [Google Scholar]
- 34.Chehade KA, et al. Design and synthesis of a transferable farnesyl pyrophosphate analogue to Ras by protein farnesyltransferase. J Org Chem. 2000;65(10):3027–3033. doi: 10.1021/jo991735t. [DOI] [PubMed] [Google Scholar]
- 35.Onono FO, et al. A tagging-via-substrate approach to detect the farnesylated proteome using two-dimensional electrophoresis coupled with Western blotting. Mol Cell Proteomics. 2010;9(4):742–751. doi: 10.1074/mcp.M900597-MCP200. [DOI] [PMC free article] [PubMed] [Google Scholar]
- 36.Chang SY, et al. Inhibitors of protein geranylgeranyl-transferase-I lead to prelamin A accumulation in cells by inhibiting ZMPSTE24. J Lipid Res. 2012;53(6):1176–1182. doi: 10.1194/jlr.M026161. [DOI] [PMC free article] [PubMed] [Google Scholar]
- 37.Morgan MA, et al. Modulation of anthracycline-induced cytotoxicity by targeting the prenylated proteome in myeloid leukemia cells. J Mol Med (Berl) 2012;90(2):149–161. doi: 10.1007/s00109-011-0814-7. [DOI] [PubMed] [Google Scholar]
- 38.Yang SH, et al. Progerin elicits disease phenotypes of progeria in mice whether or not it is farnesylated. J Clin Invest. 2008;118(10):3291–3300. doi: 10.1172/JCI35876. [DOI] [PMC free article] [PubMed] [Google Scholar]
- 39.Troutman JM, et al. Tools to analyze protein farnesylation in cells. Bioconjug Chem. 2005;16(5):1209–1217. doi: 10.1021/bc050068+. [DOI] [PubMed] [Google Scholar]
- 40.Kae H, et al. Chemoattractant-induced Ras activation during Dictyostelium aggregation. EMBO Rep. 2004;5:602–606. doi: 10.1038/sj.embor.7400151. [DOI] [PMC free article] [PubMed] [Google Scholar]
- 41.Srinivasan K, et al. Delineating the core regulatory elements crucial for directed cell migration by examining folic-acid-mediated responses. J Cell Sci. 2013;126(Pt 1):221–233. doi: 10.1242/jcs.113415. [DOI] [PMC free article] [PubMed] [Google Scholar]
- 42.Subramanian T, et al. Directed library of anilinogeranyl analogues of farnesyl diphosphate via mixed solid- and solution-phase synthesis. Org Lett. 2005;7(11):2109–2112. doi: 10.1021/ol050386o. [DOI] [PubMed] [Google Scholar]
- 43.Subramanian T, et al. Protein farnesyltransferase-catalyzed isoprenoid transfer to peptide depends on lipid size and shape, not hydrophobicity. ChemBioChem. 2008;9(17):2872–2882. doi: 10.1002/cbic.200800248. [DOI] [PMC free article] [PubMed] [Google Scholar]
- 44.Kortholt A, van Haastert PJ. Highlighting the role of Ras and Rap during Dictyostelium chemotaxis. Cell Signal. 2008;20(8):1415–1422. doi: 10.1016/j.cellsig.2008.02.006. [DOI] [PubMed] [Google Scholar]
- 45.Fischer M, et al. A brilliant monomeric red fluorescent protein to visualize cytoskeleton dynamics in Dictyostelium. FEBS Lett. 2004;577(1-2):227–232. doi: 10.1016/j.febslet.2004.09.084. [DOI] [PubMed] [Google Scholar]
- 46.Cai H, et al. Analysis of chemotaxis in Dictyostelium. Methods Mol Biol. 2012;757:451–468. doi: 10.1007/978-1-61779-166-6_26. [DOI] [PMC free article] [PubMed] [Google Scholar]
- 47.Gatinel D, Haouat M, Hoang-Xuan T. A review of mathematical descriptors of corneal asphericity. J Fr Ophtalmol. 2002;25(1):81–90. [PubMed] [Google Scholar]
- 48.Ayoub AB. The eccentricity of a conic section. Coll Math J. 2003;34(2):116–121. [Google Scholar]
- 49.Troutman JM, et al. Selective modification of CaaX peptides with ortho-substituted anilinogeranyl lipids by protein farnesyl transferase: competitive substrates and potent inhibitors from a library of farnesyl diphosphate analogues. Biochemistry. 2007;46(40):11310–11321. doi: 10.1021/bi700516m. [DOI] [PubMed] [Google Scholar]
- 50.Subramanian T, et al. Protein farnesyltransferase-catalyzed isoprenoid transfer to peptide depends on lipid size and shape, not hydrophobicity. Chembiochem. 2008;9(17):2872–2882. doi: 10.1002/cbic.200800248. [DOI] [PMC free article] [PubMed] [Google Scholar]
- 51.Devreotes P, Janetopoulos C. Eukaryotic chemotaxis: distinctions between directional sensing and polarization. J Biol Chem. 2003;278(23):20445–20448. doi: 10.1074/jbc.R300010200. [DOI] [PubMed] [Google Scholar]
- 52.Williams HP, Harwood AJ. Cell polarity and Dictyostelium development. Curr Opin Microbiol. 2003;6(6):621–627. doi: 10.1016/j.mib.2003.10.008. [DOI] [PubMed] [Google Scholar]
- 53.Bonner JT. Aggregation and differentiation in the cellular slime molds. Annu Rev Microbiol. 1971;25:75–92. doi: 10.1146/annurev.mi.25.100171.000451. [DOI] [PubMed] [Google Scholar]
- 54.Katoh M, et al. Developmental commitment in Dictyostelium discoideum. Eukaryot Cell. 2007;6:2038–2045. doi: 10.1128/EC.00223-07. [DOI] [PMC free article] [PubMed] [Google Scholar]
- 55.Loomis WF. Biochemistry of aggregation in Dictyostelium. A review. Dev Biol. 1979;70(1):1–12. doi: 10.1016/0012-1606(79)90002-2. [DOI] [PubMed] [Google Scholar]
- 56.Kamimura Y, et al. PIP3-independent activation of TorC2 and PKB at the cell’s leading edge mediates chemotaxis. Curr Biol. 2008;18(14):1034–1043. doi: 10.1016/j.cub.2008.06.068. [DOI] [PMC free article] [PubMed] [Google Scholar]
- 57.Sasaki AT, Firtel RA. Spatiotemporal regulation of Ras-GTPases during chemotaxis. Meth Mol Biol. 2009;571:333–348. doi: 10.1007/978-1-60761-198-1_23. [DOI] [PubMed] [Google Scholar]
- 58.Janetopoulos C, et al. Chemoattractant-induced phosphatidylinositol 3,4,5-trisphosphate accumulation is spatially amplified and adapts, independent of the actin cytoskeleton. Proc Natl Acad Sci USA. 2004;101(24):8951–8956. doi: 10.1073/pnas.0402152101. [DOI] [PMC free article] [PubMed] [Google Scholar]
- 59.Janetopoulos C, Devreotes P. Phosphoinositide signaling plays a key role in cytokinesis. J Cell Biol. 2006;174(4):485–490. doi: 10.1083/jcb.200603156. [DOI] [PMC free article] [PubMed] [Google Scholar]
- 60.Crick DC, Andres DA, Waechter CJ. Farnesol is utilized for protein isoprenylation and the biosynthesis of cholesterol in mammalian cells. Biochem Biophys Res Commun. 1995;211(2):590–599. doi: 10.1006/bbrc.1995.1854. [DOI] [PubMed] [Google Scholar]
- 61.Bolourani P, Spiegelman GB, Weeks G. Delineation of the roles played by RasG and RasC in cAMP-dependent signal transduction during the early development of Dictyostelium discoideum. Mol Biol Cell. 2006;17(10):4543–4550. doi: 10.1091/mbc.E05-11-1019. [DOI] [PMC free article] [PubMed] [Google Scholar]
Associated Data
This section collects any data citations, data availability statements, or supplementary materials included in this article.


