Abstract
Background
Various indicators of progression of chronic kidney disease (CKD) have been used as outcomes in clinical research studies. The effect of using varying measures on the association of risk factors with CKD progression has not been well characterized.
Study Design
Prospective cohort study.
Setting & Participants
The Chronic Renal Insufficiency Cohort (CRIC) Study (N=3,939) enrolled men and women with mild to moderate CKD, 48% of whom had diabetes and 42% self-reported black race.
Predictors
Age, race, sex, diabetes, baseline eGFR, proteinuria and other established CKD risk factors.
Outcomes
Death, end-stage renal disease (ESRD) and eGFR events including: 1) eGFR halving; 2) eGFR <15 ml/min/1.73 m2; 3) eGFR halving and <15 ml/min/1.73 m2; 4) eGFR decrease of 20 ml/min/1.73 m2; 5) eGFR halving or decrease of 20 ml/min/1.73 m2 and 6) eGFR decrease of 25% and change of CKD stage.
Results
Mean entry eGFR was 44.9 ml/min/1.73 m2. Annual rates of death, ESRD and eGFR halving were 2.5%, 4.0% and 6.1%, respectively, over an average follow-up of 5.4 years,. The associations between risk factors and ESRD and eGFR events were similar across different definitions. However, these associations were substantially different than those with death. HRs for ESRD, eGFR halving, and death in the highest proteinuria category compared to the lowest category were 11.83 (95% CI, 8.40–16.65), 11.19 (95% CI, 8.53–14.68), and 1.47 (95% CI, 1.10–1.96), respectively.
Limitations
Participants may not be representative of the entire CKD population.
Conclusions
Using ESRD or eGFR events, but not death, in the definition of kidney disease outcomes is appropriate in follow-up studies to identify risk factors for CKD progression.
Index words: kidney disease progression, disease trajectory, longitudinal outcome, ESRD, eGFR, renal function, mortality risk, CKD, CRIC, decreased eGFR
Failure-time analyses are often used in studies to identify risk factors for progression of chronic kidney disease (CKD)1–4. Such analyses often include end-stage renal disease (ESRD) as an outcome, defined as either initiation of dialysis or kidney transplantation. However, the statistical power of failure-time analyses is often limited because of the relatively low incidence of ESRD. Prior studies have reported CKD progression using outcomes that include measures of kidney function5. In a study of African Americans with hypertensive kidney disease, a reduction in eGFR of at least 50% or 25 ml/min/1.73 m2 from baseline was used as part of the outcome3. In clinical trials in patients with diabetic nephropathy, a doubling of the baseline serum creatinine concentration was an outcome6,7. However, the impact of the choice of kidney disease outcomes on the assessment of putative risk factors for CKD progression is uncertain.
At least two issues need to be addressed when defining the study outcomes. Complete ascertainment of kidney disease events based on reductions in kidney function, i.e., eGFR events, requires that this information be obtained continuously throughout follow-up. However, in many cases this is not practical and a number of studies (e.g., the CRIC [Chronic Renal Insufficiency Cohort] Study 8 and AASK [African American Study of Kidney Disease and Hypertension]9) of CKD have measured kidney function at fixed time intervals during follow-up, limiting the ability to observe directly the time at which events based on this measure occur. It is also challenging to analyze data on CKD progression because death is a competing risk for kidney disease outcomes. Although the inclusion of death as a component of composite outcomes of CKD progression addresses the challenge of competing risks, this approach does not disentangle the risk factor associations with death and with kidney disease outcomes. When death is not included in the outcome definition, one needs to properly adjust for death as it may influence the relationship between putative risk factors and kidney disease outcomes.
In this paper, we implemented simple imputation to define eGFR events and examined the association of risk factors with CKD progression characterized in multiple ways. We fit separate models for outcomes based on kidney disease events and death to address two specific questions: 1) are risk factor-outcome associations for CKD progression sensitive to the definition of an event of CKD progression? and 2) are the risk factor-death associations similar to those for various kidney disease outcomes? Our findings may inform the selection of outcome definitions for identifying risk factors for CKD progression in the CRIC Study and future prospective studies of CKD.
Methods
Study Population
The CRIC Study is a multi-center prospective cohort study of racially and ethnically diverse group of adults aged 21 to 74 years at baseline with mild to moderate CKD and diabetes in approximately half. The primary objective of the study is to identify new risk factors for progression of CKD and cardiovascular disease in men and women with CKD. 3939 participants were recruited from clinical centers in Philadelphia, PA, Baltimore, MD, Cleveland, OH, Ann Arbor and Detroit, MI, Chicago, IL, New Orleans, LA, and Oakland, CA from June 2003 through September 2008 and were followed up through annual clinic visits. The study design and detailed description of the cohort have been reported previously8,10,11. Follow-up data were available through March 31, 2011.
Event Ascertainment
We considered the following outcomes of interest ascertained in the CRIC Study: eGFR estimated annually using serum creatinine and cystatin C with a CRIC Study–specific formula12, ESRD including dialysis and kidney transplantation, and death. Death and ESRD were ascertained during follow-up through surveillance by CRIC Study research personnel, the Social Security Death Master File, and the US Renal Data System (USRDS)13.
eGFR Event Definition
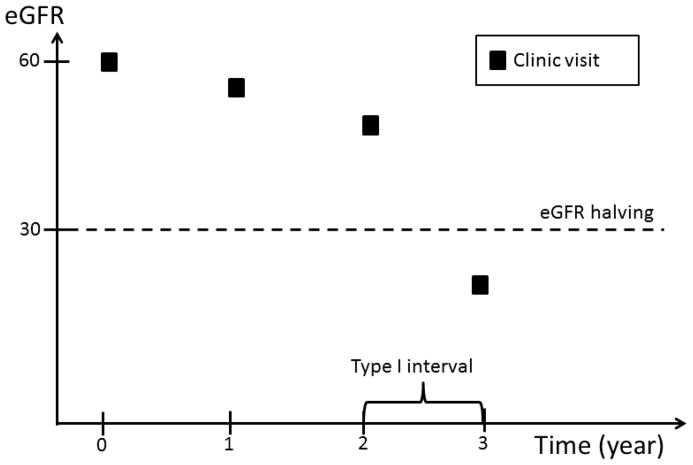
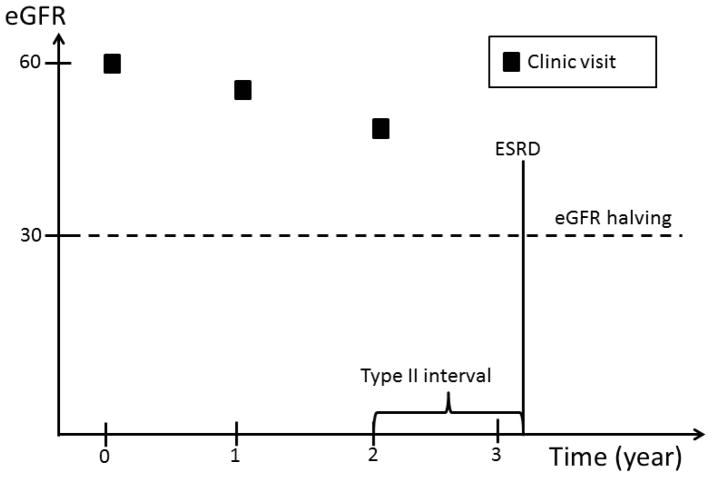
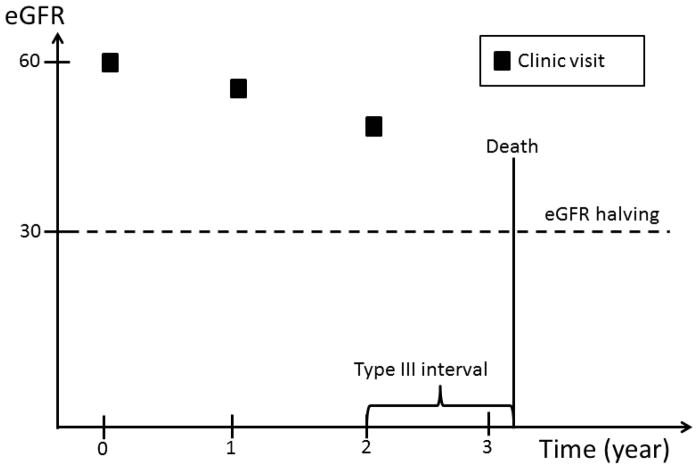
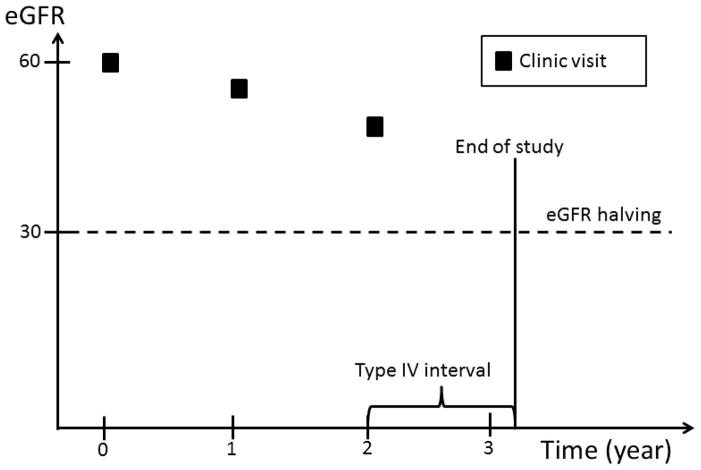
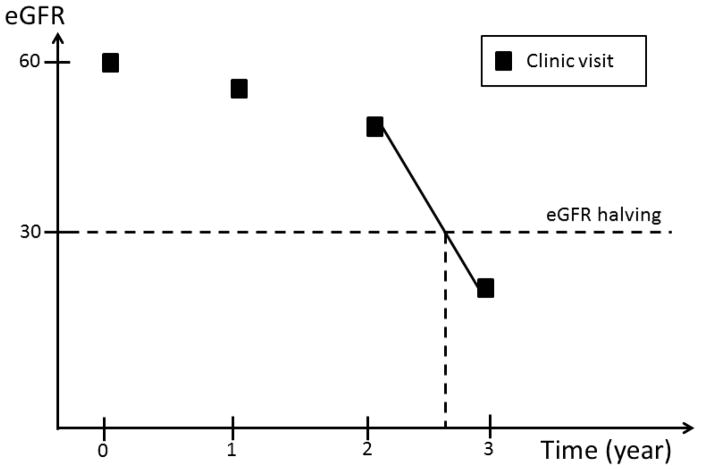
Complete ascertainment of outcomes including eGFR requires that this information be available at any time during the follow-up prior to ESRD or death. However, since eGFR was determined at fixed time intervals, we implemented an ad hoc approach to impute the timing of the occurrence of eGFR events. Four types of time intervals during which an eGFR event could occur are possible (Figure 1): 1) an interval bracketed by two clinic visits; 2) an interval bracketed by a clinic visit and an ESRD event; 3) an interval bracketed by participants’ last clinic visit and death, and 4) an interval bracketed by participants’ last clinic visit and the end of the follow up period, which may be either the date of withdrawal from the study or the cutoff date for the analyses.
Figure 1.
An eGFR halving event can occur in a time interval bracketed by: two clinic visits; a clinic visit and an ESRD event; a participants’ last clinic visit and death; or a participants’ last clinic visit and the end of the follow up period, which may be either the date of withdrawal from the study or the cutoff date for the analyses.
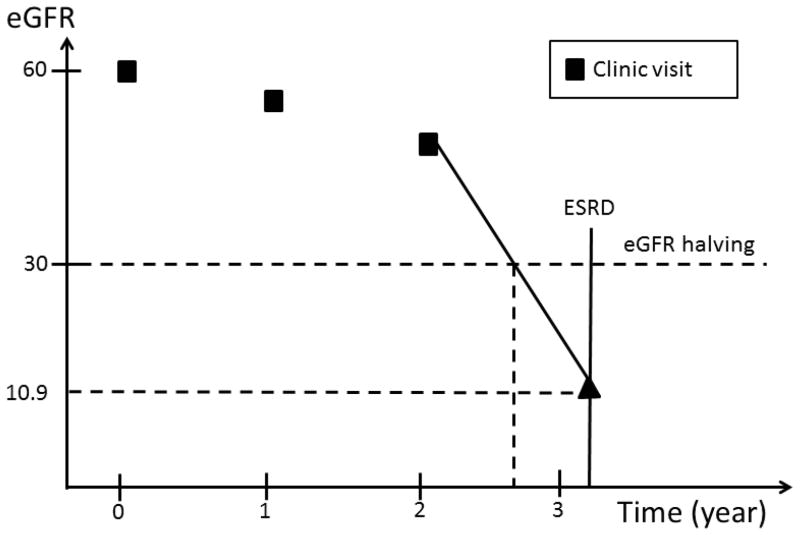
In the first type of interval, eGFR values are available on both sides of the interval. Similarly, in the second type of interval, even though an exact eGFR value is not available on the right side of the interval, the occurrence of ESRD can be used to estimate the eGFR level at the time of ESRD. In contrast, no eGFR value is available after participants’ last clinic visits through the end of the interval in the third and fourth type of intervals. In the first type of interval, we assumed eGFR changed linearly over time within the interval. If, at the end of the interval, eGFR had fallen to or below the level required to meet the definition of an eGFR event, the timing of the event’s occurrence was estimated by drawing a straight line within the interval (Figure 2a). In the second type of interval, we assumed that the eGFR value at the time of ESRD was 10.9 ml/min/1.73 m2, the average eGFR value at the time of initiation of hemodialysis reported in the USRDS in the U.S. population within the same age group as CRIC participants. The exact time of an eGFR event was then calculated in the same way as in the first type of interval (Figure 2b). In the third and fourth type of intervals, no eGFR information was available after a study participant’s last clinic visit. We, therefore, censored participants at their last clinic visit without imputation of the eGFR values beyond their last clinic visit.
Figure 2.
eGFR imputation in the first and second type of intervals. In the former, the time of eGFR halving is estimated by drawing a line between the two eGFR values; in the latter, the eGFR value at the time of ESRD is imputed as 10.9 ml/min/1.73 m2 and the time of eGFR halving is then estimated the same way as in the first example.
Outcomes
We defined six kidney disease events based on loss of kidney function (eGFR): 1) a decrease in eGFR of one-half from baseline, 2) a decrease in eGFR to <15 ml/min/1.73m2, 3) a decrease in eGFR of one-half from baseline and to <15ml/min/1.73 m2, 4) a decrease in eGFR by 20 ml/min/1.73m2 from baseline, 5) a decrease in eGFR by one-half from baseline or a decrease of 20 ml/min/1.73m2, and 6) a decrease in eGFR of 25% from baseline and a change of CKD stage. In each of the six eGFR event definitions, we included participants who reached ESRD without having experienced an eGFR event. For example, participants who had an eGFR value of less than 21.8 ml/min/1.73m2 at baseline and reached ESRD (with an imputed eGFR of 10.9 ml/min/1.73 m2) during follow-up would not experience an eGFR halving event, but were included in the eGFR halving event definition. A total of eight, a priori defined possible outcomes were evaluated, including death, ESRD and each of the six eGFR events noted above.
Risk Factors
We examined a number of established risk factors for CKD progression measured at baseline including age, race, gender, diabetes, eGFR, 24 hour urine protein excretion, ankle-brachial index, uric acid, self-reported history of cardiovascular disease (CVD), body mass index (BMI), hypertension, hemoglobin value, level of education and smoking status. Diabetes was defined as either a fasting glucose value ≥126 mg/dl or random glucose value ≥200 mg/dl, or use of insulin or antidiabetic medications. Risk factors with continuous measures were divided into categories based either on clinically relevant cut-points or statistical distributions, e.g., tertiles.
Statistical Analyses
Baseline characteristics of the cohort were described using frequencies and percentages for categorical variables and means (standard deviations) or median (interquartile range) for continuous variables, stratified by baseline CKD stages. The eight outcomes were described in terms of count and rate per 100 person years of follow-up among all CRIC participants and stratified by age categories.
We used multivariable Cox proportional hazards models 14 to estimate the associations of risk factors with each of the outcomes, adjusting for all of the other risk factors listed above. Multivariable adjusted hazard ratios (HR) and 95% confidence intervals (CIs) for age, gender, race, baseline diabetes status, eGFR and proteinuria were plotted and qualitatively compared across different outcomes.
For the outcome of death alone, participants who were alive were censored at the cutoff date or the date of withdrawal, whichever occurred first. When the outcome was ESRD, participants not experiencing an ESRD event were censored at the cutoff date, death or withdrawal, whichever occurred first. When the outcome was one of the six eGFR events, participants without an event were censored at the cutoff date, their last clinic visit or withdrawal, whichever occurred first.
All analyses were performed using SAS 9.3 (SAS Institute Inc).
Results
Study Participants and Baseline Characteristics
A total of 3939 men and women were enrolled in the CRIC Study (Table 1). Mean age was 58.2 ± 11.0 (standard deviation) years with 29% of participants older than 65 years. Forty-two percent were black and 45% were female. Forty-eight percent of the participants had diabetes. The mean eGFR at baseline was 44.9 ± 16.8 ml/min/1.73 m2. The median 24-hour urine protein excretion at study entry was 0.18 (interquartile range, 0.07–0.91) g. The mean duration of follow-up was approximately 5.4 years.
Table 1.
Baseline demographic and clinical characteristics of study participants
| Characteristic | Total (N=3939) | eGFR ≥60 (n=702) | eGFR 45–<60 (n=1091) | eGFR 30–<45 (n=1339) | eGFR <30 (n=807) |
|---|---|---|---|---|---|
| Age (y) | 58.2 (11.0) | 53.4 (10.7) | 58.8 (10.6) | 59.7 (10.9) | 58.9 (10.9) |
| Age Category | |||||
| 21–45 y | 539 (14%) | 181 (26%) | 121 (11%) | 151 (11%) | 86 (11%) |
| 45–65 y | 2260 (57%) | 472 (67%) | 656 (60%) | 685 (51%) | 447 (55%) |
| ≥65 y | 1140 (29%) | 49 (7%) | 314 (29%) | 503 (38%) | 274 (34%) |
| Race | |||||
| White | 1824 (46%) | 379 (54%) | 523 (48%) | 590 (44%) | 332 (41%) |
| Black | 1658 (42%) | 260 (37%) | 442 (415%) | 584 (44%) | 372 (46%) |
| Other | 457 (12%) | 63 (9%) | 126 (12%) | 165 (12%) | 103 (13%) |
| Sex | |||||
| Female | 1778 (45%) | 305 (43%) | 441 (40%) | 627 (47%) | 405 (50%) |
| Male | 2161 (55%) | 397 (57%) | 650 (60%) | 712 (53%) | 402 (50%) |
| eGFR | 44.9 (16.8) | 71.9 (10.8) | 51.9 (4.4) | 37.5 (4.2) | 24.3 (3.8) |
| Proteinuria Category | |||||
| <0.10 g/d | 1365 (37%) | 375 (57%) | 459 (44%) | 401 (32%) | 130 (17%) |
| 0.10 – <0.50 g/d | 1084 (29%) | 201 (31%) | 326 (31%) | 352 (28%) | 205 (27%) |
| 0.50 – <1.50 g/d | 578 (16%) | 48 (7%) | 134 (13%) | 230 (18%) | 166 (22%) |
| ≥1.50 g/d | 681 (18%) | 33 (5%) | 123 (12%) | 278 (22%) | 247 (33%) |
| Diabetes | 1907 (48%) | 200 (29%) | 491 (45%) | 737 (55%) | 479 (59%) |
| Education | |||||
| Less than HS | 828 (21%) | 53 (8%) | 184 (17%) | 341 (26%) | 250 (31%) |
| HS or some post-HS | 1887 (48%) | 301 (43%) | 543 (50%) | 647 (48%) | 396 (49%) |
| College graduate or more | 1223 (31%) | 347 (50%) | 364 (33%) | 351 (26%) | 161 (20%) |
| Current smoker | 517 (13%) | 70 (10%) | 124 (11%) | 182 (14%) | 141 (18%) |
| BMI (kg/m2) | 32.1 (7.8) | 30.3 (6.5) | 32.0 (7.7) | 32.8 (7.9) | 32.6 (8.6) |
| Hypertension | 3391 (86%) | 462 (66%) | 965 (89%) | 1216 (91%) | 748 (93%) |
| CVD history | 1316 (33%) | 122 (17%) | 330 (30%) | 507 (38%) | 357 (44%) |
| Ankle brachial index | 1.0 (0.2) | 1.1 (0.1) | 1.1 (0.2) | 1.0 (0.2) | 1.0 (0.2) |
| CBC hemoglobin (g/dL) | 12.6 (1.8) | 13.6 (1.5) | 13.0 (1.7) | 12.3 (1.7) | 11.7 (1.7) |
| Uric acid (mg/dL) | 7.4 (1.9) | 6.2 (1.6) | 7.1 (1.7) | 7.8 (1.8) | 8.3 (2.0) |
Note: eGFRs expressed in mL/min/1.73 m2. Values for categorical variables are given as number (percentage); values for continuous variables are given as mean ± standard deviation.
HS, high school; eGFR, estimated glomerular filtration rate; CVD, cardiovascular disease; BMI, body mass index; CBC, complete blood count;
Event Rates
Six hundred and one participants died (2.8 per 100 person-years of follow-up) and 753 reached ESRD (3.9 per 100 person-years of follow-up). The rate of eGFR halving was 6.1 per 100 person-years of follow-up. The rates of other eGFR events ranged from 5.1–12.5 per 100 person-years of follow-up (Table 2).
Table 2.
Incidence rates for outcomes overall and stratified by age
| Type of outcomes | Overall | Age 21–44 y | Age 45–64 y | Age ≥65 y |
|---|---|---|---|---|
| Death | 601 (2.8) | 32 (1.0) | 302 (2.5) | 267 (4.5) |
| ESRD | 753 (3.9) | 142 (5.3) | 432 (3.9) | 179 (3.2) |
| eGFR halving from baseline | 988 (6.1) | 174 (8.3) | 575 (6.1) | 239 (5.1) |
| eGFR <15 | 886 (5.4) | 156 (7.3) | 510 (5.4) | 220 (4.8) |
| eGFR halving from baseline and <15 | 841 (5.1) | 155 (7.2) | 483 (5.0) | 203 (4.3) |
| eGFR decrease of 20 from baseline | 1135 (7.2) | 195 (9.5) | 686 (7.5) | 254 (5.5) |
| eGFR halving or decrease of 20 from baseline | 1193 (7.7) | 203 (10.2) | 715 (7.9) | 275 (6.1) |
| eGFR 25% decline from baseline and change of CKD stage | 1682 (12.5) | 233 (13.0) | 979 (12.5) | 470 (12.3) |
Note: Values are given as number of events (rate per 100 person-y of follow-up). eGFRs expressed in mL/min/1.73 m2.
CKD, chronic kidney disease; eGFR, estimated glomerular filtration rate; ESRD, end-stage renal disease
Associations of Risk Factors With Death
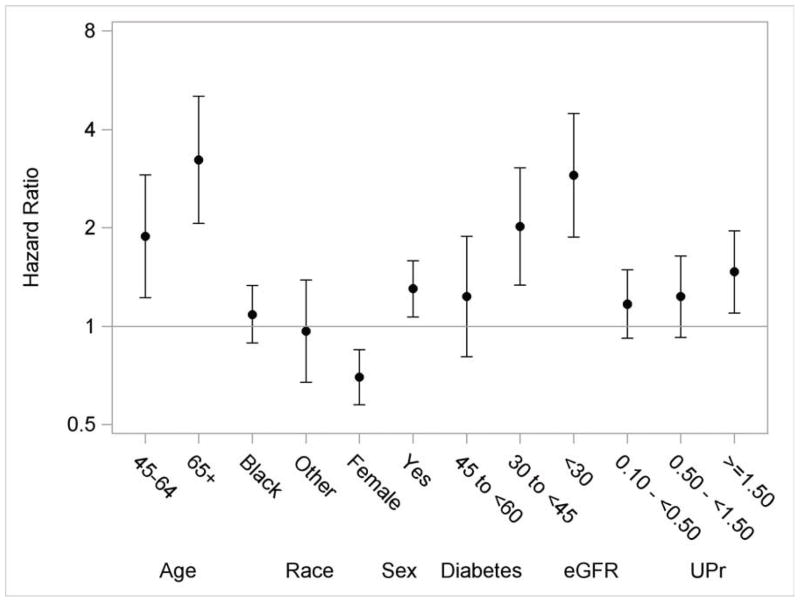
The multivariable adjusted associations of risk factors with death are shown in figure 3. Older age was associated with higher risk of death (e.g., age >65 vs. <45 years: HR, 3.23; 95% CI, 2.06–5.04) (Table 3). Females had a lower death rate (HR, 0.70; 95% CI, 0.58–0.85). There was no statistically significant difference in the rate of death among white, black, and other race/ethnicity categories. The rate of death was higher in participants with diabetes (HR, 1.30; 95% CI, 1.07–1.58). Lower eGFR value (e.g., <30 vs. >60 ml/min/1.73 m2: HR, 2.90; 95% CI, 1.87–4.48) and higher proteinuria levels (e.g., >1.5 vs. <0.1 g/d: HR, 1.47; 95% CI, 1.10–1.96) were associated with an increased rate of death.
Figure 3.
Multivariable adjusted hazard ratios and 95% confidence intervals for death. The reference groups are 21–44 years for age, white for race and male for gender. Y-axis was plotted in natural log scale with labels in the original scale. Models additionally included ankle-brachial index, uric acid, history of CVD, BMI, hypertension, hemoglobin, education and smoking status.
Table 3.
Multivariable adjusted HRs for proportional hazards model for death, ESRD, and eGFR halving from baseline.
| Risk factor Category | Death | ESRD | eGFR halving |
|---|---|---|---|
| Age | |||
| 45–64 | 1.88 (1.22, 2.90) | 0.69 (0.55, 0.86) | 0.74 (0.61, 0.90) |
| ≥65 | 3.23 (2.06, 5.04) | 0.55 (0.42, 0.72) | 0.62 (0.49, 0.79) |
| Female sex | 0.70 (0.58, 0.85) | 0.83 (0.71, 0.99) | 0.94 (0.81, 1.08) |
| Race | |||
| Black | 1.09 (0.89, 1.33) | 1.55 (1.29, 1.86) | 1.43 (1.22, 1.68) |
| Other | 0.97 (0.67, 1.38) | 1.52 (1.17, 1.98) | 1.44 (1.14, 1.82) |
| Diabetes | 1.30 (1.07, 1.58) | 1.24 (1.04, 1.49) | 1.46 (1.25, 1.70) |
| eGFR | |||
| 45–<60 | 1.23 (0.81, 1.88) | 3.97 (1.81, 8.72) | 2.73 (1.76, 4.23) |
| 30–<45 | 2.02 (1.33, 3.05) | 11.65 (5.43, 24.98) | 4.74 (3.08, 7.29) |
| <30 | 2.90 (1.87, 4.48) | 34.71 (16.08, 74.95) | 10.14 (6.52, 15.77) |
| 24-h urine protein | |||
| 0.10–<0.50 g/d | 1.17 (0.92, 1.48) | 1.89 (1.32, 2.72) | 1.80 (1.36, 2.39) |
| 0.50–<1.50 g/d | 1.23 (0.92, 1.64) | 4.65 (3.28, 6.60) | 4.66 (3.53, 6.14) |
| ≥1.50 g/d | 1.47 (1.10, 1.96) | 11.83 (8.40, 16.65) | 11.19 (8.53, 14.68) |
Note: Values shown as HR (95% confidence interval). All models were adjusted for ankle-brachial index, uric acid, history of cardiovascular disease, body mass index, hypertension, hemoglobin, education and smoking status at baseline. eGFRs expressed in mL/min/1.73 m2.
eGFR, estimated glomerular filtration rate; ESRD, end-stage renal disease; HR, hazard ratio
Associations of Risk Factors With ESRD
Older age was associated with a lower rate of ESRD (e.g., age>65 vs. <45 years: HR, 0.55; 95% CI, 0.42–0.72) (Table 3). Females had a lower rate of ESRD (HR, 0.83; 95% CI, 0.71–0.99). Black participants and those of other race/ethnicity were more likely to experience ESRD than whites. The HRs for ESRD among blacks and those of other races/ethnicity compared to whites were 1.55 (95% CI, 1.29–1.86) and 1.52 (95% CI, 1.17–1.98), respectively.
Both baseline eGFR and proteinuria were strong predictors of ESRD. For example, the rate of ESRD associated with an eGFR <30 ml/min/1.73m2 at study entry was 35-fold higher (HR, 34.71; 95% CI, 16.08–74.95) compared to that in persons whose eGFR was >60 ml/min/1.73m2. Among participants with proteinuria >1.5 g/d at baseline, the rate of ESRD was also more than 10-fold higher than among participants whose proteinuria level was <0.1 g/d (HR, 11.83; 95% CI, 8.40–16.65).
Associations of Risk Factors With eGFR Events
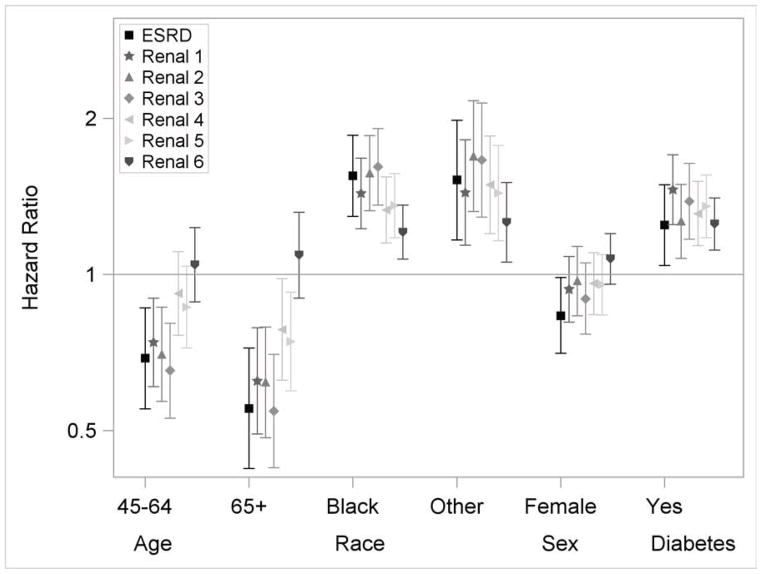
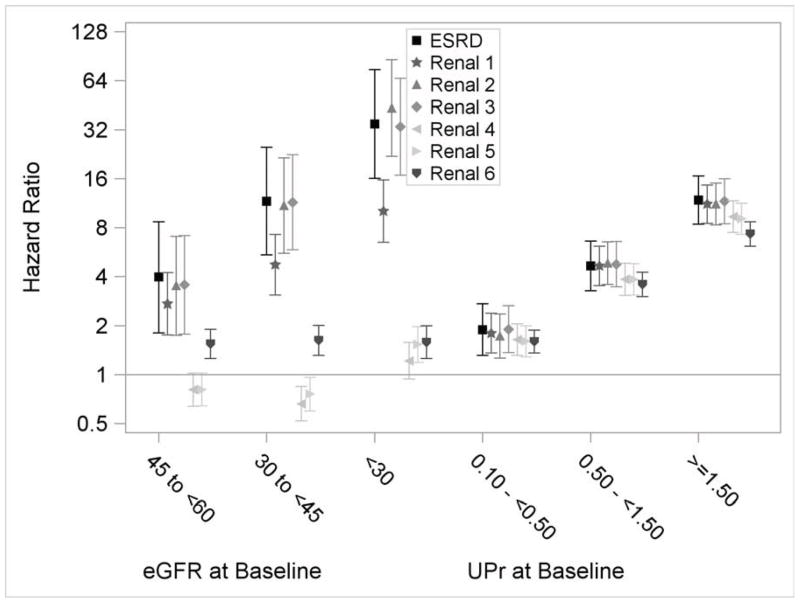
The associations of risk factors with outcomes defined by eGFR events were similar to those seen for the ESRD outcome, except for baseline eGFR (Figure 4a and 4b; Table S1, available as online supplementary material). The associations of baseline eGFR with outcomes varied by the eGFR event definition (Figure 4b). For example, the associations of baseline eGFR with eGFR<15 ml/min/1.73m2 and eGFR halving and <15 ml/min/1.73m2 were similar to the outcome of ESRD alone. However, its associations with the other outcomes were much attenuated. There were also trends that the risk factor outcome associations were attenuated with outcomes based on smaller eGFR decline. For example, for the outcome of eGFR decrease of 25% from baseline with a change of CKD stage, the HR was 7.32 (95% CI, 6.14–8.71) comparing the highest to lowest proteinuria categories, compared to an HR of 11.64 (95% CI, 8.48–15.99) for the outcome of eGFR halving and <15 ml/min/1.73m2. Similar attenuations were also observed for the outcomes of eGFR decrease of 20 ml/min/1.73m2, and eGFR halving or decrease of 20 ml/min/1.73m2.
Figure 4.
Multivariable adjusted hazard ratios and 95% confidence intervals for eGFR events. Renal 1: eGFR halving from baseline. Renal 2: GFR<15 ml/min/1.73m2. Renal 3: eGFR halving from baseline and <15 ml/min/1.73m2. Renal 4: eGFR decrease of 20 ml/min/1.73m2 from baseline. Renal 5: eGFR halving or decrease of 20 ml/min/1.73m2 from baseline. Renal 6: eGFR decrease of 25% from baseline and change of CKD stage. The reference groups are 21–44 years for age, white for race and male for gender. Y-axis was plotted in natural log scale with labels in the original scale. Models additionally included ankle-brachial index, uric acid, history of CVD, BMI, hypertension, hemoglobin, education and smoking status.
Discussion
A wide variety of outcomes, either singly or in combination, have been used in studies to characterize progression of CKD, including measures of kidney function, initiation of renal replacement therapy (maintenance hemodialysis or kidney transplantation), and death. The relationship of the outcomes that include different levels of kidney function decline and the association with putative risk factors for CKD has been infrequently reported. Using a large, ethnically and racially diverse cohort of men and women with CKD with a relatively broad range of kidney function (as assessed by eGFR), we showed that the associations of risk factors, other than baseline eGFR level, did not vary significantly across different kidney disease outcome definitions. We empirically showed that kidney disease outcomes and death had substantially different risk factor profiles in this cohort of persons with CKD.
The associations of baseline eGFR with outcomes defined by eGFR events varied with the choice of the eGFR event definition. For example, the association of baseline eGFR and eGFR halving was attenuated compared to its association with ESRD. Further attenuation was observed when the outcome was a reduction in eGFR by more than 20 ml/min/1.73 m2. This resulted from the way eGFR events were defined. For example, participants whose eGFR values were higher at baseline (e.g., eGFR >50 ml/min/1.73m2) were much more likely to experience an eGFR halving event than an ESRD event. We speculated that participants with low eGFR values at baseline (e.g., eGFR <35 ml/min/1.73m2) would have a higher risk of ESRD than eGFR halving because of the reduced opportunity to experience eGFR halving prior to the occurrence of ESRD. Consistent with this hypothesis, we observed a much higher HR for ESRD than eGFR halving when comparing study participants with low baseline eGFR to those with high baseline eGFR values. When baseline eGFR is included as a covariate rather than a primary exposure of interest, the variation of its association with different outcome definitions is less consequential. However, if level of kidney function is a primary exposure of interest, then the choice of kidney disease outcomes should be informed by these observed patterns.
The associations of risk factors with kidney disease outcomes are attenuated as the eGFR threshold that was used to define the event becomes less restrictive. For example, the HR of CKD progression decreased from nearly 12 to 7 comparing the highest levels of proteinuria to the lowest levels when the kidney disease outcome changed from eGFR halving to a 25% eGFR decline accompanied by a change of CKD stage. One explanation for the attenuation is that the false positive rate of true CKD progression increases as the criteria to achieve an eGFR event are relaxed. Misclassification of kidney disease outcomes can also occur as a result of random variation in eGFR levels, which may not be a true reflection of biological change associated with progression of CKD. Although use of a less restrictive eGFR threshold to define outcomes increases the number of events and the power of the study, this gain in power is offset because of a reduction in effect size likely caused by the greater misclassification in defining outcomes.
We empirically showed that kidney disease outcomes and death have different risk factor profiles. Thus, in analyses in which the goal is to gain an understanding of the associations or effects of risk factors on kidney disease outcomes, death should not be included in a composite with kidney disease outcomes. Instead, death can be treated as a censoring event when fitting standard Cox proportional hazards models of kidney disease outcomes. This approach isolates the association of a given risk factor on kidney disease outcomes from its association on mortality, and so is appropriate for identifying risk factors for CKD progression. In addition, when there are a priori reasons to believe that the exposures of interest are strongly correlated with death, measures of association (e.g., HRs) for death should also be reported alongside those for kidney disease outcomes. Knowledge of these kidney- and mortality-specific HRs also allows one to calculate the cumulative incidence of kidney disease outcomes when that is desired. Alternatively, a competing risk model proposed by Fine et al 15 allows for direct estimation of the effect of risk factors on the cumulative incidence of kidney disease outcomes with proper adjustment for death events.
There are a few limitations of this study. First, the study population in the CRIC Study is not a random sample of the CKD population, and so the findings from this study may not be generalizable to other CKD cohorts. Second, some eGFR events were defined with respect to the baseline eGFR values, e.g., eGFR halving from baseline. It is possible that the findings may be different in other CKD cohorts if the distribution of baseline eGFR is different. Third, we selected only a few established CKD risk factors to compare their associations with different outcomes. It is possible that some CKD risk factors may have different associations with different kidney disease outcome definitions. The set of risk factors included in the current analysis represents a broad range of risk factor-outcome relationships. While it is not anticipated that substantially different findings across kidney disease outcome definitions will be obtained when examining risk factors beyond those studied, we cannot fully rule this out.
In summary, we demonstrated that the associations between various risk factors and kidney disease outcomes were largely similar across different event definitions. However, associations of these risk factors with death were substantially different than for kidney disease outcomes in the CRIC Study. Therefore, use of eGFR events, but not death, as kidney disease outcomes is appropriate in follow-up studies to identify risk factors for CKD progression.
Supplementary Material
Acknowledgments
The CRIC Study Investigators additionally include Lawrence J. Appel, MD, MPH, Alan S. Go, MD, and Raymond R. Townsend, MD
Support: Funding for the CRIC Study was obtained under a cooperative agreement from the National Institute of Diabetes and Digestive and Kidney Diseases (grants U01DK060990, U01DK060984, U01DK061022, U01DK061021, U01DK061028, U01DK060980, U01DK060963, and U01DK060902). In addition, this work was supported in part by the Perelman School of Medicine at the University of Pennsylvania Clinical and Translational Science Award (National Institutes of Health [NIH]/National Center for Advancing Translational Sciences [NCATS] grants UL1TR000003, K01DK092353), Johns Hopkins University (grant UL1 TR-000424), University of Maryland (grant GCRC M01 RR-16500), Clinical and Translational Science Collaborative of Cleveland (grant UL1TR000439 from the NIH/NCATS and NIH roadmap for Medical Research), Michigan Institute for Clinical and Health Research (grant UL1TR000433), University of Illinois at Chicago Clinical and Translational Science Awards (grant UL1RR029879), Tulane University Translational Research in Hypertension and Renal Biology (grant P30GM103337), and Kaiser Permanente (NIH/National Center for Research Resources University of California, San Francisco–Clinical and Translational Science Institute grant UL1 RR-024131.
Financial Disclosure: The authors declare that they have no other relevant financial interests.
Footnotes
Table S1: Multivariable adjusted HRs for proportional hazards model for other outcomes.
Note: The supplementary material accompanying this article (doi:_______) is available at www.ajkd.org
Descriptive Text for Online Delivery of Supplementary Material
Supplementary Table S1 (PDF)
Multivariable adjusted HRs for proportional hazards model for other outcomes.
Publisher's Disclaimer: This is a PDF file of an unedited manuscript that has been accepted for publication. As a service to our customers we are providing this early version of the manuscript. The manuscript will undergo copyediting, typesetting, and review of the resulting proof before it is published in its final citable form. Please note that during the production process errors may be discovered which could affect the content, and all legal disclaimers that apply to the journal pertain.
References
- 1.Wright JT, Jr, Bakris G, Greene T, et al. Effect of blood pressure lowering and antihypertensive drug class on progression of hypertensive kidney disease: results from the AASK trial. JAMA. 2002 Nov 20;288(19):2421–2431. doi: 10.1001/jama.288.19.2421. [DOI] [PubMed] [Google Scholar]
- 2.Klahr S, Levey AS, Beck GJ, et al. The effects of dietary protein restriction and blood-pressure control on the progression of chronic renal disease. Modification of Diet in Renal Disease Study Group. The New England journal of medicine. 1994 Mar 31;330(13):877–884. doi: 10.1056/NEJM199403313301301. [DOI] [PubMed] [Google Scholar]
- 3.Agodoa LY, Appel L, Bakris GL, et al. Effect of ramipril vs amlodipine on renal outcomes in hypertensive nephrosclerosis: a randomized controlled trial. JAMA. 2001 Jun 6;285(21):2719–2728. doi: 10.1001/jama.285.21.2719. [DOI] [PubMed] [Google Scholar]
- 4.Levey AS, Greene T, Beck GJ, et al. Dietary protein restriction and the progression of chronic renal disease: what have all of the results of the MDRD study shown? Modification of Diet in Renal Disease Study group. Journal of the American Society of Nephrology. 1999 Nov;10(11):2426–2439. doi: 10.1681/ASN.V10112426. [DOI] [PubMed] [Google Scholar]
- 5.Wang X, Lewis J, Appel L, et al. Validation of creatinine-based estimates of GFR when evaluating risk factors in longitudinal studies of kidney disease. Journal of the American Society of Nephrology. 2006 Oct;17(10):2900–2909. doi: 10.1681/ASN.2005101106. [DOI] [PubMed] [Google Scholar]
- 6.Brenner BM, Cooper ME, de Zeeuw D, et al. Effects of losartan on renal and cardiovascular outcomes in patients with type 2 diabetes and nephropathy. The New England journal of medicine. 2001 Sep 20;345(12):861–869. doi: 10.1056/NEJMoa011161. [DOI] [PubMed] [Google Scholar]
- 7.Lewis EJ, Hunsicker LG, Clarke WR, et al. Renoprotective effect of the angiotensin-receptor antagonist irbesartan in patients with nephropathy due to type 2 diabetes. The New England journal of medicine. 2001 Sep 20;345(12):851–860. doi: 10.1056/NEJMoa011303. [DOI] [PubMed] [Google Scholar]
- 8.Feldman HI, Appel LJ, Chertow GM, et al. The Chronic Renal Insufficiency Cohort (CRIC) Study: Design and Methods. Journal of the American Society of Nephrology. 2003 Jul;14(7 Suppl 2):S148–153. doi: 10.1097/01.asn.0000070149.78399.ce. [DOI] [PubMed] [Google Scholar]
- 9.Appel LJ, Middleton J, Miller ER, 3rd, et al. The rationale and design of the AASK cohort study. Journal of the American Society of Nephrology: JASN. 2003 Jul;14(7 Suppl 2):S166–172. doi: 10.1097/01.asn.0000070081.15137.c0. [DOI] [PubMed] [Google Scholar]
- 10.Lash JP, Go AS, Appel LJ, et al. Chronic Renal Insufficiency Cohort (CRIC) Study: baseline characteristics and associations with kidney function. Clinical journal of the American Society of Nephrology: CJASN. 2009 Aug;4(8):1302–1311. doi: 10.2215/CJN.00070109. [DOI] [PMC free article] [PubMed] [Google Scholar]
- 11.Fischer MJ, Go AS, Lora CM, et al. CKD in Hispanics: Baseline characteristics from the CRIC (Chronic Renal Insufficiency Cohort) and Hispanic-CRIC Studies. American journal of kidney diseases: the official journal of the National Kidney Foundation. 2011 Aug;58(2):214–227. doi: 10.1053/j.ajkd.2011.05.010. [DOI] [PMC free article] [PubMed] [Google Scholar]
- 12.Anderson AH, Yang W, Hsu CY, et al. Estimating GFR among participants in the Chronic Renal Insufficiency Cohort (CRIC) Study. American journal of kidney diseases: the official journal of the National Kidney Foundation. 2012 Aug;60(2):250–261. doi: 10.1053/j.ajkd.2012.04.012. [DOI] [PMC free article] [PubMed] [Google Scholar]
- 13.USRDS: the United States Renal Data System. American journal of kidney diseases: the official journal of the National Kidney Foundation. 2003 Dec;42(6 Suppl 5):1–230. [PubMed] [Google Scholar]
- 14.Cox DR. Regression Models and Life-Tables. J Roy Stat Soc B. 1972;34(2):187. [Google Scholar]
- 15.Fine JP, Gray RJ. A proportional hazards model for the subdistribution of a competing risk. J Am Stat Assoc. 1999 Jun;94(446):496–509. [Google Scholar]
Associated Data
This section collects any data citations, data availability statements, or supplementary materials included in this article.


