

Abstract
Pre-stimulus α power has been shown to correlate with the behavioral accuracy of perceptual decisions. In most cases, these correlations have been observed by comparing α power for different behavioral outcomes (e.g. correct vs incorrect trials). In this paper we investigate such covariation within the context of behaviorally-latent fluctuations in task-relevant post-stimulus neural activity. Specially we consider variations of pre-stimulus α power with post-stimulus EEG components in a two alternative forced choice visual discrimination task. EEG components, discriminative of stimulus class, are identified using a linear multivariate classifier and only the variability of the components for correct trials (regardless of stimulus class, and for nominally identical stimuli) are correlated with the corresponding pre-stimulus α power. We find a significant relationship between the mean and variance of the pre-stimulus α power and the variation of the trial-to-trial magnitude of an early post-stimulus EEG component. This relationship is not seen for a later EEG component that is also discriminative of stimulus class and which has been previously linked to the quality of evidence driving the decision process. Our results suggest that early perceptual representations, rather than temporally later neural correlates of the perceptual decision, are modulated by pre-stimulus state.
Keywords: decision-making, sensory encoding, single-trial, alpha power, electroencephalogram (EEG)
1. Introduction
Perceptual decision making is often described as the simplest form of a cognitive process, in that it involves transforming sensory evidence into a decision and behavioral response (Heekeren et al., 2004; Smith and Ratcliff, 2004; Gold and Shadlen, 2007). Substantial work has looked to identify and characterize the neural processes underlying perceptual decision making, with a focus on the neural correlates of processes that occur post-stimulus. For instance, experiments in non-human primates have shown neurons in the lateral intraparietal area (LIP) demonstrate activity indicative of evidence accumulation (Shadlen and Newsome, 2001; Gold and Shadlen, 2007; Liu and Pleskac, 2011). Analogous studies using neuroimaging in humans have focused on, amongst other areas, dorsal lateral prefrontal cortex (dLPFC) functioning as a comparator of decision alternatives (Heekeren et al., 2004, 2006; Philiastides et al., 2011; Ostwald et al., 2012).
Not all aspects of a perceptual decision are characterized by the post-stimulus activity. The state of the subject prior to stimulus presentation is also a factor in understanding how the perceptual decision evolves. Several groups have measured pre-stimulus oscillatory activity as a way to index the state of the subject prior to the presentation of the stimulus. Pre-stimulus oscillations in the α band (8-12 Hz) have been shown to correlate with visual discrimination performance (Babiloni et al., 2006; Thut et al., 2006; Hanslmayr et al., 2007; Van Dijk et al., 2008; Hanslmayr et al., 2011). Pre-stimulus power is hypothesized to reflect top-down control of attention (Wyart and Tallon-Baudry, 2009) with increased pre-stimulus α power representing a low attentional state resulting in reduced decision accuracy. Recent studies have shown a correlation between pre-stimulus α power and subjective rating of attention toward a visual discrimination task (Macdonald et al., 2011). Pre-stimulus α phase has also shown to be predictive of visual awareness and perception (Busch et al., 2009; Mathewson et al., 2009).
Studies using electroencephalography (EEG) and magnetoencephalography (MEG) investigating pre-stimulus α within the context of perceptual decision making typically analyze data with respect to behavioral responses–e.g. segregating correct and error trials and characterizing the difference in the power spectrum or phase distributions (Van Dijk et al., 2008; Busch et al., 2009). Relatively little work has been done to investigate the variation of pre-stimulus α power when there is no difference in behavioral decision performance or when stimuli are nominally identical. It is possible that constituent neural processes are affected by pre-stimulus attentional state, though by the time the decision is made this relation is not observable in behavior or is confounded by other factors.
In this paper we investigate the relationship between pre-stimulus α power and post-stimulus discriminating components in a two alternative forced choice (2-AFC) decision making task. Unique to our approach is that we do not use behavioral data to separate trials for conducting our analyses, instead we investigate how pre-stimulus α power relates to post-stimulus neural components for cases in which the decisions are correct and the stimuli nominally identical.
2. Materials and Methods
2.1. Subjects, Experimental Design and Data Acquisition
Previous work by our group has used EEG to identify the timing of neural components which reflect the constituent processes of perceptual decision making (Philiastides and Sajda, 2006b; Philiastides et al., 2006; Philiastides and Sajda, 2007; Ratcliff et al., 2009; Sajda et al., 2009). In this previous work we identified a set of post-stimulus neural components that reflected, amongst other processes, an early perceptual component, correlating with sensory evidence, and a late discriminating component indexing the quality of the evidence entering the decision process itself (i.e., decision evidence). In this paper, we conducted the same experiment presented in (Philiastides and Sajda, 2006b), however collecting more data and conducting a new analysis with respect to pre-stimulus alpha power relative to the trial-to-trial functions of post-stimulus discriminating EEG components. Here we briefly summarize the experimental design and data acquisition. Additional details can be found in (Philiastides and Sajda, 2006b).
Twelve subjects (four women and eight men, age range 21-37 years) participated in the experiment. Data for six of the twelve subject were taken from our previous study (Philiastides and Sajda, 2006b). All subjects had normal or corrected to normal vision and reported no history of neurological problems. Informed written consent was obtained from all participants in accordance with the guidelines and approval of the Columbia University Institutional Review Board. We used a set of 20 face images (from the Max Planck Institute face database) and 20 car grayscale images obtained from the web (image size 512×512 pixels, 8 bits/pixel). They were all equated for spatial frequency, luminance, and contrast. All images had identical magnitude spectra and their corresponding phase spectra were manipulated using the weighted mean phase (WMP) technique (Dakin et al., 2002) to generate a set of images characterized by their percentage of phase coherence, which was used as a measure of task difficulty. Although WMP is limited in that it does not provide a uniform sampling of phase space when manipulating the image structure (Ales et al., 2012), this limitation does not present a problem in this study since we are merely looking at trends which require monotonicity and not a uniform manipulation of phase space. Six different phase coherence levels were used in this study (20%, 25%, 30%, 35%, 40%, and 45%). Each image subtended 22° × 22° of visual angle. Stimuli were presented on an LCD (800 × 600 pixels) and controlled by a Dell Precision T7500 Workstation using E-Prime 2.0 software.
The experimental paradigm consisted of a 2-AFC perceptual decision making task in which subjects were asked to decide whether the presented image contained a face or a car. Within each block of trials, face and car images of all phase coherence levels were displayed in random order. Each image was presented for 30 ms, followed by an inter-stimulus-interval (ISI) that was randomized in a range of 1500-2000 ms. Each block consisted of a total of 144 images, with 12 images at each phase coherence level for each of the face and car stimulus categories. Each experiment consisted of a total of four trial blocks.
EEG data was acquired in an electrostatically shielded room using a Sensorium Electrophysiological Amplifier (Vermont, USA) having 60 Ag/AgCl scalp electrodes. All channels were referenced to the left mastoid with chin ground and input impedance less than 15kΩ. Data were sampled at 1000 Hz and preprocessed using a 0.5 Hz fourth-order Butterworth highpass filter to remove DC drifts and 60 and 120 Hz notch filters to minimize line noise artifacts. These filters were applied non-causally (using MATLAB “filtfilt”) to avoid phase related distortions. Though the temporal bandwidths of the filters are small compared to the frequencies and temporal separation of the evoked activity of interest, we nonetheless checked the effect of a non-causal versus causal application of the filters (using MATLAB “filter”). We found no evidence of significant “smearing” of activity across the stimulus time boundary and all results where essentially identical for causal and non-causal filtering.
Trials with excessive eye blink and motion artifacts were rejected (< 10% of total trials) by visual inspection. All trials for which subjects failed to respond on time (reaction time limit was set to 1200 ms) were excluded from further analysis. For the top three coherence levels, after starting with a total of 96 trials for each coherence level, the average number of trials (across subjects) for single-trial analysis after trial rejection was 79.4 (35%), 86.1 (40%), and 87.3 (45%) respectively.
2.2. Single-Trial Discrimination
Single-trial analysis using logistic regression was performed to classify EEG activity corresponding to the different image type (i.e. face vs. car). We used a sliding window method (Parra et al., 2002) to obtain the variation of discrimination performance across the post-stimulus time period. A training window of width 30 ms was used and the window onset varied across the epoch in 50 ms increments from the stimulus onset to 800 ms post-stimulus. The classifier was subsequently retrained by shifting the training window in finer steps of 10 ms around the time ranges found to be most discriminating. This method enabled observation of the temporal progression of task-relevant components and localization of the window with maximal discrimination between faces and cars. For a time window starting at post-stimulus time τ, we use logistic regression to estimate a spatial weighting vector wτ, which defines the direction (in EEG sensor space) that maximizes discrimination. The estimated regression function can be expressed as:
where X is an N × T matrix of EEG data (N channels and T time points) and the estimated mean vector yτ is a discriminating component at time offset τ. Our previous study (Philiastides and Sajda, 2006b) revealed two face vs. car discriminating components: an early discriminating component around 170 ms post-stimulus and a late component between 300 to 450 ms post-stimulus. The discriminator performance was quantified by the area under ROC curve, referred to as Az value, using leave-one-out (LOO) cross validation. To validate the significance of each discriminating component, we used a label permutation method (1000 permutations for each time window) to compute an Az value for the null distribution (i.e. no discriminatory information) leading to the corresponding Az thresholds for the p = 0.05 significance levels. This permutation test was done at every coherence level of each individual subject. Only components having p < 0.05 level were considered in subsequent analyses. We also constructed forward models of our discriminating components
| (1) |
where aτ is the electrical coupling of the discriminating component yτ identified for time window τ that explains most of the measured scalp EEG at time τ (Parra et al., 2002).
2.3. Alpha-Power Analysis
The most prominent modulation of alpha rhythm is usually found over the parieto-occipital regions of the head (Klimesch et al., 2007; Romei et al., 2010). However, due to volume conduction, the sensorimotor μ rhythm, which shares the same frequency band as α rhythm, can be mixed with parieto-occipital α at the level of the scalp recordings and thus be picked up from posterior EEG channels. We therefore used independent component analysis (ICA) to estimate spatial filters that can disentangle different sources in α band. All processing was performed using the infomax algorithm implemented in the EEGLab toolbox (Delorme and Makeig, 2004). Specifically, we applied ICA to the preprocessed EEG to separate sources of μ rhythm, which characterized the activity relevant to finger movement, and sources of α rhythm that was relevant to face detection. The aim of ICA is to estimate the unmixing matrix W, so that the linear transformation of the EEG matrix X is an estimate of the source matrix S (i.e. S=WX), where each source is made to be as mutually independent as possible. Each column of W−1 represents the spatial distribution of one source component across all sensors.
Only one independent component was selected for each subject, with selection based on the frequency and spatial properties of the independent components (Lou et al., 2008). Specifically, first we estimated the power spectra of all independent components (ICs) and computed the signal-to-noise ratio (SNR) of the α oscillation, which is defined as the ratio of EEG power in the α band to the mean power of the adjacent frequency bands (5-15 Hz). To obtain an optimal α SNR for individual subjects, a subject-specific α frequency band was selected as the central frequency of α band peak in the power spectral density ±2 Hz. Initially, the top five ICs with the highest SNR were selected. Subsequently, we refined the selection to chose the IC having the largest magnitude of spatial weights over occipital-temporal electrode sites. This distribution of spatial weights would be most consistent with the topology of both of our early and late face-vs-car discriminating components.
To estimate the power of α oscillations on a single-trial basis, stimulus-locked epochs from the selected IC components were extracted from 500 ms before to 500 ms after stimulus onset. Data was filtered at the subject-specific α frequency band. We next calculated the analytic signal, xa(t), to construct the amplitude envelope of the α oscillation. Denoting x(t) as the real-valued EEG signal within a narrow frequency band, we can express the analytic signal as xa(t) = A(t)ejϕ(t), where
is the amplitude envelope. The imaginary part can be found by applying the Hilbert transform to the original signal. The amplitude envelope, A(t), represents the instantaneous magnitude of the oscillation and thus can be used to estimate how the power of the signal varies over time (Macdonald et al., 2011). In this study, pre-stimulus α power was characterized by the averaged power in the 500 ms interval preceding stimulus onset, which is computed by the mean of the squared amplitude. The power estimates of individual subjects were normalized by their baseline (defined by the power from 1000 ms to 800 ms before stimulus onset).
2.4. Relating Variability of Pre-stimulus Alpha-power to Post-stimulus EEG components
To investigate the relationship between pre-stimulus α and post-stimulus EEG component variability we sorted trials, for each coherence level, based on single-trial discriminating component amplitudes. Figure 1 illustrates the trial-to-trial variability of the optimal early and late components for one subject at 45% phase coherence. For our logistic regression model, the output of the discriminating component y is defined as the logit function of the probability that the Bernoulli random variable equals 1, where we assign the labels so that faces are labeled as 1 and cars as 0. Since there are only two categories in our paradigm, extremely high and low probabilities indicate strong evidence for the stimulus category. From the inverse of logit function, given by,
we know that large absolute values of the discriminating component represent high probabilities of discrimination. When the absolute values of y equal 0, 1 and 2, the probabilities are 0.50, 0.73 and 0.88 respectively, which roughly represents poor (insignificant), marginal (significant) and good (substantial) discrimination (Figure 1). Each post-stimulus component is a linear projection of the data where the absolute value of the component magnitude y is the distance of the trial from the discriminating hyperplane defined by the projection. The greater the value ∣y∣ the further the trial is from the discrimination boundary and the more probable, under the discriminatory model, the trial is a face or a car. We can thus view ∣y∣ as a measure of the evidence for a face vs car decision given the EEG data. We segregated correct trials using the absolute value of the optimal EEG discriminating component regardless of the class labels (face or car), and computed the difference of pre-stimulus α power for each group.
Figure 1.
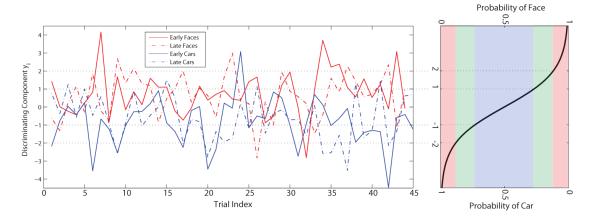
Amplitude for the early and late discriminating components of each face and car trial at 45% phase coherence for one participant (left panel). The corresponding inverse logit function is plotted in the right panel. Trials are groups by their absolute value of the discriminating components whereby red, green and blue represent high, middle and low probability of EEG classification respectively. We use the absolute value of the discriminator output ∣y∣ as a neural index of the stimulus and decision evidence for the early and late EEG components respectively.
3. Results
We first analyzed the behavioral data to check whether the manipulation of phase coherence in the images significantly affected subjects’ accuracy. All subjects were able to correctly identify more than 90% of images in easiest trials (45% coherence) but performed at approximately chance for the most difficult trials (20% coherence). Results showed that phase coherence level was positively correlated with detection accuracy (p = 1.79 × 10⁻¹¹, t(46) = 8.84), and negatively correlated with reaction time (p = 1.38 × 10⁻⁴, t(46) = −4.16), indicating phase coherence level of the stimulus had strong effect on subjects’ perceptual decisions. To check whether subjects might exploit low level features or learn idiosyncrasies in the low coherence images we also compared detection accuracy and reaction time between blocks for the difficult trials. At 30% coherence level, no significant difference was found in detection accuracy or reaction time (repeated-measures ANOVA, p = 0.42 and p = 0.08 respectively).
Figure 2 shows the average Az values across all subjects (N = 12) at each time point from 100 ms to 700 ms post-stimulus. As expected based on our previously reported analysis (Philiastides and Sajda, 2006b), for each individual subject there are two prominent face vs. car discriminating components, an early and late component, that were above the significance level of p = 0.05 estimated from a permutation test. Trials with phase coherence 30% and below were discarded from further analysis since they did not reach this threshold. Averaged forward models of early and late components across subjects are also given in Figure 2. Both scalp maps are consistent with our previously reported results (see Figure 5b in (Philiastides and Sajda, 2006b)).
Figure 2.

Average single-trial EEG discrimination performance across subjects (N = 12) with 30ms training window. Bands represent standard error across subjects. For each subject, only discrimination components passing p < 0.05 were used for further analysis. Az values for phase coherences 20% and 25% are not shown since their EEG discrimination performance was worse than that of 30% coherence and never above the p < 0.05 significance level. Topographies represent the group averaged forward models of early (left) and late (right) components at time of peak discrimination (referred to as optimal discriminating components).
Figure 5.

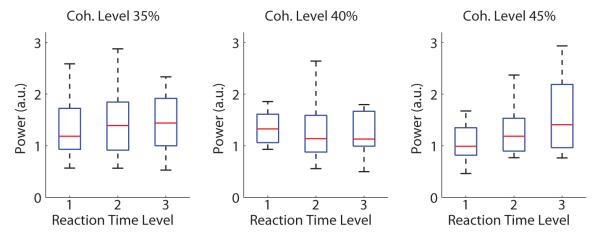
Analysis of pre-stimulus α power using the early EEG component discriminator output. (a) Mean pre-stimulus α power for three different discriminating component magnitude levels at each phase coherence level. Pre-stimulus α power was significantly lower for trials with high discriminating component magnitude at the lowest coherence level (35%). The difference between groups became less significant when the task was made easier–i.e. phase coherence increased. (b) Time series of instantaneous α band power from −800 to 500 ms at the 35% phase coherence level. Pre-stimulus α power of trials with high discriminating component magnitudes showed a strong reduction in instantaneous α power. (c) The variance of pre-stimulus α power at different coherence levels. Similar to the mean power responses, the variance of trials with high discriminating component magnitude was lower than for trials with low discriminating component magnitude. Data are displayed as box plots: the central mark is the median, the edges of the box are the 25th and 75th percentiles, the whiskers extend to the most extreme data points not considered outliers, and outliers are plotted individually.
We used ICA to increase the SNR of the α band EEG prior to performing our pre-stimulus analysis. For all subjects we identified ICs (see Methods) representing α activity and having high magnitude spatial weights in occipitotemporal electrode sites. Note that the spatial and frequency patterns of the subject-specific components are qualitatively quite similar, though the slight quantitative differences between subjects justify the need for optimizing the spatial and temporal filters on a subject-by-subject basis. We also typically found an additional one or more ICs for which their power spectrum had a peak in the α band, but none of these other components had a spatial distribution that was consistent with an occipitotemporal electrode distribution–i.e. they were more typical of a μ rhythm component having substantial weighting over lateralized motor cortex.
The topology of the individual subjects’ α ICs can be compared to the forward models of the individual subjects’ early and late post-stimulus discriminating components. Though our IC selection criterion chose ICs with high α in occipitotemporal electrode sites, no other spatial information was used in selection. Nonetheless we observed a topographic similarity between the α activity and discriminating component scalp maps and note that for these comparisons the sign of the spatial weights of the forward models is irrelevant, as it is merely due to the choice of class labels during face-vs-car discrimination (see Methods). Figure 3 displays the topographies of a selected IC and forward models of early and late discriminating components of one subject.
Figure 3.
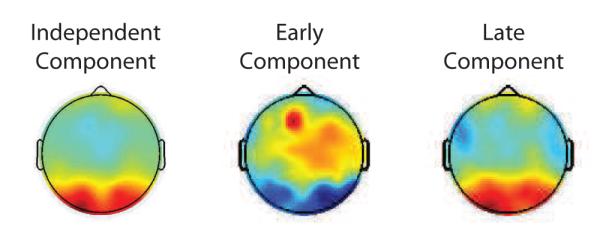
Example scalp maps for pre-stimulus alpha independent component and post-stimulus early and late discriminating components, for one subject. Clear is a strong topographic similarity. Note that the sign difference of the early component is irrelevant in this comparison.
To investigate how early and late discriminating components are correlated with behavioral decisions, we computed choice probabilities for both components using a method similar to previous studies (Britten et al., 1996; Philiastides and Sajda, 2006b). Specifically we used logistic regression to estimate the spatial weights, however this time using the behavioral responses as class labels (a face choice or a car choice). This was done using trials at 30% phase coherence since these contained the largest fraction of errors and therefore represented the largest difference between labeling trials based on stimulus or behavior. Trials without responses were discarded. Higher choice probability represents stronger association between neuronal and behavioral responses. As shown in Figure 4, the choice probabilities of the late components were above significance level of p = 0.05 for most of the subjects and were higher than those of early components for all subjects. Low choice probabilities of subject 9 and 10 is likely due to their strong bias toward one category for low coherence trials.
Figure 4.
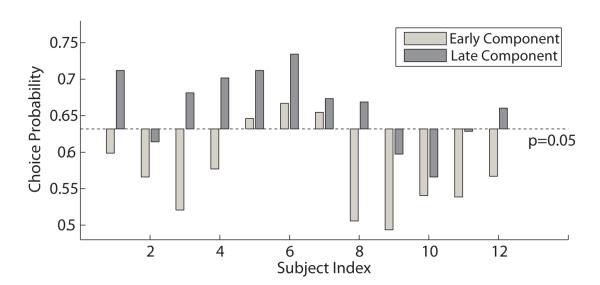
Choice probabilities of all twelve subjects using EEG data from optimal early and late discriminating components. The statistical significance level was computed by a permutation test with 1000 random permutations of the behavioral responses. Choice probabilities above 95% confidence intervals were considered statistically significant.
Figure 5a shows the mean of the pre-stimulus α power at each phase coherence level when grouped by early discriminating component magnitude. At each coherence level, we ran a repeated-measures ANOVA to test three levels of the independent variable: low (∣y∣ < 1), medium (1 < ∣y∣ < 2),and high (∣y∣ > 2) magnitudes of discriminating components. For more difficult trials (i.e. 35% coherence trials) we found a significant difference of the means of the pre-stimulus α power between three discriminating component magnitude groups (p = 2.8 × 10⁻⁶, F(2,22) = 24.17, effect size η2 = 0.69). Additional paired comparisons were performed between groups using Tukey’s HSD test, which compared the differences of group means with the critical HSD value (e.g. HSD = 0.24 for α = 0.05). Results showed that the mean of the pre-stimulus α power was significantly different between discriminating component magnitudes (left panel of Figure 5a). Similar test was conducted on medium difficulty trials (40% coherence). Effect of discriminating component magnitude was still observed (p = 9.6 × 10⁻³, F(2,22) = 5.78, η2 = 0.34), but difference was only observed between high-low magnitude groups and medium-low magnitude groups after multiple comparison correction (middle panel of Figure 5a). No significant difference was observed on easy trials (45% coherence, p = 0.22, F(2,22) = 1.61, η2 = 0.13). The results of the ANOVA are summarized in Table 1. We also find that effect sizes decreased when the task becomes easier. To further demonstrate the effect of the difficulty level on the correlation between pre-stimulus α power and post-stimulus discriminating component, we ran a two-way repeated-measures ANOVA with factors of difficulty (3 coherence levels) and discriminating component magnitude (3 levels). Results also showed a significant interaction between coherence levels and ∣y∣ levels (p = 0.012, F(4,44) = 3.64) (Nieuwenhuis et al., 2011).
Table 1.
Summary of repeated-measures ANOVA evaluating difference in mean and variance of pre-stimulus α power among early/late discriminating component magnitude levels.
| Component | 35% coherence |
40% coherence |
45% coherence |
|||||||
|---|---|---|---|---|---|---|---|---|---|---|
| P | F (2,22) | η 2 | P | F (2,22) | η 2 | P | F (2,22) | η 2 | ||
| Early | Mean | 2.8 × 10⁻⁶ | 24.17 | 0.69 | 9.6 × 10⁻³ | 5.78 | 0.34 | 0.22 | 1.61 | 0.13 |
| Variance | 7.1 × 10⁻⁹ | 49.57 | 0.82 | 9.0 × 10⁻⁴ | 9.82 | 0.47 | 0.02 | 4.58 | 0.29 | |
| Late | Mean | 0.36 | 1.08 | 0.09 | 0.13 | 2.24 | 0.17 | 0.08 | 2.80 | 0.20 |
| Variance | 0.19 | 1.80 | 0.14 | 0.39 | 0.97 | 0.08 | 0.06 | 3.25 | 0.23 | |
Bold text indicates significant at p < 0.05 level.
η2 is a measure of effect size.
The time series of the averaged envelops at 35% coherence level is plotted in Figure 5b. Reduction of pre-stimulus α power can be observed for trials with high discriminating component magnitudes. We also found a decrease in α power after stimulus onset regardless of the discriminating component magnitude. This is consistent with previous studies of event-related desynchronization (ERD) (Pfurtscheller, 1977) that can be detected via frequency analysis (Pfurtscheller and da Silva, 1999). Finally, we also analyzed the relationship between pre-stimulus α power variance and the discriminating component magnitude. Similarly to what was found for the mean pre-stimulus α power, Figure 5c shows that there is a reduction of pre-stimulus α power variance for trials having high discriminating component magnitude. Similar repeated-measures ANOVA was conducted for each coherence level, and results were listed in Table 1. We also observed the effect sizes were decreased with the increase in phase coherence levels from 35% to 45%, but a two-way repeated-measures ANOVA showed the interaction between coherence levels and ∣y∣ levels was less significant in pre-stimulus α variance (p = 0.054, F(4,44) = 2.52) than in mean.
Figure 5a presents the correlation with the selected IC; however, it is also interesting to observe how the difference pre-stimulus α power for early components at low coherence trials is distributed across all electrodes. We used the same grouping method for trials with 35% phase coherence and computed the power difference on each individual electrodes. Scalp maps of all subjects were displayed in Figure 6. We can observe that the difference was mostly in parieto-occipital regions, but it presents a large variation across subjects. The power difference is hard to observe in some subjects (e.g. S8) or even negative (e.g. S2), probably because of the confounding effect from other α band activities.
Figure 6.

Scalp maps of pre-stimulus α power difference for each subject at 35% coherence level. Normalized pre-stimulus α power difference was computed across all electrodes between ∣y∣ < 1 and ∣y∣ > 2 groups using optimal early components. Higher α activities were observed for trials with lower ∣y∣ mostly in parieto-occipital regions.
To investigate whether there were similar associations between pre-stimulus α and the late EEG discriminating component, we sorted trials based on the late component magnitudes. No significant mean or variance differences were found at any coherence level (Figure 7, see Table 1 for repeated-measures ANOVA results). On average, however, we observed a similar trend between mean and variance. Also, a two-way repeated-measures ANOVA on 35% coherence trials with factors of discriminator magnitude (3 ∣y∣ levels) and early/late discriminator stage (2 levels: early and late) showed a significant interaction between ∣y∣ and discriminator stages (p = 0.009, F(2,22) = 5.88), which suggested that early and late discriminator had different associations with pre-stimulus α power.
Figure 7.

Analysis of pre-stimulus α power using the late EEG component discriminator. Neither the (a) mean or (b) variance showed a significant difference between groups at any coherence level. Data for each group is displayed as a box plot–additional explanation for plots is given in Figure 5.
To be consistent with previous studies on pre-stimulus α activity, we also investigated whether variations of pre-stimulus α oscillations are reflected in behavioral performance. We first analyzed the interaction between pre-stimulus α power and reaction times. Only correctly identified stimuli were used in this analysis. For each coherence level, all trials were sorted in ascending order based on their reaction times and divided into three equally-sized groups (i.e. at tertiles). The averaged pre-stimulus α power of each group was calculated and is shown in Figure 8. We observed the mean of pre-stimulus α power increased for long RT trials at the high coherence level (45%), and a significant difference between long RT and short RT groups was found at 45% coherence level after multiple comparison correction (repeated-measures ANOVA, p = 0.025, F(2,22) = 4.36, η2 = 0.28). No significant correlations were found in more difficult trials (35% coherence level p = 0.98, F(2,22) = 0.021, η2 = 0.0019; 40% coherence level p = 0.98, F(2,22) = 0.017, η2 = 0.0015).
Figure 8.
Analysis of pre-stimulus α power using reaction time (RT). Trials were sorted by reaction times in ascending order and divided at 3-quantiles (tertiles). Significant difference on pre-stimulus α power was only found between long RT group and short RT group for easiest trials (45% coherence level). Data for each group is displayed as a box plot–additional explanation for plots is given in Figure 5.
We next investigated how accuracy was associated with pre-stimulus α power. Accuracy was defined as the number of correctly identified stimuli at one coherence level divided by the total number of trials at the same coherence level. At very low coherence levels, subjects were performing at chance which resulted in an accuracy of approximately 50%. In contrast, subjects reached accuracies of more than 90% at high coherence levels. To obtain enough trials of both correct and incorrect responses for the analysis, we chose different phase coherence levels for individual subjects such that accuracy was near 70% for all participants. Subsequently, we estimated the normalized pre-stimulus α power of correctly and incorrectly identified stimuli for each subject. Using a two-tailed paired t-test, we found that behaviorally incorrect trials showed significantly stronger pre-stimulus α power (Figure 9a, p = 0.002, t(11) = −4.01, effect size g = −1.16). We also sorted all trials in ascending order by the pre-stimulus α power and divided them at tertiles. Detection accuracies of the first and the third group were then estimated for comparison. To avoid possible problems with ANOVA for the analysis of categorical data (i.e. accuracy), logistic regression was used for this analysis (Jaeger, 2008). All trials from these two conditions were fir with logistic regression models. We found that a reduced model (without pre-stimulus α power factor) had considerably lower data likelihood (likelihood ratio test, , p = 0.019), indicating that the group with lower pre-stimulus α power had significantly higher accuracy (Figure 9b). Both plots in Figure 9 also suggest a negative correlation between pre-stimulus α power and accuracy.
Figure 9.
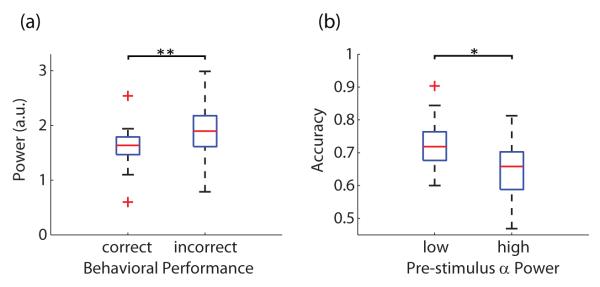
Associations between pre-stimulus α power and accuracy. (a) Trials with incorrect responses showed significantly stronger pre-stimulus α power than those with correct responses (paired t-test, **p < 0.01). (b) Trials were divided by pre-stimulus α power into low and high groups. Trials with low pre-stimulus α power resulted in significantly higher accuracy than those with high α power (likelihood ratio test, *p < 0.05). Data for each group is displayed as a box plot–additional explanation for plots is given in Figure 5.
Lastly, we investigated the sources that potentially generate the pre-stimulus oscillatory activity associated with early post-stimulus discriminating component. Specifically we used the source localization algorithm sLORETA (Pascual-Marqui, 2002) to estimate the source distribution in the cortex. Since we found that the most significant correlation is between pre-stimulus α oscillation and optimal early discriminating component at 35% coherence level, we classified the trials at 35% for each subject by the magnitudes of early components and α power of selected IC. Trials having an early component with ∣y∣ below the average and the pre-stimulus α power of the selected IC above average were combined into one group, while trials with high ∣y∣ and low α activity were combined into another group. For each individual subject, current density distributions of both groups were estimated based on the average spectrum and obtained sLORETA values were subjected to paired tests to identify the differences between groups in the α band. Randomized SnPM with 5000 permutations was performed to obtain the corrected critical threshold and p-values (Nichols and Holmes, 2002). As shown in Figure 10, the difference was significant at posterior cingulate and cuneus (BA30, BA17&18, respectively) (Log of ratio of averages = −1.49, p < 0.01), lateralized to the right side. The lateralization is likely due to right-side bias seen in face processing (Kanwisher et al., 1997).
Figure 10.

The sLORETA images showing statistical differences (Log of ratio of averages) between groups with high and low magnitude of optimal early discriminating components. Significant differences are seen at posterior cingulate and cuneus (BA30, BA17&18, respectively) , with less significant differences also observable in STS and fusiform gyrus.
4. Discussion
Uncovering the neural correlates of a perceptual decision is likely to lead to a better understanding of the neural processes underlying more complex decision making. In this paper we used a simple decision making task to investigate how pre-stimulus activity varies relative to post-stimulus activity which is discriminative of stimulus category. Specifically we found that pre-stimulus α power is reduced for trials with high magnitude (i.e. high absolute value) of the early discriminating component for stimuli presented at low coherence levels–i.e. images difficult to discriminate. This in turn is consistent with previous work showing that an increased pre-stimulus α power reflects inhibition or disengagement of posterior areas (Jensen et al., 2002; Cooper et al., 2003; Tuladhar et al., 2007), which results in a decrease in visual discrimination performance (Ergenoglu et al., 2004; Van Dijk et al., 2008). Unique to our work, however, is that we used the variability in the EEG signal using only correct trials and nominally identical stimuli thereby removing behavioral confounds associated with different behavioral outcomes (correct vs incorrect responses) and differing stimulus evidence. As a result, our approach helps provide more concrete support for the notion that the early discriminating component magnitude indexes the quality of the early encoding of the stimulus. With the hypothesis that alpha oscillations are likely to be modulated by a top-down mechanism such as attention (Worden et al., 2000; Medendorp et al., 2007), our results indicate that the early visual processing is likely to be modulated by top-down pre-stimulus attention, with the incoming sensory evidence being a function of both the noise level of the stimulus and the subjects’ attentional state on any given trial. This is consistent with previous neurophysiological and transcranial magnetic stimulation (TMS) studies, which suggested occipital α oscillations are likely involved in signal transmission and information precessing at an early stage of visual processing(Lorincz et al., 2009; Romei et al., 2010). Previous work using fMRI also has shown that fluctuations in early visual perception, that can be observed via behavioral performance, are attributable to the attentional modulations of the sensory processing (Ress et al., 2000).
Interestingly, the correlation between pre-stimulus α power and the late component was not significant. To better understand this finding it is important to consider that, in the context of behavioral designs with very brief stimulus durations, the early representation of the stimulus needs to remain in the system, likely via feedback pathways in the ventral stream (Di Lollo, 1977; Coltheart, 1980; Keysers and Perrett, 2002; VanRullen and Koch, 2003). This in turn, suggests that the early sensory evidence is processed further to generate an internal representation of decision evidence (late component) that ultimately drives the decision process itself, as shown in Figure 4 that the late component is more predictive of behavioral responses. This result is also consistent with previous studies that reported early and late components had qualitatively distinct relationship with behavior (Philiastides and Sajda, 2006a; Del Cul et al., 2007; Fisch et al., 2009; Wyart et al., 2011). Our results seem to suggest that the pre-stimulus attention does not directly affect this additional processing of the sensory evidence. In addition, this result is consistent with a recent study by Macdonald et al. (2011), where subjects reported their subjective attentional state and decision confidence on each trial. Results showed a strong negative association between subjective attentional state and pre-stimulus α power but no significant relationship between subjective confidence and pre-stimulus α power. Therefore, we hypothesize that subjective attentional state is strongly related with sensory evidence, while subjective confidence is more likely to be linked with the downstream processing of the decision evidence.
In a related finding, our analysis not only showed negative correlation between the mean of pre-stimulus α power and early discriminating component magnitude, but also increased variance in α power for trials having low discriminating component magnitude (Figure 5C). Our hypothesis is that the lack of a difference in the high discriminating component magnitude group reflects that subjects are more confident in their choice when they pay more attention–i.e. for a higher optimal discriminating component ∣y∣ they are less likely to be in a low attentional state and therefore both mean and variance of pre-stimulus α power are relatively small. It has also been reported that the reduction of α power variance with attention could be interpreted by a theoretical model as increasing global gain to synaptic activity induced by the sensory input (Rajagovindan and Ding, 2011). For a low discriminating component magnitude, two explanations are possible; 1) a low attentional state or 2) a high attentional state albeit with insu cient information accumulated in the post-stimulus period to result in accurate decisions. Previous studies have investigated the role of pre-stimulus α phase deviation for visual perceptual performance and found low phase coupling (low deviation) in the α band predicted enhanced visual perception (Hanslmayr et al., 2007) on a single-trial basis. Phase was also shown to be more informative than power in a study which analyzed the EEG using mutual information (Schyns et al., 2011). One interpretation is synchronous oscillations in the alpha frequency band inhibits the perception of shortly presented stimuli and decreased α synchrony reflects a state of enhanced attention (Fries et al., 2001; Hanslmayr et al., 2007). Our analysis suggests that these fluctuations of attentional state may be captured not only by phase, but also by amplitude dynamics of α oscillations.
We also observed that the association between the pre-stimulus α power and discriminating component magnitude is related to the phase coherence of the visual stimulus–i.e. the stimulus dependent difficulty of the task. The mean and variance differences between three discriminating component magnitude levels were less significant when the phase coherence increased. Given pre-stimulus α power may indicate attentional state, we hypothesize that, unlike for low coherence (35%) trials, in high coherence trials (45%) the discrimination task becomes so easy that the fluctuations in pre-stimulus attention do not play an determinant role in the fidelity in which sensory evidence is encoded–i.e. the higher signal-to-noise ratio in the stimulus makes the attentional modulation of sensory encoding less important for the fidelity of the encoding. It remains possible that the information content of brain activity differs with alpha/attention levels, which may in fact explain the lack of an effect at the easiest coherence level. However this goes beyond what can be assessed from this study, though future experiments could be designed to consider this question using reverse correlation techniques (Schyns et al., 2009).
We also analyzed how pre-stimulus α power predicts behavioral performance. By comparing the percentage of correctly responded trials in low and high pre-stimulus α power state, we observed significant reduction in accuracy for trials with high pre-stimulus α power. This result is consistent with the report that visual discrimination decreases with an increase in pre-stimulus α power (Van Dijk et al., 2008). Some previous research reports that reaction times do not vary systematically with pre-stimulus α power (Van Dijk et al., 2008), but on the other hand some studies have also reported that pre-stimulus α activity at visual cortical sites is positively correlated with reaction times (Zhang et al., 2008; Andino et al., 2005) potentially resulting from modulation of top-down processing. Reduced α activity was considered to represent more efficient visual stimulus processing because of attentional engagement and expectancy (Foxe et al., 1998; Engel et al., 2001; Zhang et al., 2008). This observation was found in simple target-response and go/no-go tasks, but was not observed in more difficult visual detection experiments. In our perceptual decision-making experiment, we only found the positive correlation in easy trials (45% coherence level). Our hypothesis for why this is the case is that in our experiment the impact of attention is reflected in the early sensory evidence and encoding as captured by our early discriminating EEG component. However reaction time also depends on the late discriminating component that is not correlated with pre-stimulus α activity. Thus in a more complex perceptual decision making task, such as for our difficult trials, this lack of correlation with the processing of the stimulus evidence may account for the insignificant correlation between pre-stimulus oscillatory activity and reaction time. For the easy trials, however, more stimulus evidence can be obtained so the reaction time could be more correlated with the attentional engagement, similarly as a simple go/no-go task. In addition to the hypothesis of top-down modulation of attention, the reported result is also in accordance with recent proposed theories that increased α activity reflects inhibition or disengagement in posterior areas (Klimesch et al., 2007; Jensen and Mazaheri, 2010). The fluctuations of α activity indicate inhibitory or excitatory states of visual processing regions (Hanslmayr et al., 2011) and thereby impact the sensory evidence encoding. Other studies further suggest an active role of α activity in cognitive processing (Palva and Palva, 2007) and a causal relationship between pre-stimulus α amplitude and perceptual performance (Romei et al., 2010).
We found that the sources accounting for the difference in pre-stimulus α activity when comparing high and low early component magnitude were located in cuneus and posterior cingulate, as well to a less extent in STS and fusiform gyrus (Figure 10). The cuneus has been linked to early face vs car discriminating components in a EEG/fMRI study (Philiastides and Sajda, 2007), and is seen generally as playing a basic role in visual processing and spatial attention (Vanni et al., 2001). Our findings and interpretation are also consistent with other findings that the posterior cingulate is positively correlated with momentary lapses in attention (Weissman et al., 2006) and the number of self-reported stimulus-independent thoughts (Buckner et al., 2008). The suppression of this area is likely to reflect increased ability of the subject to concentrate on the task, obtaining more sensory evidence and thus yielding a higher magnitude for the early discriminating component.
In summary, we find that pre-stimulus neural activity can affect neural correlates of post-stimulus early sensory encoding of nominally identical stimuli during correctly categorized trials. Our approach has relied on signals which are easily measured via scalp EEG (α power and face-selective EEG components). It is still unclear, however, whether these results would generalize for other stimulus categories and/or cases in which discriminating activity is not easily observed with scalp EEG (e.g. activity resulting from motion selective columns in area MT during motion discrimination tasks often used in the decision making literature (Britten et al., 1993; Donner et al., 2009; Siegel et al., 2011)). In addition, no causal relationship can be inferred from our results, though clearly the relationship between pre-stimulus attention and stimulus encoding may have a causal component. Nonetheless, our work sheds new light on both the evolution of the neural activity underlying perceptual decision making by establishing a link between pre- and post-stimulus neural activity.
Highlights.
- Task-related EEG components are identified using a linear multivariate classifier
- Trial-to-trial variability of prestimulus alpha is correlated with an early poststimulus component
- No significant correlation is seen with a later component linked with evidence accumulation
- We conclude that prestimulus alpha modulates sensory encoding during perceptual decisions
5. Acknowledgements
This work has been supported by NIH grants MH085092 and EB004730 and ARO grant W911NF-11-1-0219.
Footnotes
Publisher's Disclaimer: This is a PDF file of an unedited manuscript that has been accepted for publication. As a service to our customers we are providing this early version of the manuscript. The manuscript will undergo copyediting, typesetting, and review of the resulting proof before it is published in its final citable form. Please note that during the production process errors may be discovered which could affect the content, and all legal disclaimers that apply to the journal pertain.
References
- Ales JM, Farzin F, Rossion B, Norcia AM. An objective method for measuring face detection thresholds using the sweep steady-state visual evoked response. Journal of Vision. 2012;12 doi: 10.1167/jov.12.10.18. [DOI] [PMC free article] [PubMed] [Google Scholar]
- Andino SLG, Michel CM, Thut G, Landis T, de Peralta RG. Prediction of response speed by anticipatory high-frequency (gamma band) oscillations in the human brain. Human Brain Mapping. 2005;24:50–58. doi: 10.1002/hbm.20056. [DOI] [PMC free article] [PubMed] [Google Scholar]
- Babiloni C, Vecchio F, Bultrini A, Romani GL, Rossini PM. Pre- and poststimulus alpha rhythms are related to conscious visual perception: A high-resolution eeg study. Cerebral Cortex. 2006;16:1690–1700. doi: 10.1093/cercor/bhj104. [DOI] [PubMed] [Google Scholar]
- Britten KH, Newsome WT, Shadlen MN, Celebrini S, Movshon JA. A relationship between behavioral choice and the visual responses of neurons in macaque mt. Visual Neuroscience. 1996;13:87–100. doi: 10.1017/s095252380000715x. [DOI] [PubMed] [Google Scholar]
- Britten KH, Shadlen MN, Newsome WT, Movshon JA. Responses of neurons in macaque mt to stochastic motion signals. Vis Neurosci. 1993;10:1157–69. doi: 10.1017/s0952523800010269. [DOI] [PubMed] [Google Scholar]
- Buckner RL, Andrews-Hanna JR, Schacter DL. The brain’s default network: anatomy, function, and relevance to disease. Ann N Y Acad Sci. 2008;1124:1–38. doi: 10.1196/annals.1440.011. [DOI] [PubMed] [Google Scholar]
- Busch NA, Dubois J, VanRullen R. The phase of ongoing eeg oscillations predicts visual perception. Journal of Neuroscience. 2009;29:7869–7876. doi: 10.1523/JNEUROSCI.0113-09.2009. [DOI] [PMC free article] [PubMed] [Google Scholar]
- Coltheart M. The persistences of vision. Philos Trans R Soc Lond B Biol Sci. 1980;290:57–69. doi: 10.1098/rstb.1980.0082. [DOI] [PubMed] [Google Scholar]
- Cooper NR, Croft RJ, Dominey SJJ, Burgess AP, Gruzelier JH. Paradox lost? exploring the role of alpha oscillations during externally vs. internally directed attention and the implications for idling and inhibition hypotheses. International Journal of Psychophysiology. 2003;47:65–74. doi: 10.1016/s0167-8760(02)00107-1. [DOI] [PubMed] [Google Scholar]
- Dakin SC, Hess RF, Ledgeway T, Achtman RL. What causes nonmonotonic tuning of fmri response to noisy images? Current Biology. 2002;12:R476–R477. doi: 10.1016/s0960-9822(02)00960-0. [DOI] [PubMed] [Google Scholar]
- Del Cul A, Baillet S, Dehaene S. Brain dynamics underlying the nonlinear threshold for access to consciousness. PLoS Biol. 2007;5:e260. doi: 10.1371/journal.pbio.0050260. [DOI] [PMC free article] [PubMed] [Google Scholar]
- Delorme A, Makeig S. Eeglab: an open source toolbox for analysis of single-trial eeg dynamics including independent component analysis. Journal of Neuroscience Methods. 2004;134:9–21. doi: 10.1016/j.jneumeth.2003.10.009. [DOI] [PubMed] [Google Scholar]
- Di Lollo V. Temporal characteristics of iconic memory. Nature. 1977;267:241–243. doi: 10.1038/267241a0. [DOI] [PubMed] [Google Scholar]
- Donner TH, Siegel M, Fries P, Engel AK. Buildup of choice-predictive activity in human motor cortex during perceptual decision making. Current Biology. 2009;19:1581–1585. doi: 10.1016/j.cub.2009.07.066. [DOI] [PubMed] [Google Scholar]
- Engel AK, Fries P, Singer W. Dynamic predictions: Oscillations and synchrony in top-down processing. Nature Reviews Neuroscience. 2001;2:704–716. doi: 10.1038/35094565. [DOI] [PubMed] [Google Scholar]
- Ergenoglu T, Demiralp T, Bayraktaroglu Z, Ergen M, Beydagi H, Uresin Y. Alpha rhythm of the eeg modulates visual detection performance in humans. Cognitive Brain Research. 2004;20:376–383. doi: 10.1016/j.cogbrainres.2004.03.009. [DOI] [PubMed] [Google Scholar]
- Fisch L, Privman E, Ramot M, Harel M, Nir Y, Kipervasser S, Andelman F, Neufeld MY, Kramer U, Fried I, Malach R. Neural “ignition”: enhanced activation linked to perceptual awareness in human ventral stream visual cortex. Neuron. 2009;64:562–74. doi: 10.1016/j.neuron.2009.11.001. [DOI] [PMC free article] [PubMed] [Google Scholar]
- Foxe JJ, Simpson GV, Ahlfors SP. Parieto-occipital similar to 10 hz activity reflects anticipatory state of visual attention mechanisms. Neuroreport. 1998;9:3929–3933. doi: 10.1097/00001756-199812010-00030. [DOI] [PubMed] [Google Scholar]
- Fries P, Reynolds JH, Rorie AE, Desimone R. Modulation of oscillatory neuronal synchronization by selective visual attention. Science. 2001;291:1560–1563. doi: 10.1126/science.1055465. [DOI] [PubMed] [Google Scholar]
- Gold JI, Shadlen MN. The neural basis of decision making. Annual Review of Neuroscience. 2007;30:535–574. doi: 10.1146/annurev.neuro.29.051605.113038. [DOI] [PubMed] [Google Scholar]
- Hanslmayr S, Aslan A, Staudigl T, Klimesch W, Herrmann CS, Bauml KH. Prestimulus oscillations predict visual perception performance between and within subjects. Neuroimage. 2007;37:1465–73. doi: 10.1016/j.neuroimage.2007.07.011. [DOI] [PubMed] [Google Scholar]
- Hanslmayr S, Gross J, Klimesch W, Shapiro KL. The role of alpha oscillations in temporal attention. Brain Res Rev. 2011;67:331–43. doi: 10.1016/j.brainresrev.2011.04.002. [DOI] [PubMed] [Google Scholar]
- Heekeren HR, Marrett S, Bandettini PA, Ungerleider LG. A general mechanism for perceptual decision-making in the human brain. Nature. 2004;431:859–862. doi: 10.1038/nature02966. [DOI] [PubMed] [Google Scholar]
- Heekeren HR, Marrett S, Ruff DA, Bandettini PA, Ungerleider LG. Involvement of human left dorsolateral prefrontal cortex in perceptual decision making is independent of response modality. Proceedings of the National Academy of Sciences of the United States of America. 2006;103:10023–10028. doi: 10.1073/pnas.0603949103. [DOI] [PMC free article] [PubMed] [Google Scholar]
- Jaeger TF. Categorical data analysis: Away from anovas (transformation or not) and towards logit mixed models. Journal of Memory and Language. 2008;59:434–446. doi: 10.1016/j.jml.2007.11.007. [DOI] [PMC free article] [PubMed] [Google Scholar]
- Jensen O, Gelfand J, Kounios J, Lisman JE. Oscillations in the alpha band (9-12 hz) increase with memory load during retention in a short-term memory task. Cerebral Cortex. 2002;12:877–882. doi: 10.1093/cercor/12.8.877. [DOI] [PubMed] [Google Scholar]
- Jensen O, Mazaheri A. Shaping functional architecture by oscillatory alpha activity: gating by inhibition. Frontiers in Human Neuroscience. 2010;4 doi: 10.3389/fnhum.2010.00186. [DOI] [PMC free article] [PubMed] [Google Scholar]
- Kanwisher N, McDermott J, Chun MM. The fusiform face area: A module in human extrastriate cortex specialized for face perception. Journal of Neuroscience. 1997;17:4302–4311. doi: 10.1523/JNEUROSCI.17-11-04302.1997. [DOI] [PMC free article] [PubMed] [Google Scholar]
- Keysers C, Perrett DI. Visual masking and rsvp reveal neural competition. Trends in Cognitive Sciences. 2002;6:120–125. doi: 10.1016/s1364-6613(00)01852-0. [DOI] [PubMed] [Google Scholar]
- Klimesch W, Sauseng P, Hanslmayr S. Eeg alpha oscillations: The inhibition-timing hypothesis. Brain Research Reviews. 2007;53:63–88. doi: 10.1016/j.brainresrev.2006.06.003. [DOI] [PubMed] [Google Scholar]
- Liu TS, Pleskac TJ. Neural correlates of evidence accumulation in a perceptual decision task. Journal of Neurophysiology. 2011;106:2383–2398. doi: 10.1152/jn.00413.2011. [DOI] [PubMed] [Google Scholar]
- Lorincz ML, Kekesi KA, Juhasz G, Crunelli V, Hughes SW. Temporal framing of thalamic relay-mode firing by phasic inhibition during the alpha rhythm. Neuron. 2009;63:683–696. doi: 10.1016/j.neuron.2009.08.012. [DOI] [PMC free article] [PubMed] [Google Scholar]
- Lou B, Hong B, Gao XR, Gao SK. Bipolar electrode selection for a motor imagery based brain-computer interface. Journal of Neural Engineering. 2008;5:342–349. doi: 10.1088/1741-2560/5/3/007. [DOI] [PubMed] [Google Scholar]
- Macdonald JS, Mathan S, Yeung N. Trial-by-trial variations in subjective attentional state are reflected in ongoing prestimulus eeg alpha oscillations. Front Psychol. 2011;2:82. doi: 10.3389/fpsyg.2011.00082. [DOI] [PMC free article] [PubMed] [Google Scholar]
- Mathewson KE, Gratton G, Fabiani M, Beck DM, Ro T. To see or not to see: Prestimulus alpha phase predicts visual awareness. Journal of Neuroscience. 2009;29:2725–2732. doi: 10.1523/JNEUROSCI.3963-08.2009. [DOI] [PMC free article] [PubMed] [Google Scholar]
- Medendorp WP, Kramer GFI, Jensen O, Oosterveld R, Schoffelen JM, Fries P. Oscillatory activity in human parietal and occipital cortex shows hemispheric lateralization and memory effects in a delayed double-step saccade task. Cerebral Cortex. 2007;17:2364–2374. doi: 10.1093/cercor/bhl145. [DOI] [PubMed] [Google Scholar]
- Nichols TE, Holmes AP. Nonparametric permutation tests for functional neuroimaging: A primer with examples. Human Brain Mapping. 2002;15:1–25. doi: 10.1002/hbm.1058. [DOI] [PMC free article] [PubMed] [Google Scholar]
- Nieuwenhuis S, Forstmann BU, Wagenmakers EJ. Erroneous analyses of interactions in neuroscience: a problem of significance. Nat Neurosci. 2011;14:1105–7. doi: 10.1038/nn.2886. [DOI] [PubMed] [Google Scholar]
- Ostwald D, Porcaro C, Mayhew SD, Bagshaw AP. Eeg-fmri based information theoretic characterization of the human perceptual decision system. Plos One. 2012;7 doi: 10.1371/journal.pone.0033896. [DOI] [PMC free article] [PubMed] [Google Scholar]
- Palva S, Palva JM. New vistas for alpha-frequency band oscillations. Trends in Neurosciences. 2007;30:150–158. doi: 10.1016/j.tins.2007.02.001. [DOI] [PubMed] [Google Scholar]
- Parra L, Alvino C, Tang A, Pearlmutter B, Yeung N, Osman A, Sajda P. Linear spatial integration for single-trial detection in encephalography. Neuroimage. 2002;17:223–230. doi: 10.1006/nimg.2002.1212. [DOI] [PubMed] [Google Scholar]
- Pascual-Marqui RD. Standardized low-resolution brain electromagnetic tomography (sloreta): Technical details. Methods and Findings in Experimental and Clinical Pharmacology. 2002;24:5–12. [PubMed] [Google Scholar]
- Pfurtscheller G. Graphical display and statistical evaluation of event-related desynchronization (erd) Electroencephalography and Clinical Neurophysiology. 1977;43:757–760. doi: 10.1016/0013-4694(77)90092-x. [DOI] [PubMed] [Google Scholar]
- Pfurtscheller G, da Silva FHL. Event-related eeg/meg synchronization and desynchronization: basic principles. Clinical Neurophysiology. 1999;110:1842–1857. doi: 10.1016/s1388-2457(99)00141-8. [DOI] [PubMed] [Google Scholar]
- Philiastides MG, Auksztulewicz R, Heekeren HR, Blankenburg F. Causal role of dorsolateral prefrontal cortex in human perceptual decision making. Current Biology. 2011;21:980–983. doi: 10.1016/j.cub.2011.04.034. [DOI] [PubMed] [Google Scholar]
- Philiastides MG, Ratcliff R, Sajda P. Neural representation of task difficulty and decision making during perceptual categorization: A timing diagram. Journal of Neuroscience. 2006;26:8965–8975. doi: 10.1523/JNEUROSCI.1655-06.2006. [DOI] [PMC free article] [PubMed] [Google Scholar]
- Philiastides MG, Sajda P. Causal influences in the human brain during face discrimination: A short-window directed transfer function approach. Ieee Transactions on Biomedical Engineering. 2006a;53:2602–2605. doi: 10.1109/TBME.2006.885122. [DOI] [PubMed] [Google Scholar]
- Philiastides MG, Sajda P. Temporal characterization of the neural correlates of perceptual decision making in the human brain. Cerebral Cortex. 2006b;16:509–518. doi: 10.1093/cercor/bhi130. [DOI] [PubMed] [Google Scholar]
- Philiastides MG, Sajda P. Eeg-informed fmri reveals spatiotemporal characteristics of perceptual decision making. Journal of Neuroscience. 2007;27:13082–13091. doi: 10.1523/JNEUROSCI.3540-07.2007. [DOI] [PMC free article] [PubMed] [Google Scholar]
- Rajagovindan R, Ding MZ. From prestimulus alpha oscillation to visual-evoked response: An inverted-u function and its attentional modulation. Journal of Cognitive Neuroscience. 2011;23:1379–1394. doi: 10.1162/jocn.2010.21478. [DOI] [PubMed] [Google Scholar]
- Ratcliff R, Philiastides MG, Sajda P. Quality of evidence for perceptual decision making is indexed by trial-to-trial variability of the eeg. Proceedings of the National Academy of Sciences of the United States of America. 2009;106:6539–6544. doi: 10.1073/pnas.0812589106. [DOI] [PMC free article] [PubMed] [Google Scholar]
- Ress D, Backus BT, Heeger DJ. Activity in primary visual cortex predicts performance in a visual detection task. Nature Neuroscience. 2000;3:940–945. doi: 10.1038/78856. [DOI] [PubMed] [Google Scholar]
- Romei V, Gross J, Thut G. On the role of prestimulus alpha rhythms over occipito-parietal areas in visual input regulation: Correlation or causation? Journal of Neuroscience. 2010;30:8692–8697. doi: 10.1523/JNEUROSCI.0160-10.2010. [DOI] [PMC free article] [PubMed] [Google Scholar]
- Sajda P, Philiastides MG, Parra LC. Single-trial analysis of neuroimaging data: inferring neural networks underlying perceptual decision-making in the human brain. IEEE Rev Biomed Eng. 2009;2:97–109. doi: 10.1109/RBME.2009.2034535. [DOI] [PMC free article] [PubMed] [Google Scholar]
- Schyns PG, Gosselin F, Smith ML. Information processing algorithms in the brain. Trends in Cognitive Sciences. 2009;13:20–26. doi: 10.1016/j.tics.2008.09.008. [DOI] [PubMed] [Google Scholar]
- Schyns PG, Thut G, Gross J. Cracking the code of oscillatory activity. Plos Biology. 2011;9 doi: 10.1371/journal.pbio.1001064. [DOI] [PMC free article] [PubMed] [Google Scholar]
- Shadlen MN, Newsome WT. Neural basis of a perceptual decision in the parietal cortex (area lip) of the rhesus monkey. Journal of Neurophysiology. 2001;86:1916–1936. doi: 10.1152/jn.2001.86.4.1916. [DOI] [PubMed] [Google Scholar]
- Siegel M, Engel AK, Donner TH. Cortical network dynamics of perceptual decision-making in the human brain. Frontiers in Human Neuroscience. 2011;5 doi: 10.3389/fnhum.2011.00021. [DOI] [PMC free article] [PubMed] [Google Scholar]
- Smith PL, Ratcliff R. Psychology and neurobiology of simple decisions. Trends in Neurosciences. 2004;27:161–168. doi: 10.1016/j.tins.2004.01.006. [DOI] [PubMed] [Google Scholar]
- Thut G, Nietzel A, Brandt SA, Pascual-Leone A. alpha-band electroencephalographic activity over occipital cortex indexes visuospatial attention bias and predicts visual target detection. Journal of Neuroscience. 2006;26:9494–9502. doi: 10.1523/JNEUROSCI.0875-06.2006. [DOI] [PMC free article] [PubMed] [Google Scholar]
- Tuladhar AM, ter Huurne N, Schoffelen JM, Maris E, Oostenveld R, Jensen O. Parieto-occipital sources account for the increase in alpha activity with working memory load. Human Brain Mapping. 2007;28:785–792. doi: 10.1002/hbm.20306. [DOI] [PMC free article] [PubMed] [Google Scholar]
- Van Dijk H, Schoffelen JM, Oostenveld R, Jensen O. Prestimulus oscillatory activity in the alpha band predicts visual discrimination ability. Journal of Neuroscience. 2008;28:1816–1823. doi: 10.1523/JNEUROSCI.1853-07.2008. [DOI] [PMC free article] [PubMed] [Google Scholar]
- Vanni S, Tanskanen T, Seppa M, Uutela K, Hari R. Coinciding early activation of the human primary visual cortex and anteromedial cuneus. Proceedings of the National Academy of Sciences of the United States of America. 2001;98:2776–2780. doi: 10.1073/pnas.041600898. [DOI] [PMC free article] [PubMed] [Google Scholar]
- VanRullen R, Koch C. Visual selective behavior can be triggered by a feed-forward process. Journal of Cognitive Neuroscience. 2003;15:209–217. doi: 10.1162/089892903321208141. [DOI] [PubMed] [Google Scholar]
- Weissman DH, Roberts KC, Visscher KM, Woldorff MG. The neural bases of momentary lapses in attention. Nature Neuroscience. 2006;9:971–978. doi: 10.1038/nn1727. [DOI] [PubMed] [Google Scholar]
- Worden MS, Foxe JJ, Wang N, Simpson GV. Anticipatory biasing of visuospatial attention indexed by retinotopically specific alpha-band electroencephalography increases over occipital cortex. Journal of Neuroscience. 2000;20 doi: 10.1523/JNEUROSCI.20-06-j0002.2000. art. no.–RC63. [DOI] [PMC free article] [PubMed] [Google Scholar]
- Wyart V, Dehaene S, Tallon-Baudry C. Early dissociation between neural signatures of endogenous spatial attention and perceptual awareness during visual masking. Frontiers in Human Neuroscience. 2011;6:16. doi: 10.3389/fnhum.2012.00016. [DOI] [PMC free article] [PubMed] [Google Scholar]
- Wyart V, Tallon-Baudry C. How ongoing fluctuations in human visual cortex predict perceptual awareness: Baseline shift versus decision bias. Journal of Neuroscience. 2009;29:8715–8725. doi: 10.1523/JNEUROSCI.0962-09.2009. [DOI] [PMC free article] [PubMed] [Google Scholar]
- Zhang Y, Wang X, Bressler SL, Chen YH, Ding MZ. Prestimulus cortical activity is correlated with speed of visuomotor processing. Journal of Cognitive Neuroscience. 2008;20:1915–1925. doi: 10.1162/jocn.2008.20132. [DOI] [PubMed] [Google Scholar]