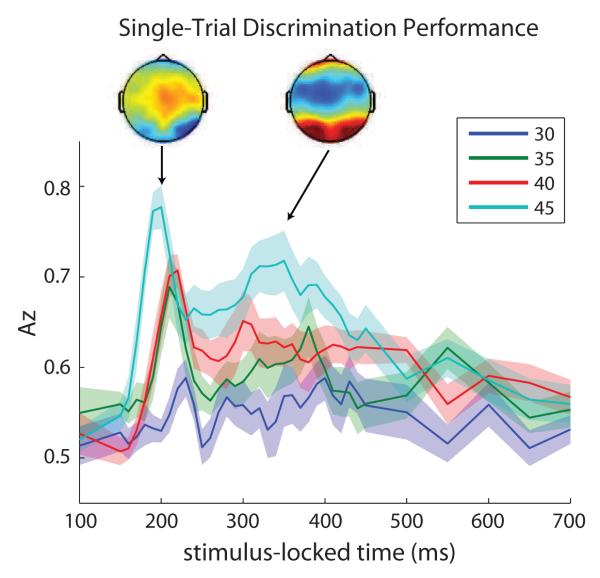
Figure 2.
Average single-trial EEG discrimination performance across subjects (N = 12) with 30ms training window. Bands represent standard error across subjects. For each subject, only discrimination components passing p < 0.05 were used for further analysis. Az values for phase coherences 20% and 25% are not shown since their EEG discrimination performance was worse than that of 30% coherence and never above the p < 0.05 significance level. Topographies represent the group averaged forward models of early (left) and late (right) components at time of peak discrimination (referred to as optimal discriminating components).

