

Abstract
Isolating a pure population of neural stem cells (NSCs) has been difficult since no exclusive surface markers have been identified for panning or FACS purification. Moreover, additional refinements for maintaining NSCs in culture are required, since NSCs generate a variety of neural precursors (NPs) as they proliferate. Here, we demonstrate that postnatal rat NPs express low levels of pro-apoptotic molecules and resist PI3K and ERK1/2 inhibition as compared to late oligodendrocyte progenitors. Furthermore, maintaining SVZ precursors in LY294002 and PD98059, inhibitors of PI3K and ERK1/2 signaling, eliminated lineage-restricted precursors as revealed by enrichment for Nestin+/SOX-2+ cells. The cells that survived formed neurospheres and 89% of these neurospheres were tripotential, generating neurons, astrocytes and oligodendrocytes. Without this enrichment step, less than 50% of the NPs were Nestin+/SOX-2+ and 42% of the neurospheres were tripotential. Additionally, neurospheres enriched using this procedure produced 3-times more secondary neurospheres, supporting the conclusion that this procedure enriches for NSCs. A number of genes that enhance survival were more highly expressed in neurospheres compared to late oligodendrocyte progenitors. Altogether, these studies demonstrate that primitive neural precursors can be enriched using a relatively simple and inexpensive means that will facilitate cell replacement strategies using stem cells as well as other studies whose goal is to reveal the fundamental properties of primitive neural precursors.
Keywords: cell death, caspase 3, apoptosis, brain, subventricular zone, differentiation
Introduction
With the discovery of the adult neural stem cell (NSC) many neuroscientists have sought to study the properties of this precursor. However, isolating a pure population of NSCs has been difficult since no exclusive surface markers have been identified in vivo or vitro to use for panning or FACS purification. Fluorescence activated cell sorting using antibodies to cell surface markers such as prominin-1 (CD133) or Lewis-X (LeX) (Uchida et al. 2000, Sawamoto et al. 2001, Capela & Temple 2002) have been used to isolate enriched populations of NSCs, however, these markers are not exclusively expressed by NSCs. Other protocols have used negative sorting (Maric et al. 2003) or transgenic mice that express GFP from either the nestin, GFAP or the SOX2 promoter (Kawaguchi et al. 2001, Ellis et al. 2004, Pastrana et al. 2009, Beckervordersandforth et al. 2010). While these methods produce highly enriched preparations of nestin+, Prominin+/GFAP+ or SOX2+ cells, only a fraction of the sorted cells are competent to form neurospheres (a colony of precursors presumably expanded from a single NSC), suggesting that a subset of the positive cells are stem cells. Furthermore, these transgenic approaches limit investigators to using mouse NSCs for their studies and require the creation of compound genetically engineered lines. Moreover, once NSCs are isolated, additional refinements in culture techniques are required to maintain them in culture, since it has been established that as the NSCs proliferate they generate a variety of rapidly dividing neural precursors (NPs), such that a typical neurosphere is comprised of only 1% bona fide NSCs (Reynolds & Rietze 2005, Buono et al. 2012)
Studies suggest that NSCs are resistant to several types of death stimuli. They are relatively resistant to death following neonatal hypoxia-ischemia (H-I) in vivo (Levison et al. 2002, Romanko et al. 2007) and they are also relatively resistant to radiation-induced damage (Hellstrom et al. 2009). They also are resilient to glutamate, glycine and muscimol toxicity in vitro (Brazel et al. 2005). Furthermore, NSCs require high endogenous levels of reactive oxygen species to self-renew (Le Belle et al. 2011). Cumulatively these studies lead to the conclusion that NSCs possess molecular adaptations that provide them with a survival advantage over other cells types, which makes great sense from the perspective of cell replacement and regeneration.
Two of the most often studied survival pathways include phosphatidylinositol 3′OH kinase (PI3K) and ras/raf/extracellular regulated kinase (ERK)-1/2 signaling. PI3K activates a serine/threonine kinase, Akt. PI3K and AKT activation are necessary for the survival of neural cells. For example, cerebellar neurons utilize the PI3K/AKT signaling pathway in response to IGF-I (Dudek et al. 1997). Likewise, activation of AKT by PI3K is necessary for NGF induced survival signaling in sympathetic neurons (Crowder & Freeman 1998).
Given the resistance of NSCs to cell death, we hypothesized that they might not require PI3K and ERK1/2 signaling to survive and performed studies to test this hypothesis. We added pharmacological inhibitors of PI3K and ERK1/2 to NP cultures, both alone and in combination, and assessed whether these treatments enriched for primitive NPs. To explore the molecular basis for their demonstrated resilience to cell death we compared the profile of pro- and anti-apoptotic mRNAs and proteins expressed by NPs to those of late oligodendrocyte progenitors (OPCs) as late OPCs have been shown to be especially vulnerable to death signals. Our studies provide new insights into the molecular properties that regulate the survival and proliferation of primitive NPs and late OPCs.
MATERIALS AND METHODS
Materials
MEM and DMEM:F12-glutamax culture media and trypsin were purchased from Invitrogen (Carlsbad, CA). Laminin and epidermal growth factor (EGF) were purchased from B.D. Biosciences (Franklin Lakes, NJ). Recombinant human fibroblast growth factor-2 (FGF-2) was purchased from Alomone Labs (Jerusalem, Israel). The Klenow fragment of DNA polymerase I was purchased from New England Biolabs (Beverly, MA). Lissamine-rhodamine-conjugated anti-digoxigenin Fab fragments from sheep, 10x DIG DNA labeling mixture, and biotin-16-dUTP were obtained from Roche Biochemicals (Indianapolis, IN). Glial fibriliary acid protein (GFAP) antibody was obtained from Dako (Carpinteria, CA), β-III tubulin antibody (TuJ1) was obtained from Promega (Madison, WI) and Rat-401 antibody (nestin) was generously provided by the Developmental Studies Hybridoma Bank (Iowa City, Iowa). Antibodies to AKT, phospho(Ser473)-AKT, Bcl-x and Bcl-2 were purchased from Cell Signaling Technology (Beverly, MA). Rabbit antibodies to β-tubulin were purchased from Santa Cruz Biotechnology, Santa Cruz, CA. Rabbit anti-sex determining region Y-box 2 (SOX2) was obtained from Chemicon, Temecula, CA. Donkey anti-rabbit IgG conjugated to Dylight 488 or to AMCA, donkey anti-mouse IgG conjugated to CY5 or Dylight 488 and Donkey anti-mouse IgM-RedX were purchased from Jackson Immunoresearch, West Grove, PA. Sheared salmon sperm DNA and the NuPage Western blotting gel system were purchased from Invitrogen. Enhanced chemiluminescence reagent was purchased from NEN-DuPont Renaissance (Boston, MA). RT-PCR was performed using commercially available RT kits (Qiagen, and Sigma, St. Louis, MO) on a Hybaid gradient thermal cycler (Hybaid, MD). 5% urea/acrylamide gels for RT-PCR were purchased from BioRad (Hercules, CA). LY-294002, PD-98059, glutamate and cell culture supplements were purchased from Sigma Chemical Co. Sheared salmon sperm DNA was purchased from Invitrogen. Superarray Q1.0 Mouse Apoptosis arrays and the TrueLabeling-RT kit were purchased from SA Biosciences (Valencia, CA). Standard laboratory reagents and tissue cultures supplies were purchased from Fisher Scientific (Pittsburgh, PA, USA) or VWR (Bridgeport, NJ).
Animals
Experimental animals were purchased from Charles River Laboratories (Wilmington, DE) and were housed and cared for at either the Hershey Medical Center or the New Jersey Medical School, which are Association for Assessment and Accreditation of Laboratory Animal Care (AAALAC) accredited facilities. Animal protocols were approved by local IACUC committees. The authors have reviewed the ARRIVE guidelines and have conformed to those guidelines.
Neural Precursor Cell Cultures
In this report, the term NP is used to refer to the mixed population of neural precursors that contains both NSCs as well transit-amplifying progenitors. The term NSC is reserved to refer to cells that are bona fide NSCs, meaning that they have been sufficiently characterized and found to fulfill all of the major criteria expected of NSCs. To generate cultures of NPs, neonatal SVZs were excised from newborn Wistar rat brains of both sexes, enzymatically dissociated and propagated in ProN media with 20ng/ml EGF, 10 ng/ml FGF-2, and 1 ng/ml heparan sulfate (ProN E/F). ProN composition: DMEM:F12 containing dipeptide L-analyl-L-glutamine (GlutaMAX™), 10 ng/ml d-biotin, 5 μg/ml insulin, 20 nM progesterone, 100 μM putrescine, 5 ng/ml selenium, 50 μg/ml apo-transferrin. Half the medium was replaced every 2 days. Spheres were propagated for 4 days in vitro (div) and then plated onto poly-D-lysine and laminin (PDL/Lam) coated coverslips. The medium used for plating cells for immunostaining was supplemented to 5% FBS to facilitate cell attachment overnight. To assess self-renewal, spheres were dissociated using trypsin, mechanically dissociated to achieve a single cell suspension and plated at clonal density (5 × 10³ cells/mL) in 96 well plates in a 1:1 mix of ProN E/F and neurosphere conditioned ProN E/F. Secondary sphere formation was assessed 12–14 d later.
Generation of mixed glial cultures and late OPC cell cultures
Rat mixed glial cell cultures were prepared as described by Levison and McCarthy (1991). Oligodendrocyte progenitors were isolated from confluent cultures by shaking at 260 RPM for 18 h. Isolated cells were collected and passed through a 15 μm screen and resuspended in N2B2 chemically defined media and plated on a 100 mm plastic dish to remove remaining microglia. N2B2 was composed of DMEM:F12 with 0.66 mg/ml BSA, 10 ng/ml d-biotin, 5 μg/ml insulin, 20 nM progesterone, 100 μM putrescine, 5 ng/ml selenium and antibiotics. Highly enriched cultures of late OPCs (90–95% O4+) were prepared as described by Young and Levison (1997). OPCs were first amplified in 30% B104 conditioned medium supplemented with 10 ng/mL FGF-2 or 2 days and then transitioned to N2B2 supplemented with 10 ng/mL FGF-2. Late OPCs were used for experiments 48 hours after growth in 10 ng/mL FGF-2 supplemented N2B2. Immunostaining for β-III tubulin, GFAP and O4 was performed as described previously (Felling et al. 2006).
Treatment of cell cultures for toxicity studies
NPs or late OPCs were plated on 8-well chamber slides. For all toxicity studies, treatment medium contained GlutaMAX™ in place of L-glutamine. For glutamate toxicity studies, the basal medium for NP treatment was CNM which has a reduced insulin concentration (5 ng/mL). Insulin concentrations were decreased as insulin at supraphysiological levels (5μg/mL) enhances survival by activating the type 1 insulin-like growth factor receptor (IGF-R).
For studies involving C6 ceramide, NP basal medium was ProN with 10 ng/mL FGF-2. For toxicity studies, the following concentrations were used: 1 μM Staurosporine (STS); 20 μM LY294002 (LY); 100 nM Wortmannin; 20 μM PD98059 (PD); and 10 μM C6 Ceramide.
Cell survival and death determination
Levels of necrosis in cell cultures were measured using the lactate dehydrogenase (LDH) release assay according to the manufacturers directions (Sigma). The MTT assay is a colorimetric assay that measures the reduction of 3-[4,5-dimetylthiazol-2-yl]-2,5-dipheniltetrazolium (MTT) as indicator of metabolically active mitochondria. The assay was performed following the manufacturer’s instructions (Sigma). ISEL was performed as described in Brazel et al. (2005).
Western Blotting
Protein was extracted from NP and late OPC cultures after treatments. Ten μg protein was separated on a 3–8% Tris-Acetate gel using the NuPAGE system, transferred to nitrocellulose membrane. Membrane blocking and primary and secondary antibody incubations were done in 5% milk in TBS-0.1% Tween-20. The HRP-conjugated secondary antibody was detected by enhanced Chemiluminescence (NEN). Images of blots were captured on the Epichem3 Darkroom UVP BioImaging System, and quantitative analysis of band densities was conducted using Labworks 4.0 Image Acquisition and Analysis Software supplied with the system.
Ribonuclease Protection Assay
Late OPC and NP cultures plated on 100 mm plates were rinsed with ice-cold PBSS and frozen at −80°C until RNA isolation. RNA was isolated according to the TRIZOL isolation protocol (Molecular Research Center, Inc., Cincinnati, OH). Detection of mRNA levels was conducted using the RiboQuant Ribonuclease Protection Assay (PharMingen, San Diego, CA) according to manufacturer’s directions. The multi-probe template set for rat apoptosis mRNA (rAPO-1, PharMingen) was used. To quantify the relative levels of mRNAs, gels were placed into a phosphor-imaging cassette, and band densities were analyzed with the ImageQuant program (Amersham, Piscataway, NJ). The intensities of the probe signals were normalized to the housekeeping gene, GAPDH.
SuperArray analysis
Analysis of RNA from late OPCs and 5 div DIV proliferating neurospheres was performed on the Q1.0 series mouse Apoptosis array following manufacturers instructions (SA Biosciences). Image were capture using the Epichem3 Darkroom UVP BioImaging System and quantitative analysis of spot densities was conducted using Labworks 4.0 Image Acquisition and Analysis Software supplied with the system. Comparison of RNA expression between the two samples analyzed was performed using the Gene Analyzer software provided by the company (http://www.sabiosciences.com).
Statistical analyses
Analysis of variance was used for group comparisons within an experiment. For experiments with multiple comparisons, adjusted P values associated with post-hoc group comparisons were calculated using Fisher’s PLSD method. All analyses were done using the Statview statistical software program. All statistical analyses were repeated on multiple experiments. Results were considered significant when p<0.05.
RESULTS
NPs resist multiple death signals
To determine the relative vulnerability of NPs and late OPCs to apoptotic stimuli, NPs and late OPCs were adhered to chamber slides and treated for 24 h with 20 μM wortmannin or 20 μM LY294002 (LY) to inhibit PI3K; 20 μM PD98059 (PD) to inhibit ERK 1/2; 1 μM staurosporine (STS) a broad-specicity kinase inhibitor; or 500 μM glutamate (glu), which is known to kill neurons and late OPCs, in basal medium containing physiological levels (5 ng/mL) of insulin to reduce signaling through IGF-R to create an environment that is “permissive” for NP death, and no growth or trophic factors. At 24 h, medium was collected to assay for LDH release before cells were fixed and processed for ISEL as an index of apoptosis. None of the treatments caused statistically significant increases in LDH release over control values in either NP or late OPC cultures (Fig. 1A). ISEL labeling revealed a basal level of cell death in the NPs equivalent to approximately 5% of the total cells. This fraction was not increased by any of the treatments at 24 h. By contrast, the fraction of ISEL + cells in the late OPC cultures was increased from 10% in control conditions to approximately 20% in wortmannin, 25% in glutamate and to 40% in STS at 24 h (Fig. 1B). Each of these increases proved to be statistically significant (p<0.05). While PD treatment elevated ISEL + cells in the late OPC cultures to approximately 20%, this increase was not statistically significant.
Figure 1. Neural Precursors are resistant to multiple apoptotic signals.
Four div SVZ NPs and late OPCs were adhered to chamber slides and treated with 1 μM staurosporine (STS), 20 μM wortmannin (wort), 500 μM glutamate (glu), or 20 μM PD98059 (PD) for 24 h in culture medium containing 5 ng/mL insulin. At 24 h, the culture medium was removed and tested for LDH activity (A) before processing for ISEL (B). * p<0.05 by ANOVA followed by Fisher’s PLDS analysis. Error bars represent S.E.M.s. These data are averaged from 3 independent experiments.
NPs survive simultaneous PI3K and Erk1/2 inhibition
To determine whether NPs become vulnerable to apoptotic stimuli over time, they were maintained in the presence of inhibitors of cell survival signals for up to 72 h, and their resiliency was evaluated. For this and subsequent studies we used another PI3K inhibitor, LY294002 (LY) instead of Wortmannin. NPs and late OPCs were adhered to 24 well plates before being treated with 20 μM LY, 20uM PD or 1 μM STS in ProN and FGF-2. NPs and late OPCs require both insulin-like growth factor receptor (IGF-R) and FGF-2 signaling to survive, proliferate and to prevent their differentiation; therefore, we maintained superphysiological levels of insulin and FGF-2 in the NP and late OPC cultures for this experiment to prevent the cells from progressing to a more mature stage over the course of the experiment. The MTT assay revealed that in this condition the controls at 48 and 72 h had 160% higher MTT reduction than 24 h (reflecting proliferation of late OPCs and NPs) (Figure 2). In late OPCs, inhibiting the PI3K pathway (LY) decreased MTT reduction levels to 55% of control by 24 h and to 40% of control by 72 h. MTT reaction product in late OPCs after 24, 48 and 72 h was significantly reduced (Fig 2A). Treatment with STS did not produce any MTT reaction product in late OPCs after 24, 48 or 72 h reflecting cell death. By contrast, in NPs MTT reduction was similar after treatment with LY or STS. After 24 and 48 h of LY or STS treatment the levels of MTT reaction were ~55% of control while after 72 h MTT reduction was approximately 35% of control (Fig 2B).
Figure 2. In superphysiological insulin, NPs cells and late OPCs respond similarly to PI3K inhibition.
Late OPCs (A) and 4 div proliferating NPs (B) were adhered to 24 well plates before treatment with 20 μM LY294002 or 1 μM staurosporine in basal medium (CTRL) containing superphysiological levels of insulin. At 24, 48, and 72 h, the MTT assay was performed to test for viability. Results were normalized to control values at 24 h and are averages of 3 independent experiments ± S.EM.s. * p<0.05 by ANOVA followed by Fisher’s PLDS analysis.
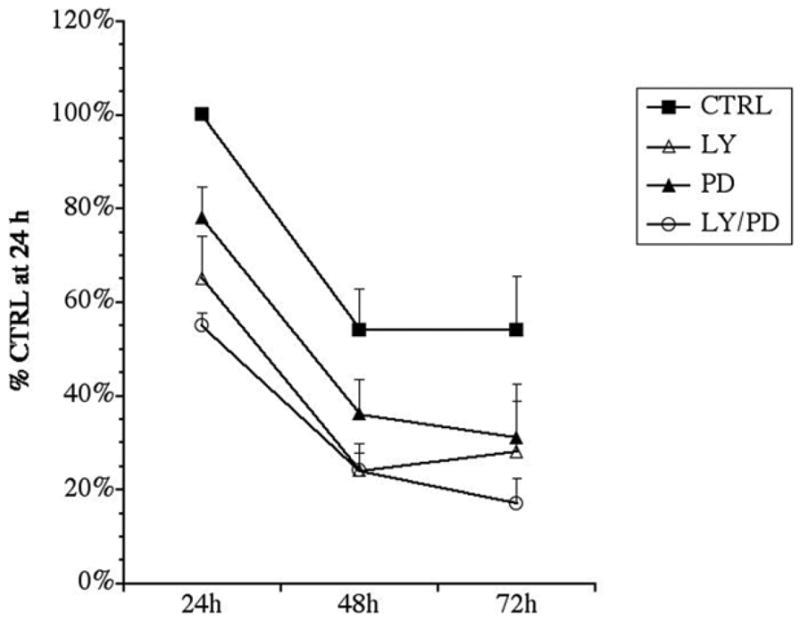
To determine whether inhibiting multiple signaling pathways would further decrease NP survival over time, NP cultures were treated with LY, PD or the combination for 72 h. For this experiment, insulin levels were reduced to 5 ng/ml to prevent signaling through the IGF-R and growth factors were omitted. In the control condition the MTT reaction decreased by 55% from 24 to 48 h. Inhibiting PI3K by addition of LY to NPs reduced MTT reduction to 70% of control at 24 h, and to 30% by 48 h, where viability was maintained through 72 h. Inhibition of ERK1/2 by addition of PD decreased NP MTT reduction to 80% at 24 h, 38% at 48h and to 30% by 72 h. The combination of both LY and PD decreased NP MTT reduction to 55% at 24 h, 25% at 48h and to 20% by 72 h (Fig. 3). However, the decrease in NP MTT reduction at 72 h with the combination of LY and PD was not statistically significant from the value obtained at 72 h with either factor alone. These results are consistent with the interpretation that simultaneously inhibiting PI3K and ERK1/2 promotes cell death of a subset NPs, with another subset resilient to PI3K and ERK1/2 inhibition.
Figure 3. A subset of NPs survive simultaneous inhibition of PI3K and ERK1/2.

NPs were isolated from P2 rat pups and propagated in ProN + E/F. At 4 div, spheres were adhered to coverslips and treated with 20 μM PD, 20 μM LY or LY + PD in low insulin-containing biochemically-defined medium (CTRL). MTT assays were performed at 24, 48, and 72 h to test for viability. Results are normalized to control at 24 h and are the average of 3 independent experiments ± sem. The following comparisons were statistically significant vs. control (p<0.05 by ANOVA followed by Fisher’s PLDS analysis). 24 h) LY; PD; LYPD. 48h) LY; LYPD; 72h) LYPD.
Inhibiting PI3K decreases AKT phosphorylation in NPs and late OPCs
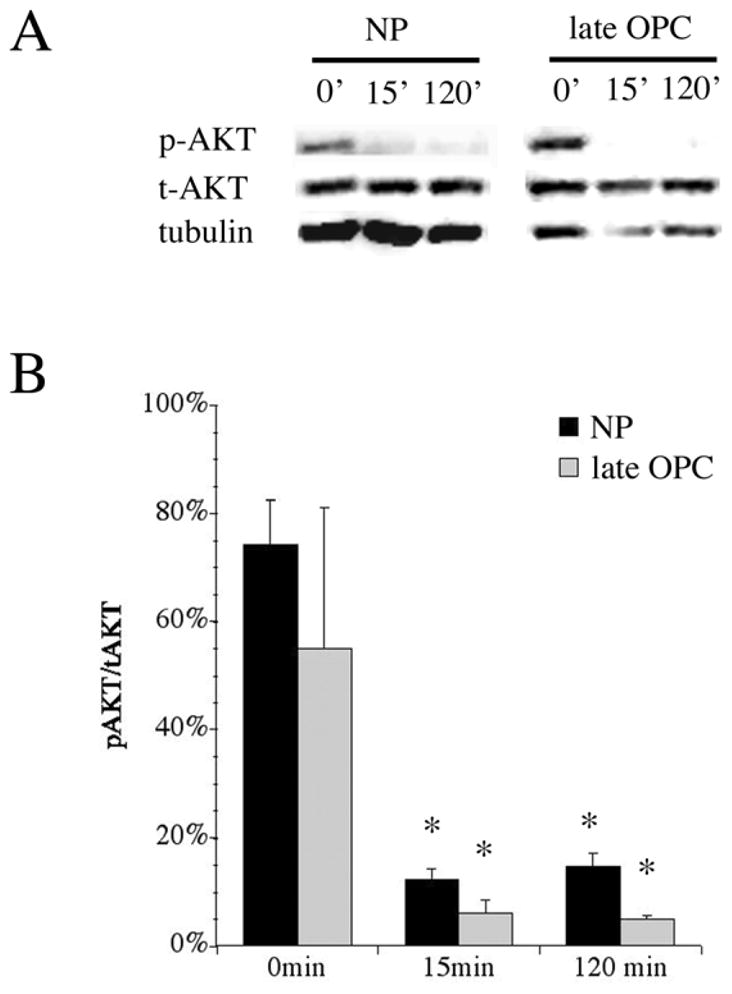
Since PI3K induces survival through the phosphorylation and activation of AKT, we hypothesized that NPs would retain phosphorylated AKT longer in the presence of a PI3K inhibitor than would late OPCs. To test this hypothesis, we treated NP and late OPC cultures in superphysiological levels of insulin with 20 μM LY for 15 min or 2 h before isolating total protein and performing Western blot analysis for total AKT (t-AKT), phospho(serine 473)-AKT (p-AKT) (Fig. 4A). Total AKT was normalized to β-tubulin content. t-AKT levels remained constant in both NPs and late OPCs following LY treatment (data not shown). We next determined whether p-AKT levels were changing in response to LY treatment. p-AKT levels were normalized to t-AKT content at each time point tested (Fig. 4B). At the beginning of the experiment, 75% of the AKT in NPs maintained in superphysiological insulin and FGF-2 was phosphorylated at ser473, whereas only 55% of the AKT was phosphorylated in late OPCs, although this difference was not statistically significant. Following 15 min of LY treatment, AKT phosphorylation was significantly reduced in both NPs and late OPCs (to 12% and 6%, respectively). AKT phosphorylation remained reduced in both groups at 120 minutes (15% vs. 5%, respectively).
Figure 4. Inhibition of PI3K decreases p-AKT levels in both late oligodendrocyte progenitors and neural stem/progenitor cells.

Total protein was isolated from 5 div proliferating NPs grown in FGF-2 following treatment with LY for 0,15, or 120 minutes. A) Representative Western blots for t-AKT, p-AKT (Ser473), and β-tubulin. B) Quantitation of p-AKT content, normalized to t-AKT. Results are the average of 3 independent experiments ± sem. * p<0.05 by ANOVA followed by Fisher’s PLDS analysis, as compared to p-AKT content at 0 min.
Inhibiting PI3K and ERK 1/2 enriches for primitive neural precursors
Based on our data and data from other studies, we hypothesized that differentiated precursor are more sensitive to PI3K and ERK1/2 inhibition, as shown for late OPCs. Therefore, the surviving population would be enriched in more primitive NPs. To test this hypothesis we examined the expression of SOX2, a transcription factor that is essential for maintenance of self renewal, and Nestin, an intermediate filament expressed in neuronal precursors. NPs treated for 3 days with LY, PD or LY+PD in basal media with physiological insulin levels (CNM E/F), were seeded into chamber slides coated with PDK/Lam, allowed to attach for 14h and then fixed before substantial cell differentiation could ensue. In the control NP cultures that were grown for 3 days in the absence of inhibitors, only 35% of the cells were SOX2+/Nestin+ and the level of SOX2 fluorescence was lower than seen in the other conditions (Figure 5A). The percentage of SOX2−/Nestin+ was ~60% (Figure 5B). Inhibiting PI3K and/or ERK1/2 significantly increased the percentage of SOX2+/Nestin+ cells to 70–80% (p<0.01) at the expense of the SOX2−/Nestin+ cohort (Figure 5B).
Figure 5. Inhibiting PI3K kinase and ERK 1/2 enriches for primitive neural precursors.
Representative immunofluorescence images of NPs grown for 3 days in the absence (Control) or presence of LY, PD or LY + PD. NPs were obtained from P4 rat neonatal SVZs and grown in vitro as neurospheres in ProN +E/F for 3 days before inhibitor addition. Incubation with LY, PD or LY/PD was performed in ProN+E/F, 5ng/mL insulin. After exposure to inhibitors cells were dissociated and plated onto chamber slides for 14 h before fixation. Immunofluorescence was performed with primary antibodies against SOX2 (green), Nestin (red) with DAPI counterstain (Blue). B) Quantification of SOX2+/Nestin+ cells. Twenty images were analyzed per treatment group totaling 700–1100 cells per group. Results are representative of 3 independent experiments. Data were analyzed using one-way ANOVA followed by Tukey’s pot-hoc analyses. ***p<0.001, **p<0.01.
Inhibiting PI3K increases multipotent neurospheres
To determine which type of precursor was surviving despite inhibiting PI3K or ERK1/2, we asked whether spheres would form from primary SVZ cultures treated for 72 h with LY alone or in combination with PD (Fig. 6). SVZs were excised from the brains of P2 rat pups and placed into ProN + E/F along with 1 μM STS, 20 μM LY, 20 μM PD, or the combination of LY and PD (Fig. 6A) for a total of 72 h (Fig. 6B, D, also see Fig. 6G). Following the 72 h incubation, remaining cells or spheres of cells were rinsed to eliminate STS, LY, and PD, then incubated for another 3–5 days in ProN + E/F to allow neurosphere formation (Fig. 6C, E, F). STS completely depleted the cultures of live cells following 72 h of treatment (data not shown). By contrast LY did not suppress neurosphere formation compared to controls (Fig. 6B, D). Spheres continued to grow when LY was rinsed from the cultures and replaced with ProN + E/F for an additional 3–5 div (Fig. 6E, F). However, the resulting spheres were on average one-half the size of control spheres at 48 h after the release of PI3K inhibition. When spheres were treated with the combination of LY and PD, neurosphere formation was noticeably suppressed. Those spheres that did form were small and consisted of 3–10 cells (data not shown). When LY/PD was rinsed from the cultures and replaced with ProN + E/F for an additional 3–5 div, neurosphere formation resumed in the LY/PD treated group, reaching a size at 5 div post-rinse that was equivalent to controls at 2 div post-rinse (data not shown).
Figure 6. Neurospheres form in the absence of PI3K signaling.

Neonatal SVZs were excised from P2 rat pups, dissociated into single cell suspension, and plated into 24 well tissue culture dishes at a density of 5 × 10⁴ cell/ml in ProN + E/F (shown in panel A). Cultures were treated with ProN + E/F or ProN + E/F + 20 μM LY for 72 h. After 72 h, cultures were rinsed with basal medium, then resuspended in ProN + E/F for additional 2–3 div. Panel B depicts control cultures grown in ProN +E/F for 72 h. Panel C shows control cultures grown in ProN +E/F for an additional 2 div following a rinse at 72 h. Panel D shows cells treated with LY for 72 h. Panel E shows cells treated with LY for 72 h, rinsed and grown in ProN + E/F for an additional 2 div. Panel F shows cells treated with LY for 72 h, rinsed and grown in ProN + E/F for an additional 3 div. Images were captured at 20X. Panel G diagrams the experimental procedure.
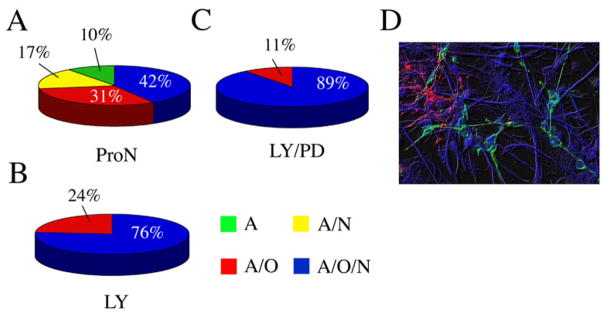
To determine whether LY or LY/PD treatment might select for multipotent NSCs, spheres that had been maintained as above for 3d in the inhibitors followed by a 2d recovery were adhered to PDK/Lam coated chamberslides and differentiated for 72 h. Cultures were then fixed and immunostained for β-III tubulin (TuJ1, neurons), O4 (late OPCs), GFAP (astrocytes) and DAPI. Individual colonies were scored as being multipotent (containing at least one cell type from each lineage), bipotent (containing at least one astrocyte and either one neuron or one late OPC) or unipotent (containing only astrocytes). Colonies were not observed that contained only neurons or only late OPCs. Each of the culture conditions gave rise to multipotent spheres. However, only 42% of the spheres were multipotent in control conditions, whereas treatment with LY or LY/PD significantly increased the fraction of multipotent spheres to 76% and 89%, respectively (Fig. 7). Additionally, while 10% of the spheres in control conditions were unipotent, cultures pre-treated with LY or LY/PD never gave rise to unipotent clones. These data suggest that the addition of LY/PD depletes NP cultures of progenitors and thus effectively enriches for stem cells.
Figure 7. Tripotential NPs survive in the presence of PI3K and ERK1/2 inhibitors.

Neonatal SVZs were dissociated into single cell suspension, and plated at a density of 5 × 10⁴ cells/ml in ProN + E/F, ProN + E/F + LY or ProN + E/F + LY/PD. After 72 h, cultures were rinsed with basal medium, then resuspended in ProN + E/F for an additional 72 h. Resultant neurospheres were differentiated for 72 h. Cultures were then fixed and immunostained for β-III tubulin (TuJ1, neurons) GFAP (astrocytes), O4 (Late OPCs) and DAPI. Colonies were scored on the types of cells present: astrocytes only (“A”, green), astrocytes and neurons (“A/N”, yellow), astrocytes and oligodendrocytes (“AO”, red), or astrocytes, oligodendrocytes, and neurons (“AON”, blue). Panel D depicts an image of a tripotential colony. Results are the average of 3 independent experiments.
C6 Ceramide is toxic to both NPs and late OPCs
Ceramide is involved in multiple signaling pathways and in many cells it is a mediator of cell death that exerts its effects by inhibiting AKT and MAPK signaling (reviewed in (Pettus et al. 2002). Ceramide can also activate c-jun kinase (JNK), protein kinase C (PKC) ζ, protein phosphatase 2A, kinase suppressor of Ras, as well as many other signaling proteins. Because of its pleiotropic actions, we hypothesized that C6 ceramide would induce apoptosis in NPs. To this end, 4 div proliferating NPs and late OPCs were adhered to 24 well plates, and then treated with 10 μM C6 ceramide in basal medium containing superphysiological levels of insulin. Samples of the culture medium were removed at 6, 24, 48, and 72 h to test for LDH activity before performing an MTT assay to test for viable cells. LDH activity was not significantly increased in either NPs or late OPCs (data not shown). By contrast, survival of both NPs and late OPCs were reduced to 25% by 24 h, reaching just 10% at 72h (Fig. 8). The few cells that persisted for 72 h appeared unhealthy and hence these studies were not pursued further.
Figure 8. C6 ceramide reduces NP and late OPC viability.
Four div proliferating NPs and late OPCs were adhered to 24 well plates and treated with 10 μM C6 ceramide or basal medium containing superphysiological levels of insulin. An MTT assay was performed at 6, 24, 48, and 72 h. Results are the average of 3 independent experiments ± sem. * p<0.05 by ANOVA followed by Fisher’s PLDS analysis, as compared to control conditions for both late OPCs and NPs.
Bcl-xL is increased in NPs as compared to late OPCs
To determine whether the relative resilience of the stem cells was due to intrinsic differences in gene expression, which would lead to enhanced survival of NPs when challenged with death stimuli, we performed an RNase protection assay for several apoptosis family members. As shown in Fig 8, NPs contained twice the amount of Bcl-x and Bcl-2 mRNAs as compared to late OPCs. None of the other mRNAs represented on the RPA were significantly different between the NPs and the late OPCs.
To verify that the higher levels of bcl-2 and Bcl-x mRNAs in NPs were translated into protein, Western blots were performed for bcl-2 and Bcl-xL using protein obtained from late OPCs and 5 div proliferating NPs (Fig 9A). As shown in Fig 9, NPs contained approximately 56% more bcl-2 protein than late OPCs, although this difference did not prove to be statistically significant (p=0.52). However, NPs contained 62% more Bcl-xL protein than late OPCs, an increase that was statistically significant (p<0.03, Fig 9E).
Figure 9. NPs contain higher levels of bcl-x and bcl-2 mRNA than late OPCs.

mRNA was isolated from 5 day in vitro proliferating NPs grown in ProN + E/F or late OPCs grown in a basal medium containing superphysiological insulin and 10 ng/ml FGF-2. An RNase protection assay was performed to determine expression levels of apoptosis-related mRNAs. A) Representative example of the assay. Band locations for respective mRNAs are indicated. B) Quantitation of mRNA bands from the RPA analysis normalized to GAPDH.. * p<0.05 by ANOVA followed by Fisher’s PLDS analysis, as compared to late OPC expression levels. C–E. Western blot analysis for bcl-xL, bcl-2, and β-tubulin. C) Results of a representative experiment blotted for bcl-xL, bcl-2, and β-tubulin. D) Quantitation of bcl-2 content, normalized to β-tubulin. E) Quantitation of bcl-xL content, normalized to β-tubulin. Results shown in B, D an E are the averages of 3 independent experiments ± sem. * p < 0.05 by ANOVA followed by Fisher’s PLDS analysis.
Late OPCs contain higher levels of pro-apoptotic molecules as compared to NPs
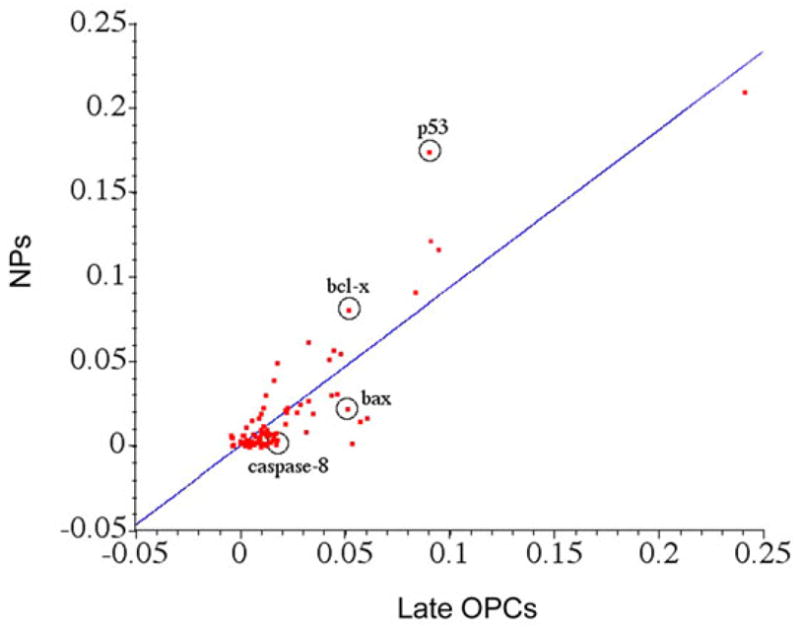
To further evaluate levels of pro-survival and pro-apoptotic molecular profiles, we performed a gene-array analysis to compare apoptotic mRNA levels between NPs and late OPCs. Ninety-six apoptosis related genes were represented on the cDNA array. Fig. 10 graphically represents the data obtained from one of the two experiments performed. Differences were considered significant when there was a 1.5 fold or higher increase in mRNA expression across these two independent experiments. Six out of 96 genes represented on the array were more highly expressed in NPs as compared to late OPCs, including two anti-apoptotic molecules (Bcl-X and TRAF1), two cell cycle checkpoint molecules (Chk1 and P53), and one pro-apoptotic molecule (caspase 2) (Table 1). By contrast, 32 of 96 genes were more highly expressed in late OPCs as compared to NPs (Table 2). Seventeen of the 32 are pro-apoptotic, 5 are anti-apoptotic, and the rest are involved in proliferation, differentiation, or cell cycle checkpoint control (Table 2).
Figure 10. Graphic representation of SuperArray analysis.

mRNA was isolated from 5 div proliferating NPs grown in ProN + E/F and late OPCs grown in basal medium with superphysiological insulin +FGF-2. 500 ng of each mRNA was reverse transcribed and labeled with d-biotin using the Superarray True-labeling kit, then hybridized to the Q1.0 mouse apoptosis Superarray. Results were quantified using software supplied by the company, then plotted on opposite axes. Results depict the relative expression of the probes on the array for these two populations and are representative of 2 independent experiments.
Table 1.
Genes enriched in NPs
| Gene Name | >1.5 fold expression NP/late OPC | Fold Increase | Function |
|---|---|---|---|
| Arc | activity regulated cytoskeletal-associated protein | 2.2 | Immediate early gene that associates with the cytoskeleton |
| Bcl-x | Bcl-2-like | 1.8 | anti-apoptotic protein |
| Caspase-2 | caspase 2 | 2.4 | pro-apoptotic protein |
| Chk1 | checkpoint kinase Chk1 | 3.0 | cell cycle checkpoint |
| TRAF1 | TNF receptor-associated factor 1 | 2.2 | anti-apoptotic, cleaved form is pro-apoptotic |
| p53 | Transformation related protein 53 | 2.2 | cell cycle checkpoint/pro-apoptotic |
Table 2.
Genes enriched in late OPCs
| Gene Name | >1.5 fold expression late OPC/NP | Fold Increase | Function |
|---|---|---|---|
| Bax | bcl2-associated X protein | 2.4 | pro-apoptotic |
| Hrk | BH3 interacting (with BCL2 family) domain, apoptosis agonist | 2.7 | pro-apoptotic |
| Bik | Bcl2-interacting killer-like | 2.7 | pro-apoptotic |
| Blk | B lymphoid kinase | 2.1 | pro-apoptotic |
| Caspase 12 | Caspase 12 | 6.5 | pro-apoptotic |
| Caspase 14 | Caspase 14 | 3.9 | pro-apoptotic |
| Caspase 8 | Caspase 8 | 9.3 | pro-apoptotic |
| DAP kinase | Death-associated kinase 2 | 3.4 | pro-apoptotic |
| LTα | mouse tumor necrosis factor-β/lymphotoxin-α | 3.8 | pro-apoptotic |
| FASL | Fas ligand | 6.9 | pro-apoptotic |
| TNF-R1 | Murine tumor necrosis factor I receptor | 2.4 | pro-apoptotic |
| Tnfrsf9 | Mouse T-cell receptor 4-1BB protein mRNA | 5.9 | pro-apoptotic |
| TRAIL | TNF-related apoptosis inducing ligand | 3.1 | pro-apoptotic |
| Tnfsf11 | Tumor necrosis factor (ligand) superfamily, member 11 | 30.1 | pro-apoptotic |
| APO3L | Tumor necrosis factor (ligand) superfamily, member 12 | 2.4 | pro-apoptotic |
| Tnfsf14 | Tumor necrosis factor (ligand) superfamily, member 14 | 7.3 | pro-apoptotic |
| TRIP | TRAF-interacting protein | 2.8 | pro-apoptotic |
| Bcl2 | B-cell leukemia/lymphoma 2 | 3.7 | anti-apoptotic |
| Bcl-10/HuE10 | Bcl2 like 10 | 4.8 | anti-apoptotic |
| Bcl-w | Bcl2 like 2 | 2.2 | anti-apoptotic |
| NAIP2 | Baculoviral IAP repeat-containing 1b | 4.9 | anti-apoptotic |
| NAIP5 | Baculoviral IAP repeat-containing 1e | 5.7 | anti-apoptotic |
| Caspase 1 | Interleukin-1 beta convertase | 4.8 | cytokine processing |
| Caspase 11 | Caspase 11 | 1.9 | cytokine processing |
| CD27L | Tumor necrosis factor (ligand) superfamily, member 7 | 7.2 | proliferation |
| OX40L | Mus musculus OX40 ligand (Ox40l) mRNA | 2.3 | proliferation/differentiation |
| CD30L | Mus musculus Cd30 ligand mRNA | 4.0 | proliferation/differentiation/anti-apoptotic |
| CD40L | M.musculus mRNA for CD40 ligand | 9.7 | proliferation/differentiation/anti-apoptotic |
| OPG | Tumor necrosis factor receptor superfamily, member 11 b (osteoprotegerin) | 3.2 | decoy receptor for RANKL |
| p21WAF1 | cyclin-dependent kinase inhibitor | 3.4 | cell cycle inhibitor, senescence |
| TRAF5 | Mouse mRNA for Tnf receptor-associated factor 5 protein | 7.7 | receptor-dependent |
| Nop30-like | RIKEN cDNA >84% homology with human nucleolar protein 3, Nop30 | 2.2 | Involved in DNA splicing |
DISCUSSION
Neonatal H-I causes the apoptotic and excitotoxic death of OPCs in the periventricular white matter and in the lateral tail of the subventricular zone (Ness et al. 2001). By contrast, the NSCs and primitive NPs in the medial portion of the SVZ are spared (Rothstein & Levison 2002, Romanko et al. 2004), suggesting that the NPs residing in this region are resistant to death effectors. Indeed, not only are NPs resistant to glutamate excitotoxicity but NPs proliferate in response to glutamate receptor stimulation (Brazel et al. 2005). By contrast, late OPCs are sensitive to glutamate-mediated excitotoxicity (Ness & Wood 2002, Ness et al. 2004, Simonishvili et al. 2013). Based on these observations, we hypothesized that NPs would be resistant to other cell death stimuli as compared to late OPCs. We show here that 1) NPs are resistant to cell death induced by PI3K inhibition, ERK1/2 inhibition and glutamate stimulation at 24 h while late OPCs are vulnerable to these stimuli; 2) neurospheres continue to be produced from NPs even after treatment for 72 h PI3K and ERK1/2 inhibitors; 3) AKT phosphorylation at ser473 is not necessary for primitive NP survival; 4) propagating NPs in PI3K and ERK 1/2 inhibitors for 72 h greatly increases the proportion of NPs that are SOX-2+/Nestin+; 5) a greater proportion of the neurospheres are multipotent after treatment with LY and PD; 6) NPs are enriched in anti-apoptotic mRNAs, including bcl-xL and the TNF-Receptor associated factor 1 (TRAF1); 7) NPs contain 62% more bcl-xL protein than do late OPCs; 8) late OPCs are enriched in pro-apoptotic molecules as compared to NPs; and 9) NPs and late OPCs are equally sensitive to C6 ceramide. Altogether, these data indicate that NPs are more resistant to multiple (but not all) death effectors compared to late OPCs.
PI3K signaling has been shown to mediate survival in both neurons and oligodendrocytes. Trophic factors such as IGF-1, NGF, and BDNF all promote neuronal survival through PI3K and the subsequent activation of AKT. For instance, PI3K signaling is necessary for the NGF-mediated survival of sympathetic neurons from the rat superior cervical ganglion (SCG) (Crowder & Freeman 1998). Dominant negative constructs of AKT prevent SCG and cerebellar granule neuron survival even in the presence of NGF or superphysiological insulin (Dudek et al. 1997, Crowder & Freeman 1998). Survival signaling through PI3K/AKT is also important in oligodendrocyte-lineage cells. PI3K is necessary for the survival of OPCs, as inhibition of PI3K with either wortmannin or LY294002 severely limits OPC survival at 24 h (Vemuri & McMorris 1996). IGF, a potent survival factor for late OPCs, protects late OPCs from glutamate-mediated apoptosis via activation of PI3K (Ness & Wood 2002, Ness et al. 2004, Simonishvili et al. 2013). Likewise, PDGF promotes survival of early OPCs through a PI3K mediated signaling pathway (Grinspan & Franceschini 1995, Ebner et al. 2000).
Our results are in agreement with previous studies on OPCs, with 30% of the late OPCs surviving out to 72 h in the presence of LY294002. While the study by Vemuri and McMorris (1996) demonstrated that neither IGF-1 nor FGF-2 signaling could prevent the death of oligodendrocytes and their precursors from the inhibition of PI3K at 24 h, another study suggested that FGF-2 can promote the survival of late OPCs in the presence of a PI3K inhibitor through the MAPK pathway (Ebner et al. 2000). Additionally, oligodendrocytes that have matured to the O1+ stage and beyond can use FGF-2 stimulated ERK2 activation for survival (Yang et al. 2000). One mechanism by which 30% of the late OPCs in our studies could be surviving in the presence of LY is through FGF-2 mediated MAPK activation. Thus, a portion of the late OPCs treated with LY may have begun maturing to the O1+ stage, and thus FGF-2 would provide a potent trophic signal in the presence of LY. PI3K also has been shown to be required for OPC proliferation, therefore, the reduction in cell number seen is also a reflection of reduced progenitor cell proliferation(Frederick et al. 2007).
PI3K acts through the PI3K-dependent kinase 1 (PDK1) to phosphorylate AKT at threonine 308 and through integrin-linked kinases to phosphorylate AKT at serine 473. We show here that inhibition of PI3K with LY294002 decreases AKT phosphorylation of ser473 in NPs from 85% to just 13% within 15 minutes of the addition of the inhibitor (Fig. 2). These data lead to the conclusion that PI3K is responsible for the phosphorylation of this serine residue on AKT in NPs, but in contrast to late OPCs, this event is not necessary for NP survival. While these data suggest that PI3K activation is not necessary for NP survival, we cannot exclude AKT as a necessary component for NP survival as AKT can be activated in a PI3K independent manner in response to cellular stress through heat shock protein 27 (Konishi et al. 1997), β-adrenergic receptor agonists such as isproterenol (Moule et al. 1997) and cyclic AMP (cAMP) (Sable et al. 1997).
The ras/raf/MAPK pathway has also been implicated in neural cell survival. Camptothecin is an inhibitor of DNA topoisomerase 1 and induces DNA strand breaks during replication. Cortical neuron cultures treated with camptothecin undergo apoptosis and this death can be blocked by brain derived neurotrophic factor (BDNF). Inhibition of ERK1/2 by PD98059 prevents the BDNF-rescue from camptothecin-induced apoptosis (Hetman et al. 1999). Likewise, neuronal death can be prevented by intraventricular BDNF infusion following neonatal H-I, which activates the ERK1/2 pathway and attenuates caspase 3 activation. When ERK1/2 is inhibited in the presence of BDNF following neonatal H-I, caspase 3 remains activated, suggesting that BDNF exerts its effect through ERK1/2 to prevent neuronal apoptosis (Han & Holtzman 2000). ERK1/2 also plays a role in oligodendrocyte survival. The combination of platelet derived growth factor (PDGF) and FGF-2 promotes potent survival and mitogenic signals in early OPCs. Both factors can activate ERK1/2 (Yim et al. 2001).
To determine whether the activation of ERK1/2 is essential for NP survival, we inhibited ERK1/2 activation using PD98059. While there was a trend for ERK1/2 inhibition to induce ISEL + cells in late OPC cultures, this trend did not prove to be statistically significant (p=0.059). Likewise, ERK1/2 inhibition did not induce ISEL + NPs at 24 h. However, using the MTT assay there was 30% less MTT reduction at 72 h vs. controls. This effect may be due to reduced proliferation, increased cell death, or the combination of both.
The data presented in this paper support previous studies that showed that OPCs are extremely sensitive to STS treatment, with practically 100% of the cells dying by 24 h (Scurlock & Dawson 1999). However, NPs demonstrated resistance to STS, with 30% of the cells surviving following 72 h STS treatment (Fig. 2B). However, when dissociated primary SVZ cultures were treated with STS for 72 h, no neurosphere forming cells remained in the cultures (data not shown). These data suggest at least two possibilities: 1) the resiliency of NP cultures to 72 h treatment of STS depended on survival signaling provided by the PDL/Lam coating on which the cultures were plated or 2) the resiliency of NPs plated to chamberslides as compared to the susceptibility of NPs in single cell suspension was due to cell contact. In either case, individual NPs were sensitive to STS, while NPs plated on PDL/Lam substrate were resistant. Adult NSCs, by contrast, have been shown to be sensitive to just 250 nM STS over 18 h, and to exhibit nuclear condensation, cytochrome c release and caspase activation. Apoptosis was prevented by incubation with the pan-caspase inhibitor Z-VAD fmk (Sleeper et al. 2002). These data suggest that neonatal and adult-derived NSCs may have differential sensitivities to death stimuli.
Many different methods have been introduced to enrich primary SVZ cultures for stem cells. The majority of these methods rely on transgenic mice and/or FACS to obtain a relatively pure population of cells (Rietze et al. 2001, Kawaguchi et al. 2001, Beckervordersandforth et al. 2010, Pastrana et al. 2009). While such transgenic mice are useful, the methods presented in this paper allow for the enrichment of self-renewing, SOX-2+/Nestin+, sphere forming cells to > 80% purity without the need for sorting and this method can be applied to cultures created from mammals other than mice. While we have not yet compared the number of sphere-forming cells in control cultures vs. LY or LY/PD treated cultures to determine whether all cells surviving LY/PD treatment go on to form neurospheres, treatment of primary SVZ cultures with the combination of 20μM LY and 20μM PD enriched for multipotent neurospheres, while bipotential and unipotential neurospheres were very limited in number. Importantly, all cells isolated from the SVZ were grown under identical culture conditions, and only the multipotent sphere-forming cells survived LY/PD treatment while more mature progenitor cells perished or attached to the culture dish. These data suggest that NSCs are predisposed to survive. However, we cannot rule out the possibility that this treatment is reverting a bipotential progenitor backwards to a tripotential cell.
In contrast to the previous findings, C6 ceramide proved to be toxic to both NPs and late OPCs. Toxicity of ceramide to oligodendrocyte lineage cells has been previously demonstrated. The C2 analog of ceramide kills 60% of early OPCs within 6 h of treatment (Brogi et al. 1997). TNFα has been shown to induce ceramide production in oligodendrocyte progenitors, which can then induce apoptosis (Pong et al. 2001). Likewise, staurosporine induces ceramide production prior to DNA fragmentation in mature oligodendrocytes. Our results with STS killing are consistent with the toxicity of C6 ceramide (Scurlock & Dawson 1999). In this study, we demonstrate that NPs and late OPCs follow a similar timecourse of cell death in the presence of 10 μM C6 ceramide, with 30% survival at 24 h and less than 5% survival by 72 h. Interestingly, ceramide increases during asymmetric division of NPs, and the daughter cell co-expressing Par4 undergoes apoptosis (Bieberich et al. 2003). Therefore, ceramide expression may also serve as an endogenous signal involved in the regulation of NP cell numbers.
The bcl-2 family of proteins plays a prominent role in the regulation of apoptosis from a variety of stimuli. The family is comprised of two types of members: those that prevent apoptosis such as bcl-2 and bcl-xL, and those that promote apoptosis such as bax, bid, and hrk. The relative abundance of pro- vs. anti-apoptotic members within a cell coincides with either survival or death (Reed 1997). We show here that bcl-xL is enriched in NPs as compared to late OPCs. This high level of bcl-xL expression in NPs may contribute to their resistance to death stimuli through a variety of mechanisms. First, bcl-xL has been shown to inhibit cytochrome c release from the mitochondria, thereby preventing apoptosis (Lutz 2000). Bcl-xL also binds to and suppresses the activity of the caspase activator APAF1, thereby preventing formation of the apoptosome and thus promoting survival (Lutz 2000). Bcl-xL overexpression can also prevent Fas-mediated cell death (Holinger et al. 1999). Results from the bcl-x knockout mice revealed that the majority of cell death occurred in MAP-2 expressing regions of the brain, and that less cell death occurred in the proliferative ventricular zone and MAP-2 negative regions (Motoyama et al. 1995). NPs may also contain a low abundance of pro-apoptotic genes as compared to more mature cell in the brain which also contribute to their resistance, as demonstrated by the relative abundance of pro-apoptotic genes found in late OPCs when compared to NPs.
In order to look broadly at mechanisms by which NPs are more resistant to cell death than late OPCs, we performed a gene-array analysis of 96 apoptosis-related genes using mRNA from late OPCs and proliferating NPs. Out of the 96 genes surveyed, 6 were more highly expressed in NPs as compared to OPCs, including the cell cycle checkpoint regulators chk1 and p53. This analysis also confirmed the differential expression of bcl-xL in NPs as compared to late OPCs.
The cell cycle checkpoint regulators chk1 and p53 inhibit progression of the cell cycle through G1 and/or G2 in the presence of DNA damage. Induction of DNA damage by ionizing or ultraviolet radiation activates the PI3K related protein kinases ATR and ATM, respectively. These kinases can then activate chk1, which in turn can autophosphorylate itself to increase its kinase activity ((reviewed in Pearce & Humphrey 2001). Once chk1 is activated, it can maintain cells in either G1 or G2 through a variety of mechanisms. For instance, chk1 activation prevents activation of cdc2 to maintain cells in G2 (Zhou & Elledge 2000, reviewed in Pearce & Humphrey 2001). Additionally, chk1 can phosphorylate and stabilize p53, thereby preventing p53 degradation. p53 stabilization leads to the transcription of p21 and cyclin-dependent kinase inhibitory proteins to inhibit cell cycle progression. Additionally, p53 can repress the topoisomerase II gene, again preventing progression into mitosis and maintaining cells in G2 (reviewed in Taylor & Stark 2001).
P53 can be activated by hypoxia, reactive oxygen species and aberrant growth factor signaling in addition to DNA damage (Giaccia & Kastan 1998, Ljungman 2000), and induces cell cycle arrest that is generally transient and is relieved once the DNA damage has been repaired (Kastan et al. 1991). p53 can also induce terminal cell cycle arrest (Di Leonardo et al. 1994, Linke et al. 1997). Therefore, the increased expression of chk1 and p53 in NPs could lead to increased NP survival by delaying cell cycle progression in the face of DNA damage, giving the cells time to repair their DNA prior to progressing through the cell cycle.
In contrast to the limited number of genes enriched in the NPs, late OPCs are enriched in 32 of 96 genes represented on the array, 16 of which are pro-apoptotic (Table 2). Some of these pro-apoptotic genes are bcl-2 family members, including bax, bik, and hrk, each of which is inhibited when bound to the anti-apoptotic members bcl-2 or bcl-xL (Lutz 2000). The enrichment of pro-apoptotic bcl-2 family members may render late OPCs sensitive to the mitochondrial pathway of apoptosis. Indeed, activation of glutamate receptors, Fas and TNF pathways in oligodendrocyte lineage cells lead to the release of cytochrome c, indicating that the mitochondrial pathway of apoptosis is very active in these cells (Szaflarski et al. 1995, Oka et al. 1993). In our recent studies to understand the signaling pathways that mediate glutamate-induced death of OPCs, we found that glutamate stimulates the translocation of both Bax and Bid from the cytoplasm to mitochondria, while Bcl-xL dissociates from both Bax and Bid and moves from the mitochondria to the cytoplasm (Simonishvili et al. 2013). TNFα also is a well-known mediator of OPC cell death (Scurlock & Dawson 1999, Ladiwala et al. 1999, D’Souza et al. 1996). Thus, the high levels of TNF-related proteins in late OPCs, make these cells exquisitely sensitive for TNFα-mediated injury following neonatal brain injury.
Late OPCs are also enriched in TNFR1, lymphotoxin-α (LTα) and caspase 8. LTα is a soluble ligand for the death receptor TNFR1. Additionally, we found that TNF-receptor associated apoptosis inducing ligand (TRAIL) is highly expressed in late OPCs. TRAIL is a ligand for death receptors 4 and 5 (DR4, DR5), which have high homology to TNFR1. Once activated, these receptors also activate caspase 8 through death domain interactions. A recent report found that both TRAIL and DR5 were increased after neonatal H-I (Huang et al. 2011). By contrast, although the TRAIL receptor 2 is highly expressed on human fetal NPs, cell death induced by TRAIL is minimal, coinciding with low levels of Caspase-8 (Peng et al. 2005). Our results are also in concordance with two previous studies that showed that Fas stimulates the proliferation and not the death of NPs (Tamm et al. 2004, Sleeper et al. 2002).
Altogether, these studies provide new insights into the vulnerability of OPCs to cell death and they provide insights into the resistance of NPs to injury. Our studies also demonstrate that tripotential NPs can be enriched using a simple and inexpensive means that will facilitate cell replacement strategies using stem cells as well as other studies whose goal is to reveal the fundamental properties of neural stem cells.
Acknowledgments
This work was presented in part at the 2003 American Society for Neurochemistry meeting (Brazel & Levison 2003) and was supported by grants from the National Institute of Mental Health MH059950 and HD052064 and a grant from the Leducq Foundation awarded to SWL. The authors would like to thank Dr. Ammar A. Alaithan for assistance in quantitating the SOX-2/Nestin images. None of the authors have any potential conflicts of interest to report.
References Cited
- Beckervordersandforth R, Tripathi P, Ninkovic J, et al. In vivo fate mapping and expression analysis reveals molecular hallmarks of prospectively isolated adult neural stem cells. Cell stem cell. 2010;7:744–758. doi: 10.1016/j.stem.2010.11.017. [DOI] [PubMed] [Google Scholar]
- Bieberich E, MacKinnon S, Silva J, Noggle S, Condie BG. Regulation of cell death in mitotic neural progenitor cells by asymmetric distribution of prostate apoptosis response 4 (PAR-4) and simultaneous elevation of endogenous ceramide. J Cell Biol. 2003;162:469–479. doi: 10.1083/jcb.200212067. [DOI] [PMC free article] [PubMed] [Google Scholar]
- Brazel CY, Levison SW. Neural Stem/Progenitor Cells are Relatively Resistant to Apoptotic Stimuli. American Society for Neurochemistry. 2003;85:1. Journal of Neurochemistry. [Google Scholar]
- Brazel CY, Nunez JL, Yang Z, Levison SW. Glutamate enhances survival and proliferation of neural progenitors derived from the subventricular zone. Neuroscience. 2005;131:55–65. doi: 10.1016/j.neuroscience.2004.10.038. [DOI] [PubMed] [Google Scholar]
- Brogi A, Strazza M, Melli M, Costantino-Ceccarini E. Induction of intracellular ceramide by interleukin-1 beta in oligodendrocytes. J Cell Biochem. 1997;66:532–541. doi: 10.1002/(sici)1097-4644(19970915)66:4<532::aid-jcb12>3.0.co;2-d. [DOI] [PubMed] [Google Scholar]
- Buono KD, Vadlamuri D, Gan Q, Levison SW. Leukemia inhibitory factor is essential for subventricular zone neural stem cell and progenitor homeostasis as revealed by a novel flow cytometric analysis. Dev Neurosci. 2012;34:449–462. doi: 10.1159/000345155. [DOI] [PMC free article] [PubMed] [Google Scholar]
- Capela A, Temple S. LeX/ssea-1 is expressed by adult mouse CNS stem cells, identifying them as nonependymal. Neuron. 2002;35:865–875. doi: 10.1016/s0896-6273(02)00835-8. [DOI] [PubMed] [Google Scholar]
- Crowder RJ, Freeman RS. Phosphatidylinositol 3-kinase and Akt protein kinase are necessary and sufficient for the survival of nerve growth factor-dependent sympathetic neurons. J Neurosci. 1998;18:2933–2943. doi: 10.1523/JNEUROSCI.18-08-02933.1998. [DOI] [PMC free article] [PubMed] [Google Scholar]
- D’Souza SD, Alinauskas KA, Antel JP. Ciliary neurotrophic factor selectively protects human oligodendrocytes from tumor necrosis factor-mediated injury. J Neurosci Res. 1996;43:289–298. doi: 10.1002/(SICI)1097-4547(19960201)43:3<289::AID-JNR4>3.0.CO;2-F. [DOI] [PubMed] [Google Scholar]
- Di Leonardo A, Linke SP, Clarkin K, Wahl GM. DNA damage triggers a prolonged p53-dependent G1 arrest and long-term induction of Cip1 in normal human fibroblasts. Genes Dev. 1994;8:2540–2551. doi: 10.1101/gad.8.21.2540. [DOI] [PubMed] [Google Scholar]
- Dudek H, Datta SR, Franke TF, Birnbaum MJ, Yao R, Cooper GM, Segal RA, Kaplan DR, Greenberg ME. Regulation of neuronal survival by the serine-threonine protein kinase Akt. Science. 1997;275:661–665. doi: 10.1126/science.275.5300.661. [DOI] [PubMed] [Google Scholar]
- Ebner S, Dunbar M, McKinnon RD. Distinct roles for PI3K in proliferation and survival of oligodendrocyte progenitor cells. J Neurosci Res. 2000;62:336–345. doi: 10.1002/1097-4547(20001101)62:3<336::AID-JNR3>3.0.CO;2-H. [DOI] [PubMed] [Google Scholar]
- Ellis P, Fagan BM, Magness ST, Hutton S, Taranova O, Hayashi S, McMahon A, Rao M, Pevny L. SOX2, a persistent marker for multipotential neural stem cells derived from embryonic stem cells, the embryo or the adult. Developmental Neuroscience. 2004;26:148–165. doi: 10.1159/000082134. [DOI] [PubMed] [Google Scholar]
- Felling RJ, Snyder MJ, Romanko MJ, Rothstein RP, Ziegler AN, Yang Z, Givogri MI, Bongarzone ER, Levison SW. Neural stem/progenitor cells participate in the regenerative response to perinatal hypoxia/ischemia. The Journal of neuroscience: the official journal of the Society for Neuroscience. 2006;26:4359–4369. doi: 10.1523/JNEUROSCI.1898-05.2006. [DOI] [PMC free article] [PubMed] [Google Scholar]
- Frederick TJ, Min J, Altieri SC, Mitchell NE, Wood TL. Synergistic induction of cyclin D1 in oligodendrocyte progenitor cells by IGF-I and FGF-2 requires differential stimulation of multiple signaling pathways. GLIA. 2007;55:1011–1022. doi: 10.1002/glia.20520. [DOI] [PubMed] [Google Scholar]
- Giaccia AJ, Kastan MB. The complexity of p53 modulation: emerging patterns from divergent signals. Genes Dev. 1998;12:2973–2983. doi: 10.1101/gad.12.19.2973. [DOI] [PubMed] [Google Scholar]
- Grinspan JB, Franceschini B. Platelet-derived growth factor is a survival factor for PSA-NCAM+ oligodendrocyte pre-progenitor cells. Journal of Neuroscience Research. 1995;41:540–551. doi: 10.1002/jnr.490410414. [DOI] [PubMed] [Google Scholar]
- Han BH, Holtzman DM. BDNF protects the neonatal brain from hypoxic-ischemic injury in vivo via the ERK pathway. J Neurosci. 2000;20:5775–5781. doi: 10.1523/JNEUROSCI.20-15-05775.2000. [DOI] [PMC free article] [PubMed] [Google Scholar]
- Hellstrom NA, Bjork-Eriksson T, Blomgren K, Kuhn HG. Differential recovery of neural stem cells in the subventricular zone and dentate gyrus after ionizing radiation. Stem Cells. 2009;27:634–641. doi: 10.1634/stemcells.2008-0732. [DOI] [PubMed] [Google Scholar]
- Hetman M, Kanning K, Cavanaugh JE, Xia Z. Neuroprotection by brain-derived neurotrophic factor is mediated by extracellular signal-regulated kinase and phosphatidylinositol 3-kinase. J Biol Chem. 1999;274:22569–22580. doi: 10.1074/jbc.274.32.22569. [DOI] [PubMed] [Google Scholar]
- Holinger EP, Chittenden T, Lutz RJ. Bak BH3 peptides antagonize Bcl-xL function and induce apoptosis through cytochrome c-independent activation of caspases. J Biol Chem. 1999;274:13298–13304. doi: 10.1074/jbc.274.19.13298. [DOI] [PubMed] [Google Scholar]
- Huang Z, Song L, Wang C, Liu JQ, Chen C. Hypoxia-Ischemia Upregulates TRAIL and TRAIL Receptors in the Immature Rat Brain. Developmental Neuroscience. 2011;33:519–530. doi: 10.1159/000334475. [DOI] [PubMed] [Google Scholar]
- Kastan MB, Onyekwere O, Sidransky D, Vogelstein B, Craig RW. Participation of p53 protein in the cellular response to DNA damage. Cancer Res. 1991;51:6304–6311. [PubMed] [Google Scholar]
- Kawaguchi A, Miyata T, Sawamoto K, et al. Nestin-EGFP transgenic mice: Visualization of the self-renewal and multipotency of CNS stem cells. Molecular and Cellular Neuroscience. 2001;17:259–273. doi: 10.1006/mcne.2000.0925. [DOI] [PubMed] [Google Scholar]
- Konishi H, Matsuzaki H, Tanaka M, Takemura Y, Kuroda S, Ono Y, Kikkawa U. Activation of protein kinase B (Akt/RAC-protein kinase) by cellular stress and its association with heat shock protein Hsp27. FEBS Lett. 1997;410:493–498. doi: 10.1016/s0014-5793(97)00541-3. [DOI] [PubMed] [Google Scholar]
- Ladiwala U, Li H, Antel JP, Nalbantoglu J. p53 induction by tumor necrosis factor-alpha and involvement of p53 in cell death of human oligodendrocytes. J Neurochem. 1999;73:605–611. doi: 10.1046/j.1471-4159.1999.0730605.x. [DOI] [PubMed] [Google Scholar]
- Le Belle JE, Orozco NM, Paucar AA, Saxe JP, Mottahedeh J, Pyle AD, Wu H, Kornblum HI. Proliferative neural stem cells have high endogenous ROS levels that regulate self-renewal and neurogenesis in a PI3K/Akt-dependant manner. Cell stem cell. 2011;8:59–71. doi: 10.1016/j.stem.2010.11.028. [DOI] [PMC free article] [PubMed] [Google Scholar]
- Levison S, McCarthy K. Astroglia in Culture. In: Banker G, Goslin K, editors. Culturing Nerve Cells. Vol. 1. MIT press; Cambridge: 1991. pp. 309–336. [Google Scholar]
- Levison SW, Romanko MJ, Rothstein RP, Snyder MJ. Hypoxia-Ischemia eliminates projenitors but not stem cells from the perinatal SVZ: consequences for brain development. Dev Neurosci. 2002;24:446–464. [Google Scholar]
- Linke SP, Clarkin KC, Wahl GM. p53 mediates permanent arrest over multiple cell cycles in response to gamma-irradiation. Cancer Res. 1997;57:1171–1179. [PubMed] [Google Scholar]
- Ljungman M. Dial 9-1-1 for p53: mechanisms of p53 activation by cellular stress. Neoplasia. 2000;2:208–225. doi: 10.1038/sj.neo.7900073. [DOI] [PMC free article] [PubMed] [Google Scholar]
- Lutz RJ. Role of the BH3 (Bcl-2 homology 3) domain in the regulation of apoptosis and Bcl-2-related proteins. Biochem Soc Trans. 2000;28:51–56. doi: 10.1042/bst0280051. [DOI] [PubMed] [Google Scholar]
- Maric D, Maric I, Chang YH, Barker JL. Prospective cell sorting of embryonic rat neural stem cells and neuronal and glial progenitors reveals selective effects of basic fibroblast growth factor and epidermal growth factor on self-renewal and differentiation. Journal of Neuroscience. 2003;23:240–251. doi: 10.1523/JNEUROSCI.23-01-00240.2003. [DOI] [PMC free article] [PubMed] [Google Scholar]
- Motoyama N, Wang F, Roth KA, et al. Massive cell death of immature hematopoietic cells and neurons in Bcl-x-deficient mice. Science. 1995;267:1506–1510. doi: 10.1126/science.7878471. [DOI] [PubMed] [Google Scholar]
- Moule SK, Welsh GI, Edgell NJ, Foulstone EJ, Proud CG, Denton RM. Regulation of protein kinase B and glycogen synthase kinase-3 by insulin and beta-adrenergic agonists in rat epididymal fat cells. Activation of protein kinase B by wortmannin-sensitive and -insensitive mechanisms. J Biol Chem. 1997;272:7713–7719. doi: 10.1074/jbc.272.12.7713. [DOI] [PubMed] [Google Scholar]
- Ness JK, Romanko MJ, Rothstein RP, Wood TL, Levison SW. Perinatal hypoxia-ischemia induces apoptotic and excitotoxic death of periventricular white matter oligodendrocyte progenitors. Developmental Neuroscience. 2001;23:203–208. doi: 10.1159/000046144. [DOI] [PubMed] [Google Scholar]
- Ness JK, Scaduto RC, Jr, Wood TL. IGF-I prevents glutamate-mediated bax translocation and cytochrome C release in O4+ oligodendrocyte progenitors. GLIA. 2004;46:183–194. doi: 10.1002/glia.10360. [DOI] [PubMed] [Google Scholar]
- Ness JK, Wood TL. Insulin-like growth factor I, but not neurotrophin-3, sustains Akt activation and provides long-term protection of immature oligodendrocytes from glutamate-mediated apoptosis. Molecular and Cellular Neuroscience. 2002;20:476–488. doi: 10.1006/mcne.2002.1149. [DOI] [PubMed] [Google Scholar]
- Oka A, Belliveau MJ, Rosenberg PA, Volpe JJ. Vulnerability of oligodendroglia to glutamate: pharmacology, mechanisms, and prevention. Journal of Neuroscience. 1993;13:1441–1453. doi: 10.1523/JNEUROSCI.13-04-01441.1993. [DOI] [PMC free article] [PubMed] [Google Scholar]
- Pastrana E, Cheng LC, Doetsch F. Simultaneous prospective purification of adult subventricular zone neural stem cells and their progeny. Proc Natl Acad Sci U S A. 2009;106:6387–6392. doi: 10.1073/pnas.0810407106. [DOI] [PMC free article] [PubMed] [Google Scholar]
- Pearce AK, Humphrey TC. Integrating stress-response and cell-cycle checkpoint pathways. Trends Cell Biol. 2001;11:426–433. doi: 10.1016/s0962-8924(01)02119-5. [DOI] [PubMed] [Google Scholar]
- Peng H, Huang Y, Duan Z, Erdmann N, Xu D, Herek S, Zheng J. Cellular IAP1 regulates TRAIL-induced apoptosis in human fetal cortical neural progenitor cells. Journal of Neuroscience Research. 2005;82:295–305. doi: 10.1002/jnr.20629. [DOI] [PubMed] [Google Scholar]
- Pettus BJ, Chalfant CE, Hannun YA. Ceramide in apoptosis: an overview and current perspectives. Biochim Biophys Acta. 2002;1585:114–125. doi: 10.1016/s1388-1981(02)00331-1. [DOI] [PubMed] [Google Scholar]
- Pong K, Doctrow SR, Huffman K, Adinolfi CA, Baudry M. Attenuation of staurosporine-induced apoptosis, oxidative stress, and mitochondrial dysfunction by synthetic superoxide dismutase and catalase mimetics, in cultured cortical neurons. Exp Neurol. 2001;171:84–97. doi: 10.1006/exnr.2001.7747. [DOI] [PubMed] [Google Scholar]
- Reed JC. Double identity for proteins of the Bcl-2 family. Nature. 1997;387:773–776. doi: 10.1038/42867. [DOI] [PubMed] [Google Scholar]
- Reynolds BA, Rietze RL. Neural stem cells and neurospheres--re-evaluating the relationship. Nat Methods. 2005;2:333–336. doi: 10.1038/nmeth758. [DOI] [PubMed] [Google Scholar]
- Rietze RL, Valcanis H, Brooker GF, Thomas T, Voss AK, Bartlett PF. Purification of a pluripotent neural stem cell from the adult mouse brain. Nature. 2001;412:736–739. doi: 10.1038/35089085. [DOI] [PubMed] [Google Scholar]
- Romanko MJ, Rothstein RP, Levison SW. Neural stem cells in the subventricular zone are resilient to hypoxia/ischemia whereas progenitors are vulnerable. J Cereb Blood Flow Metab. 2004;24:814–825. doi: 10.1097/01.WCB.0000123906.17746.00. [DOI] [PubMed] [Google Scholar]
- Romanko MJ, Zhu C, Bahr BA, Blomgren K, Levison SW. Death effector activation in the subventricular zone subsequent to perinatal hypoxia/ischemia. Journal of Neurochemistry. 2007;103:1121–1131. doi: 10.1111/j.1471-4159.2007.04820.x. [DOI] [PubMed] [Google Scholar]
- Rothstein RP, Levison SW. Damage to the Choroid Plexus, Ependyma and Subependyma as a Consequence of Perinatal Hypoxia/Ischemia. Developmental Neuroscience. 2002;24:426–436. doi: 10.1159/000069052. [DOI] [PubMed] [Google Scholar]
- Sable CL, Filippa N, Hemmings B, Van Obberghen E. cAMP stimulates protein kinase B in a Wortmannin-insensitive manner. FEBS Lett. 1997;409:253–257. doi: 10.1016/s0014-5793(97)00518-8. [DOI] [PubMed] [Google Scholar]
- Sawamoto K, Nakao N, Kakishita K, et al. Generation of dopaminergic neurons in the adult brain from mesencephalic precursor cells labeled with a nestin-GFP transgene. J Neurosci. 2001;21:3895–3903. doi: 10.1523/JNEUROSCI.21-11-03895.2001. [DOI] [PMC free article] [PubMed] [Google Scholar]
- Scurlock B, Dawson G. Differential responses of oligodendrocytes to tumor necrosis factor and other pro-apoptotic agents: role of ceramide in apoptosis. J Neurosci Res. 1999;55:514–522. doi: 10.1002/(SICI)1097-4547(19990215)55:4<514::AID-JNR11>3.0.CO;2-V. [DOI] [PubMed] [Google Scholar]
- Simonishvili S, Jain M, Li H, Levison SW, Wood TL. Mechanisms for Bax-Mediated Death of Oligodendrocyte Progenitors in Glutamate Excitotoxicity and after Perinatal Hypoxia-Ischemia. ASN NEURO. 2013 doi: 10.1042/AN20130027. In Press. [DOI] [PMC free article] [PubMed] [Google Scholar]
- Sleeper E, Tamm C, Frisen J, Zhivotovsky B, Orrenius S, Ceccatelli S. Cell death in adult neural stem cells. Cell Death Differ. 2002;9:1377–1378. doi: 10.1038/sj.cdd.4401127. [DOI] [PubMed] [Google Scholar]
- Szaflarski J, Burtrum D, Silverstein FS. Cerebral hypoxia-ischemia stimulates cytokine gene expression in perinatal rats. Stroke. 1995;26:1093–1100. doi: 10.1161/01.str.26.6.1093. [DOI] [PubMed] [Google Scholar]
- Tamm C, Robertson JD, Sleeper E, Enoksson M, Emgard M, Orrenius S, Ceccatelli S. Differential regulation of the mitochondrial and death receptor pathways in neural stem cells. The European journal of neuroscience. 2004;19:2613–2621. doi: 10.1111/j.0953-816X.2004.03391.x. [DOI] [PubMed] [Google Scholar]
- Taylor WR, Stark GR. Regulation of the G2/M transition by p53. Oncogene. 2001;20:1803–1815. doi: 10.1038/sj.onc.1204252. [DOI] [PubMed] [Google Scholar]
- Uchida N, Buck DW, He D, Reitsma MJ, Masek M, Phan TV, Tsukamoto AS, Gage FH, Weissman IL. Direct isolation of human central nervous system stem cells. Proc Natl Acad Sci U S A. 2000;97:14720–14725. doi: 10.1073/pnas.97.26.14720. [DOI] [PMC free article] [PubMed] [Google Scholar]
- Vemuri GS, McMorris FA. Oligodendrocytes and their precursors require phosphatidylinositol 3-kinase signaling for survival. Development. 1996;122:2529–2537. doi: 10.1242/dev.122.8.2529. [DOI] [PubMed] [Google Scholar]
- Yang H, Mujtaba T, Venkatraman G, Wu YY, Rao MS, Luskin MB. Region-specific differentiation of neural tube-derived neuronal restricted progenitor cells after heterotopic transplantation. Proceedings of the National Academy of Sciences of the United States of America. 2000;97:13366–13371. doi: 10.1073/pnas.97.24.13366. [DOI] [PMC free article] [PubMed] [Google Scholar]
- Yim SH, Hammer JA, Quarles RH. Differences in signal transduction pathways by which platelet-derived and fibroblast growth factors activate extracellular signal-regulated kinase in differentiating oligodendrocytes. J Neurochem. 2001;76:1925–1934. doi: 10.1046/j.1471-4159.2001.00199.x. [DOI] [PubMed] [Google Scholar]
- Young GM, Levison SW. An improved method for propagating oligodendrocyte progenitors in vitro. J Neurosci Methods. 1997;77:163–168. doi: 10.1016/s0165-0270(97)00123-4. [DOI] [PubMed] [Google Scholar]
- Zhou BB, Elledge SJ. The DNA damage response: putting checkpoints in perspective. Nature. 2000;408:433–439. doi: 10.1038/35044005. [DOI] [PubMed] [Google Scholar]