

Abstract
Objective
Hepatic lipotoxicity is characterized by reactive oxygen species (ROS) accumulation, mitochondrial dysfunction, and excessive apoptosis, but the precise sequence of biochemical events leading to oxidative damage and cell death remain unclear. The goal of this study was to delineate the role of mitochondrial metabolism in mediating hepatocyte lipotoxicity.
Materials/Methods
We treated H4IIEC3 rat hepatoma cells with free fatty acids in combination with antioxidants and mitochondrial inhibitors designed to block key events in the progression toward apoptosis. We then applied 13C metabolic flux analysis (MFA) to quantify mitochondrial pathway alterations associated with these treatments.
Results
Treatment with palmitate alone led to a doubling in oxygen uptake rate and in most mitochondrial fluxes. Supplementing culture media with the antioxidant N-acetyl-cysteine (NAC) reduced ROS accumulation and caspase activation and partially restored cell viability. However, 13C MFA revealed that treatment with NAC did not normalize palmitate-induced metabolic alterations, indicating that neither elevated ROS nor downstream apoptotic events contributed to mitochondrial activation. To directly limit mitochondrial metabolism, the complex I inhibitor phenformin was added to cells treated with palmitate. Phenformin addition eliminated abnormal ROS accumulation, prevented the appearance of apoptotic markers, and normalized mitochondrial carbon flow. Further studies revealed that glutamine provided the primary fuel for elevated mitochondrial metabolism in the presence of palmitate, rather than fatty acid beta-oxidation, and that glutamine consumption could be reduced through co-treatment with phenformin but not NAC.
Conclusion
Our results indicate that ROS accumulation in palmitate-treated H4IIEC3 cells occurs downstream of altered mitochondrial oxidative metabolism, which is independent of beta-oxidation and precedes apoptosis initiation.
Keywords: Lipotoxicity, metabolic flux analysis, isotopomer modeling, mass spectrometry, reactive oxygen species, nonalcoholic fatty liver disease, antioxidant treatment
Introduction
There are currently two competing views on the role of lipid beta-oxidation in the development of non-alcoholic fatty liver disease (NAFLD) [1,2]. One view holds that impaired or incomplete beta-oxidation leads to hepatic steatosis and accumulation of lipid intermediates that inhibit insulin signaling [3,4]. The other view holds that increased supply of free fatty acids (FFAs) to liver results in excessive beta-oxidation that fuels reactive oxygen species (ROS) accumulation and inflammation [5–7]. Recently, isotope tracers and nuclear magnetic resonance (NMR) were applied to determine in vivo metabolic fluxes in human subjects with either high or low intrahepatic triglyceride content [2]. It was found that citric acid cycle (CAC) flux was approximately 2-fold greater in NAFLD patients. This increase in mitochondrial activity was associated with a 50% higher rate of systemic lipolysis and a 50% higher rate of hepatic anaplerotic flux, demonstrating that elevated lipid levels strongly impact mitochondrial function in NAFLD patients. Similar metabolic alterations were measured in high-fat diet (HFD) fed mice, which were associated with elevated oxidative stress markers [1]. The authors hypothesized that citric acid cycle (CAC) activation is required to meet energetic demands in the face of reduced respiratory efficiency resulting from mitochondrial oxidative damage. In this contribution, we explore an alternative hypothesis, which is the possibility that FFAs can enhance mitochondrial metabolism independently of beta-oxidation through a mechanism that precedes the onset of oxidative damage.
Our study builds upon an extensive literature that uses hepatic cell lines to mimic the effects of obesity, NAFLD, and non-alcoholic steatohepatitis (NASH) in culture [8–12]. Studying the effects of lipid oversupply in cultured cells is useful because it enables complete control of the cellular environment to examine basic biochemical mechanisms of hepatic lipotoxicity. In this context, saturated fatty acid (SFA) treatments lead to acute lipotoxicity that is associated with increased ROS and endoplasmic reticulum (ER) stress but is independent of ceramide synthesis [9,13,14]. Furthermore, the response to SFA treatment is altogether different from that of monounsaturated fatty acid (MUFA) treatment, which induces steatotic triglyceride formation without initiating ROS accumulation or apoptosis [15]. Therefore, modulating the FFA composition of the culture medium can be used to achieve varied outcomes ranging from progressive lipotoxicity to benign steatosis.
Prior in vitro experiments have attributed the onset of SFA-induced oxidative stress to activation of NADPH oxidases [16] or increased fatty acid beta-oxidation [8]. In the mitochondria, loss of electrons from complexes I and III of the electron transport chain (ETC) can combine with oxygen to generate ROS, which include superoxide ions, hydroxyl radicals, and hydrogen peroxide [17]. ROS are powerful oxidizing agents that indiscriminately damage many important components of the cell including DNA, lipid membranes, and proteins [18]. At high levels, ROS are known to activate pro-apoptotic pathways, thus initiating programmed cell death. ROS accumulation can trigger apoptosis through c-Jun N-terminal kinase (JNK) stress signaling pathways [19]. Antioxidant co-treatments have been shown to prevent JNK phosphorylation and JNK-mediated insulin resistance in SFA-treated H4IIEC3 cells [8]. Co-treatment with a radical scavenger also prevented HepG2 human hepatoma cell death in the presence of elevated palmitate [20]. These prior studies indicate that ROS accumulation is potentially a committed step in the lipotoxicity mechanism, and that JNK activation may be one mechanism by which ROS accumulation initiates apoptosis [8,10]. However, the role of specific metabolic pathways in promoting ROS accumulation, as well as the mechanism of their dysregulation by palmitate, remains largely undefined.
Stable isotope-based metabolic flux analysis (MFA) has been previously applied to study how elevated SFAs impact central metabolism in hepatic cells [9]. Detailed flux mapping with [U-13C5]glutamine revealed that palmitate treatment strongly increased CAC fluxes relative to glycolytic fluxes in H4IIEC3 cells. Changes in intracellular metabolic fluxes coincided with the onset of ROS accumulation and preceded the appearance of apoptotic markers such as caspase 3/7 activation and DNA laddering. The same study showed that oleate co-treatment led to a reversal of the palmitate-induced metabolic phenotype and completely rescued H4IIEC3 cells from apoptosis, which was likely a result of enhanced partitioning of palmitate into triglyceride stores. Together with the previously described human and mouse data, these studies suggest that mitochondrial dysregulation arising from increased FFA availability plays a key role in both in vitro and in vivo lipotoxicity mechanisms, but they do not directly assess whether enhanced mitochondrial metabolism is a cause or a consequence of other lipotoxic effects such as oxidative stress or apoptosis initiation. Furthermore, they do not conclusively define whether FFAs are acting primarily as a fuel substrate to activate CAC flux.
To address these questions, we applied 13C MFA in combination with treatments designed to alter ROS accumulation and mitochondrial metabolism in H4IIEC3 rat hepatoma cells fed lipotoxic concentrations of the SFA palmitate. These studies revealed that palmitate increased oxygen consumption and CAC fluxes independently of fatty acid beta-oxidation. Glutamine, rather than lipid, was the preferred substrate used to fuel palmitate-induced increases in mitochondrial metabolism. Co-treating cells with the antioxidant N-acetyl cysteine (NAC) prevented ROS accumulation and caspase activation in the presence of palmitate but did not reverse the palmitate-associated metabolic phenotype. On the other hand, direct inhibition of mitochondrial metabolism with the complex I antagonist phenformin abolished palmitate-associated flux alterations while reversing other lipotoxicity markers. The results indicate that palmitate-induced dysregulation of mitochondrial oxidative metabolism is the primary cause of ROS accumulation and apoptosis in H4IIEC3 cells. Interestingly, these metabolic alterations are independent of fatty acid beta-oxidation and precede the onset of oxidative damage or apoptosis initiation.
Materials and Methods
Materials
Palmitate, oleate, bovine serum albumin, phenformin, N-acetyl cysteine, low glucose Dulbecco’s modified Eagle’s medium (DMEM), and etomoxir were purchased from Sigma (St. Louis, MO, USA). AICAR was purchased from Cayman Chemicals (Ann Arbor, MI, USA). Propidium iodide (PI) and 2′,7′-dichlorodihydrofluorescein diacetate (H2DCFDA) were purchased from Invitrogen (Carlsbad, CA, USA).
Cell culture
The H4IIEC3 rat hepatoma cell line (American Type Culture Collection, Manassas, VA, USA) was cultured in low glucose DMEM supplemented with 10% FBS and 1% penicillin/streptomycin antibiotic solution. The glutamine concentration of the culture medium was 2 mM. For fluorescence-based assays, cells were seeded in 96-well plates at 2 × 10⁴ cells per well two days prior to experiments to achieve 80–90% confluency at the time of measurement.
Preparation of fatty acid solutions
FFA stock solutions were prepared by coupling free fatty acids with bovine serum albumin (BSA). First, palmitate or oleate was dissolved in pure ethanol at a concentration of 195 mM so that the final concentration of ethanol in our FFA stock solutions did not exceed 1.5% by volume. This FFA stock solution was then added to a prewarmed 10% w/w BSA solution (37°C) to achieve a final FFA concentration of 3 mM, and this solution was allowed to incubate in a water bath for an additional 10 minutes. The final ratio of FFA to BSA was 2:1. All vehicle treatments were prepared using stocks of 10% w/w BSA with an equivalent volume of ethanol added to match the concentration in FFA stocks. The final concentration of ethanol in all experimental treatments was less than 0.2% by volume.
Detection of ROS
The radical-sensitive H2DCFDA dye was used to monitor intracellular ROS production. Cells were seeded on 96-well plates at 2 × 10⁴ cells per well. After treatment with fatty acids and/or inhibitors, cells were washed twice with Hank’s Balanced Saline Solution (HBSS) and then incubated with 10 μM H2DCFDA for one hour at 37°C in the dark. Oxidation of the dye by intracellular ROS generates a fluorescent 2,7-dicholorofluorescein (DCF) signal. Fluorescence was measured using the excitation/emission wavelengths 485/530 nm with a Biotek FL600 microplate reader.
Viability/Toxicity assays
Cell viability was measured using the Promega Cell Titer Blue kit at 24 hours (Fitchburg, WI, USA). Cells were washed twice with HBSS and incubated with dye for 4 hours at 37°C. The kit measures viability by quantifying resazurin reduction, which indicates metabolic production of reducing equivalents. Fluorescence was measured using the excitation/emission wavelengths 530/590 nm with a Biotek FL600 microplate reader. Additionally, we assessed cell toxicity using the dead-cell stain propidium iodide (PI). PI is an intercalating dye that becomes highly fluorescent with excitation wavelength of 530 nm and emission wavelength of 645 nm when embedded in the exposed double-stranded DNA of dead cells.
Caspase activity
The Apo-ONE Homogenous Caspase 3/7 Assay kit was used to measure the activities of caspases 3 and 7 as markers of apoptosis. H4IIEC3 hepatoma cells were cultured in 96-well plates as described previously. Cells were then incubated with designated treatments for at least 6 hours. The Apo-ONE kit uses a lysis buffer combined with a caspase 3/7 specific substrate. This substrate, Z-DEVD-R110, becomes fluorescent once its DEVD peptide is removed by the caspases. Fluorescence is then measured at an excitation wavelength of 485 nm and emission wavelength at 530 nm. Caspase 3/7 activation is known to be a reliable indicator of apoptosis initiation in palmitate-treated H4IIEC3 cells, as shown in several previous reports using the Apo-ONE assay in combination with additional apoptosis markers such as DNA laddering or cytochrome C release [9,21].
Metabolite extraction and GC-MS analysis of 13C labeling
The extraction of intracellular metabolites from H4IIEC3 rat hepatomas and GC-MS analysis of 13C labeling from [U-13C5]glutamine or [U-13C16]palmitate was performed as described previously [9]. Briefly, cell metabolism was quenched by adding 1 mL of pre-cooled methanol (−80°C) to cultured cells in 10-cm dishes. A biphasic extraction was used to separate polar metabolites into a methanol/water phase and non-polar metabolites into a chloroform phase. Note that this extraction results in mixing of free metabolites from separate subcellular compartments. Polar metabolites were converted to their tert-butylsilyl derivatives using MBTSTFA + 1% TBDMCS (Pierce). Then, 1 μL of each derivitized sample was injected into an Agilent 6890N/5975B GC-MS equipped with a 30m DB-35ms capillary column for analysis of isotopic enrichment.
Oxygen consumption
Oxygen uptake flux was used as a direct measurement of mitochondrial metabolism. These experiments were performed using the Oroboros Oxygraph-2K, which contains two chambers with separate oxygen probes to monitor on-line changes in oxygen concentration. The instrument was set to a temperature of 32°C, and the stirring speed for each chamber was 750 rpm. To perform these experiments, H4IIEC3 cells were cultured on 10-cm dishes until 80–90% confluent and subsequently incubated with selected combinations of fatty acids and treatments for 3 hours. Cells were then trypsinized, counted, and resuspended in the same culture medium at a concentration of 2 million cells per mL. Following resuspension, 2 million cells were injected into the Oxygraph instrument.
Beta-oxidation measurements
Cell cultures fed tritiated fatty acid produce 3H2O at a rate proportional to that of mitochondrial beta-oxidation. Albumin-bound [9,10-3H(N)] palmitic acid (4 μCi 3H/μmol palmitate) was added to cells grown to confluency in 6-well dishes at a final concentration of 400 μM. The final volume of the media solution, including culture medium with glucose and glutamine, inhibitors/activators, and palmitate, was calculated to be exactly 2 mL per well. After 6 hours of incubation, 1.5 mL of media was removed directly from each well and collected in individual round-bottom snap-top tubes. Then 75 μL of 60% perchloric acid was added to each sample for deproteinization and to remove albumin-bound unoxidized palmitate from the sample media. The deproteinization reaction was allowed to continue overnight at 4°C.
Following deproteinization, samples were centrifuged for 30 min. Then, 1.2 mL of sample was collected into a new centrifuge tube and 5 μL of pH indicator dye and 36 μL of 5M K2CO3 were added for neutralization. This reaction was allowed to continue overnight at 4°C. After neutralization, samples were centrifuged for 30 min. To remove any remaining palmitate, 0.8 mL of neutralized sample was applied to an individual AG 1-X8 Resin (BioRad, Hercules, CA) column, and the column was allowed to empty under gravity flow. Each column was flushed twice with 0.6 mL of distilled water. The initial charge (0.8 mL) and all subsequent washes (1.2 mL) were collected in a scintillation vial (PerkinElmer, Waltham, MA). 10 mL of EcoLite scintillation cocktail fluid (MP Biomedical, Santa Ana, CA) was added to each sample vial, shaken vigorously, and read in a scintillation counter.
Metabolic flux analysis
Feeding cells [U-13C5]glutamine isotope tracer results in unique isotopic enrichment patterns in downstream metabolites dependent on the intracellular metabolism [22]. It is therefore possible to evaluate the intracellular fluxes that give rise to the measured enrichment patterns by minimizing the lack of fit between measured and simulated mass isotopomer distributions derived from a mathematical model of the metabolic reaction network. We performed 13C MFA on H4IIEC3 rat hepatomas under several treatment conditions in the presence of glucose using custom Matlab-based software that relies on an elementary metabolite unit (EMU) decomposition to efficiently simulate mass isotopomer distributions of intracellular metabolites [23,24]. We constructed an isotopomer model to simulate labeling from [U-13C5]glutamine into glutamate, pyruvate, lactate, and several CAC intermediates, which was qualitatively similar to a previous model developed by Noguchi et al. [9]. The flux parameters of the model were iteratively adjusted using a Levenberg-Marquardt algorithm until optimal agreement with experimental data was obtained. Flux estimation was repeated a minimum of 50 times from random initial values to ensure a global minimum was achieved. All results were subjected to a chi-square statistical test to assess goodness-of-fit (χ = 0.01), and accurate 95% confidence intervals were computed for all estimated parameters by evaluating the sensitivity of the sum-of-squared residuals to parameter variations [25]. A detailed description of the reaction network and modeling assumptions can be found in the Supplementary Materials.
Statistical Analysis
Tests for statistical significance were performed using analysis of variance (Model I ANOVA) and Tukey-Kramer methods for multiple comparisons, or Student’s t-test for pair-wise comparisons. Plots indicate +/− one standard error of the mean unless otherwise indicated.
Results
Palmitate overload promotes ROS accumulation and apoptosis
In this study, H4IIEC3 cells were incubated with 400 μM palmitate (PA) as a model of SFA-induced lipotoxicity, consistent with previous studies [9]. We have chosen to use the H4IIEC3 rat hepatoma cell line because it has been used in several hallmark papers on the subject of hepatic lipotoxicity and has been shown to accurately recapitulate the response of primary hepatocytes to an elevated PA load [8,9,11]. A dose of 400 μM PA was selected to maintain consistency with these prior studies. We confirmed this dose by subjecting H4IIEC3 cells to increasing concentrations of PA and found that 400uM palmitate provided the maximum lipotoxic effect while remaining in a physiologically relevant range (Supplementary Fig. S1). After 6 hours of treatment, PA-treated cells exhibited a significant increase in ROS accumulation as measured by DCF fluorescence (Fig 1A). Additionally, PA-treated cells were marked by elevated caspase 3/7 activity at 12 hours (Fig. 1B). After 24 hours of PA treatment, cell viability was reduced by approximately two-thirds in comparison to the vehicle-treated (BSA) control group (Fig. 1C). In contrast, cells treated with the same concentration of oleate (OA) did not exhibit markers of oxidative stress or apoptosis (Fig. 1A, B, C).
Figure 1. Palmitate–induced lipotoxicity is characterized by time-dependent increases in ROS accumulation, caspase activation, and losses in cell viability.

H4IIEC3 rat hepatoma cells were incubated with 400 μM palmitate (PA), 400 μM oleate (OA), or 800 μM BSA (vehicle) for the indicated time periods. (A) Normalized ROS accumulation at 6-hour time point measured by DCF fluorescence. (B) Caspase 3/7 activity at 12-hour time point. (C) 24-hour cell viability (resazurin reduction) after incubation with indicated treatments. Positive control cells (+CTRL) were treated with 70% ethanol for 30 minutes. Data represent mean +/− S.E., n=4 for fluorescence assays; *, different from vehicle, p <.05; †, different from each other, p < .05.
Palmitate stimulates mitochondrial oxidative metabolism
ROS can be produced due to accelerated flux of electrons through the ETC as a result of increased mitochondrial activity. We measured the oxygen consumption of H4IIEC3 cells treated with 400 μMPA to determine if ROS accumulation was associated with elevated mitochondrial metabolism. PA-treated cells were characterized by increased oxygen consumption (Fig. 2). Cells treated with 400 μMOA had similar oxygen consumption rates as vehicle-treated cells. This result confirms that the elevated oxidative phenotype is unique to cells treated with SFA and that an equal load of MUFA is not sufficient to alter mitochondrial function.
Figure 2. Palmitate stimulates oxidative metabolism while oleate does not.
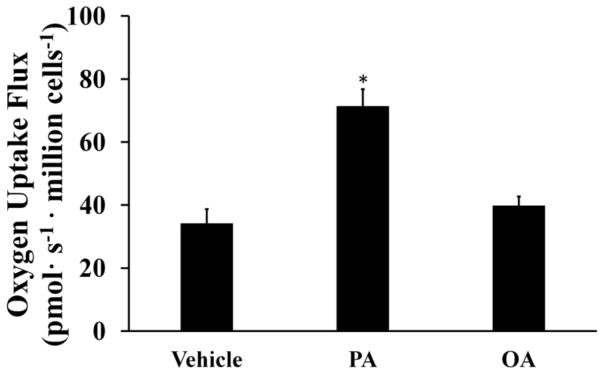
Oxygen consumption measurements were performed on cells treated with vehicle, 400 μM palmitate (PA), and 400 μM oleate (OA) for three hours. Data represent mean +/− S.E., n=3; *different from vehicle, p < .05.
Antioxidants restore viability by reducing palmitate-induced ROS accumulation without altering mitochondrial metabolism
Enhanced ROS accumulation has been proposed as playing a causative role in a variety of lipotoxic disorders. To determine if increased ROS levels were directly responsible for reducing cell viability in our system, H4IIEC3 cells were co-incubated with 400 μM PA and 5 mM of the antioxidant N-acetyl cysteine (NAC). NAC co-treatment reduced ROS at 6 hours (Fig. 3A), prevented markers of apoptosis at 12 hours (Fig. 3B), and resulted in a proportional rescue in cell viability at 24 hours (Fig. 3C). The antioxidant vitamin E produced similar reductions in lipotoxicity (Supplementary Fig. S2). The similar effects of both NAC and vitamin E, despite different mechanisms of ROS scavenging, suggest that NAC acts primarily through its antioxidant function to reduce lipotoxicity. Interestingly, NAC and PA co-treated H4IIEC3 cells had a similar oxygen uptake rate as cells treated with PA alone (Fig. 3D). This result indicates that palmitate-induced activation of mitochondrial metabolism is independent of ROS accumulation and apoptosis initiation.
Figure 3. Antioxidant treatment reduces intracellular ROS and partially rescues lipotoxic cell death without reversing palmitate-induced activation of oxidative metabolism.

The antioxidant N-acetyl cysteine (NAC) was added at a concentration of 5 mM to palmitate-treated (PA, 400 μM) or BSA-treated (vehicle, 800 μM) H4IIEC3 cells. (A) 6-hour ROS accumulation measured by DCF fluorescence. (B) Caspase 3/7 activity at 12-hour time point. (C) 24-hour cell viability assessed by resazurin reduction. Positive control cells (+CTRL) were treated with 70% ethanol for 30 minutes. (D) Oxygen uptake measurements of NAC- and/or PA-treated cells. Data represent mean +/− S.E., n=4 for all fluorescent assays, n=3 for oxygen uptake measurements; * different from vehicle, p <.05; † different from each other, p <.05.
Direct inhibition of mitochondrial oxidative metabolism suppresses palmitate-induced ROS generation and apoptosis
In a converse experiment, we sought to test whether a direct inhibitor of mitochondrial metabolism could effectively prevent the ability of palmitate to promote ROS accumulation and induce apoptosis. We applied 100 μM phenformin, a mitochondrial complex I antagonist, to H4IIEC3 cells both in the presence and absence of PA. Phenformin reduced PA-induced ROS generation at 6 hours (Fig. 4A), caspase activation at 12 hours (Fig. 4B), and long-term cell toxicity at 24 hours (Fig. 4C) compared to cells treated with PA alone. (In these experiments, we measured PI fluorescence as an indicator of cell toxicity since mitochondrial inhibitors such as phenformin could interfere with accurate assessment of cell viability using resazurin-based dyes.) Experiments using the classical complex I inhibitor rotenone produced similar reductions in ROS accumulation and apoptosis in the presence of 400 μM PA, thus confirming our ability to rescue palmitate-induced apoptosis by inhibiting mitochondrial electron transport (Supplementary Fig. S3). To confirm that phenformin suppressed mitochondrial metabolism at the administered dose, we measured oxygen uptake by cells co-treated with PA and phenformin (Fig. 4D). The measurements confirmed that phenformin fully normalized oxygen uptake in the presence of palmitate, recapitulating the metabolic phenotype observed in vehicle-treated control cells.
Figure 4. Phenformin abolishes palmitate-induced ROS generation, mitochondrial activation, and apoptosis.

H4IIEC3 cells were co-treated with 100 μM phenformin (PHEN) and either 400 μM palmitate (PA) or 800 μM BSA (Vehicle) to examine the role of mitochondrial metabolism in ROS accumulation and apoptosis. (A) ROS levels at 6 hours as measured by DCF fluorescence. (B) Caspase 3/7 activity at 12 hours. (C) Cell toxicity at 24 hours assessed by PI fluorescence. Positive control cells (+CTRL) were treated with 70% ethanol for 30 minutes. (D) Oxygen uptake measurements of PHEN- and/or PA-treated cells. Data represent mean +/− S.E., n=4 for all fluorescent assays, n=3 for oxygen uptake measurements; * different from vehicle, p <.05; † different from each other, p <.05.
Palmitate-induced ROS accumulation is independent of beta-oxidation
There are differing reports on the role of beta-oxidation in promoting in vitro lipotoxicity of hepatic cells [8,26]. To determine whether the observed ROS accumulation was due to a direct enhancement of beta-oxidation by palmitate addition, H4IIEC3 cells were treated with 400 μM PA and 250 μM etomoxir. Etomoxir is a specific inhibitor of the rate-limiting carnitine palmitoyltransferase 1 (CPT-1) enzyme that is required to transport long-chain fatty acids across the mitochondrial membrane [27]. First, we confirmed that adding etomoxir to [9,10-3H(N)]palmitate-treated cells significantly attenuated beta-oxidation by measuring a decrease in 3H2O production (Fig. 5A). To further confirm that etomoxir was effective at the selected concentration, we used AICAR to induce beta-oxidation in the presence of exogenous palmitate [28]. The effects of AICAR on beta-oxidation were completely reversed by addition of 250 μM etomoxir, confirming that this dose was effective at blocking CPT-1 in H4IIEC3 cells. Next, we observed that co-treatment with PA and etomoxir resulted in no significant change in ROS production in comparison to treatment with PA alone despite the observed reduction in beta-oxidation (Fig. 5B). Blocking beta-oxidation with etomoxir also did not prevent the appearance of markers of apoptosis (Fig. 5C, D).
Figure 5. Beta-oxidation does not fuel palmitate-induced ROS accumulation.

The CPT-1 inhibitor etomoxir (Eto) was added at a concentration of 250 μM to palmitate-treated (PA, 400 μM) or BSA-treated (vehicle, 800 μM) H4IIEC3 cells. (A) Beta-oxidation of [9,10-3H(N)] palmitate assessed by 3H2O production. 500 μM AICAR was used as a positive control. (B) ROS levels at 6 hours measured by DCF fluorescence. (C) Caspase activity of cells treated with palmitate and etomoxir at 12 hours. (D) Cell toxicity at 24 hours assessed by PI fluorescence. Data represent mean +/− S.E., n=4for fluorescence assays,* different from palmitate in (A), vehicle in (B, C, D), p <.05.
To directly assess the contribution of palmitate toward supplying carbon for CAC intermediates, we treated H4IIEC3 rat hepatomas with [U-13C16]palmitate. Intracellular, non-protein-bound metabolites were extracted, derivatized, and analyzed by GC-MS to quantify 13C-enrichment. If carbon from 13C-labeled PA was fully oxidized in the CAC, it would enter the cycle initially as a fully labeled (M+2) acetyl-CoA. This acetyl-CoA would then give rise to M+2 labeled CAC intermediates such as citrate and malate. Therefore, we analyzed ion fragments of citrate and malate for enrichment of M+2 mass isotopomers (Fig. 6A). However, we found little to no incorporation of 13C, suggesting that a negligible flux of palmitate carbon was directed into the CAC for complete oxidation.
Figure 6. Isotopic enrichment of mitochondrial metabolites.

Mass isotopomer distributions were corrected for natural isotope abundance using the method of Fernandez et al. [38]. (A) M+2 mass isotopomer abundance resulting from incorporation of 13C into malate and citrate following 6 hours of incubation with 400 μM[U -13C16]palmitate. Fully oxidized palmitate gives rise to M+2 mass isotopomers as illustrated in the accompanying diagram. (B) Atom percent enrichment (APE) of cells incubated with [U-13C5]glutamine in combination with palmitate and phenformin or NAC co-treatments. APE was calculated using the formula , where N is the number of carbon atoms in the metabolite and Mi is the fractional abundance of the ith mass isotopomer. The diagram illustrates the patterns of isotope incorporation derived from labeled glutamine after one turn of the CAC. Data represent mean +/− S.E., n=3; * different from vehicle, p <.05.
Metabolic flux analysis identifies glutamine as a major fuel substrate for palmitate-induced mitochondrial activation
To identify sources of carbon flux into the CAC, we performed further isotope labeling studies by total replacement of medium glutamine with [U-13C5]glutamine. The average 13C-enrichment of a given metabolite therefore reflects the overall contribution of glutamine carbon to the metabolite pool relative to other unlabeled carbon sources (e.g., glucose or FFA). GC-MS analysis of 13C incorporation revealed that malate extracted from PA-treated cells approached 60% enrichment compared to approximately 30% enrichment in vehicle-treated cells (Fig. 6B). The addition of phenformin to PA-treated cells normalized the isotopic enrichment of malate to the level of control cells. On the other hand, NAC co-supplementation had only a minor effect on malate enrichment. Analysis of isotopic enrichment of glutamate revealed similar enrichment trends. Taken together, these data demonstrate that palmitate treatment is characterized by elevated glutamine consumption and increased entry of glutamine carbon into the CAC relative to other carbon sources. Similar to the oxygen uptake measurements reported in Figs. 3D and 4D, phenformin co-treatment was able to reverse PA-induced alterations to glutamine metabolism while NAC co-treatment was not.
Next, we applied 13C MFA to simultaneously calculate 12 mitochondrial fluxes and their associated 95% confidence intervals by combining mass spectrometric measurements of 13C labeling with the previously measured oxygen consumption rates (Fig. 7A). H4IIEC3 cells treated with PA alone exhibited higher glutamine consumption, higher malic enzyme flux, and higher citrate synthase flux relative to vehicle-treated cells. Phenformin co-treatment effectively reduced most mitochondrial fluxes, including glutamine uptake and ETC activity. Cells co-treated with NAC and PA exhibited no reduction in mitochondrial metabolic fluxes, suggesting that the palmitate-induced metabolic alterations were not a consequence of elevated ROS and apoptosis initiation but instead were the result of upstream events in the lipotoxicity cascade that enhanced mitochondrial metabolic pathways.
Figure 7. 13C flux analysis of mitochondrial metabolism.

Fluxes were calculated as described in the Methods section and further detailed in the Supplementary Materials. (A) Major CAC and anaplerotic fluxes of cells treated with BSA (Vehicle) or palmitate (PA) with and without NAC or phenformin (PHEN) co-treatments. Abbreviations: ADH, alpha-ketoglutarate dehydrogenase; CS, citrate synthase; GLN, glutamine uptake; ME, malic enzyme; PC, pyruvate carboxylase. (B) ‘Net glycolysis’ rate defined as the difference between glycolytic pyruvate production and lactate excretion. Error bars indicate 95% confidence intervals; * different from vehicle, p <.05.
Based on our 13C MFA calculations, we determined the difference between glycolytic pyruvate production and lactate excretion (Fig. 7B). We designate this difference as’net glycolysis’, since it represents the net amount of glycolytic carbon that enters the CAC for oxidation. If this value is positive, there is net contribution of glucose carbon to the mitochondrial metabolic pool. If negative, non-glucose carbon derived from the CAC is contributing to lactate production. For vehicle-treated cells, the net glycolytic rate was positive since more glucose carbon entered the pyruvate node than was excreted as lactate. Cells treated with PA, however, were characterized by a negative net glycolytic rate since glutamine entry to the CAC was elevated relative to glucose. Supplementing PA-treated cells with phenformin, but not NAC, effectively reversed this phenotype. Complete flux maps of all four treatments are shown in Figure 8.
Figure 8. Comparison of H4IIEC3 flux maps under various treatments examined in this study.

Arrows are weighted according to flux values shown (pmol/million cells/s). (A) Vehicle-treated cells, (B) palmitate (PA) treated cells, (C) palmitate and phenformin (PA + PHEN) co-treated cells, (D) palmitate and NAC (PA + NAC) co-treated cells. Abbreviations: AcCoA, acetyl-CoA; AKG, alpha-ketoglutarate; Cit, citrate; Fum, fumarate; Glc, glucose; Glu, glutamate; Gln, glutamine; Lac, lactate; Mal, malate; Net Glyc, net glycolysis; Pyr, pyruvate; Suc, succinate.
Discussion
Understanding the molecular factors that control hepatic lipotoxicity is a critical step toward developing improved strategies to prevent and treat NAFLD and NASH. A reported feature of palmitate-induced liptoxicity is increased oxidative stress due to intracellular ROS accumulation, which precedes the onset of apoptosis as indicated by DNA laddering, induction of caspases 3 and 7, and cytochrome C release [9,11,14,21,29]. However, the role of ROS in stimulating lipoapoptosis appears to be cell-type dependent. For example, ROS accumulation is a critical event leading to apoptosis of palmitate-treated CHO cells [30], while palmitate-treated neonatal cardiomyocytes undergo apoptosis independently of oxidative stress [31]. In our experiments, we measured a burst of ROS at approximately 6 hours following palmitate administration, which was 25–50% higher than cells treated with vehicle (BSA) alone. It has been shown previously in the H4IIEC3 cell line that similar increases in ROS can activate JNK stress pathways, which was sufficient to negatively affect insulin signaling [8]. We found that NACco -treatment effectively normalized PA-induced ROS accumulation, significantly reduced caspase activation, and improved long-term cell viability, indicating that apoptosis initiation is dependent on ROS accumulation in H4IIEC3 cells.
Healthy cells continually produce ROS during mitochondrial oxidative phosphorylation and rely on their enzymatic machinery to manage ROS levels, thereby preventing toxic side effects. Elevated ROS can therefore occur due to either increased oxidative metabolism or deficient antioxidant defenses. To quantify rates of mitochondrial metabolism in palmitate-treated H4IIEC3 cells, we applied 13C MFA based on [U-13C5]glutamine tracing combined with measurements of oxygen consumption flux. Since mitochondria require oxygen to carry out oxidative phosphorylation, increased oxygen consumption is a direct measure of increased mitochondrial metabolism. Palmitate-treated cells exhibited a 2-fold increase in oxygen consumption rate and in most mitochondrial fluxes prior to ROS accumulation. However, NAC co-treatment did not affect palmitate-induced metabolic alterations, indicating that neither elevated ROS nor downstream apoptotic events contributed to mitochondrial activation. Instead, elevated mitochondrial metabolism appears to be an inherent consequence of palmitate overload that is independent of subsequent ROS accumulation and apoptosis initiation.
Next, we sought to determine whether accelerated mitochondrial metabolism is required for palmitate-induced ROS accumulation and apoptosis, or whether these events are primarily attributable to other causes such as failure of antioxidant defenses or activation of NADPH oxidases. To address this question, we employed the complex I antagonist phenformin to directly inhibit mitochondrial metabolism. Phenformin is a lipophilic derivative of the type-2 diabetes drug metformin, which shares the same mechanism of action [32,33]. Phenformin co-treatment reduced both ROS accumulation and oxygen uptake in PA-treated H4IIEC3 cells and normalized mitochondrial metabolic fluxes to levels characteristic of vehicle-treated cells. Similar to NAC treatment, this reduction in mitochondria-derived ROS coincided with increased cell viability and decreased caspase activation. Therefore, elevated mitochondrial metabolism is required for ROS accumulation and caspase activation in our model of palmitate lipotoxicity.
Increased fatty acid beta-oxidation has been proposed as the primary fuel source responsible for lipotoxic ROS generation both in vivo [1,2] and in the H4IIEC3 cell line [8]. In our experiments with the same cell line, however, adding the CPT-1 inhibitor etomoxir to palmitate-treated H4IIEC3 cells had no effect on ROS accumulation or cell viability. These results reveal a novel facet of lipotoxicity in our system: mitochondria-derived ROS accumulation is independent of fatty acid beta-oxidation. We found little isotopic enrichment of CAC intermediates when H4IIEC3 cells were fed [U-13C16]palmitate, indicating that exogenous fatty acid was not being fully oxidized to CO2. To further investigate the fuel source driving palmitate-induced mitochondrial activation, we relied on 13C MFA to map the flow of carbon entering the CAC from the major non-lipid substrates glucose and glutamine. We found that glutamine provided the primary fuel for elevated mitochondrial metabolism in the presence of palmitate, rather than fatty acid beta-oxidation, and that glutamine consumption could be reduced through co-treatment with phenformin but not NAC. These results demonstrate that ROS accumulation is a direct consequence of mitochondrial activation and can be reversed by inhibiting oxidative phosphorylation, which concomitantly suppresses entry of glutamine carbon into the CAC.
Our 13C MFA results match well with previous in vivo 2H/13C NMR studies of NAFLD patients [2] and HFD fed mice [1], both of which reported an approximate 2-fold increase in CAC flux. This was associated with increased oxidative damage in livers of HFD fed mice [1]. The authors hypothesized that increased beta-oxidation was fueling the observed enhancement in CAC flux. However, our in vitro observations supply an alternative hypothesis, which is that oxidation of non-lipid substrates can also contribute substantially to elevated CAC flux in hepatic lipotoxicity. It should be noted, however, that the in vivo flux studies were performed under fasting (i.e., gluconeogenic) conditions, whereas the conditions of our study were representative of a fed (i.e., glycolytic) state. Therefore, it is difficult to make direct quantitative comparisons between our data and those obtained from the prior in vivo studies.
Our findings suggest several intriguing questions for further study into the causes and consequences of mitochondrial dysregulation under conditions of FFA lipotoxicity. First, if the exogenous palmitate load does not directly fuel elevated CAC flux, what other effects of palmitate overexposure might lead to activation of mitochondrial oxidative metabolism? One possible hypothesis is that disruption of normal lipid metabolic pathways may lead to (i) production of lipid-derived signaling molecules or (ii) alteration of intracellular membrane homeostasis that subsequently activates mitochondrial metabolism. This may also involve activation of signaling proteins such as peroxisome proliferator-activated receptors (PPARs) that respond directly to lipid intermediates and can regulate expression of mitochondrial proteins. Although our study provides a detailed picture of metabolic flux rewiring in response to FFA treatments, it does not address the upstream cell signaling and transcriptional regulatory mechanisms that may play a role in mediating the observed metabolic alterations. Second, can direct inhibition of glutamine anaplerosis reverse the lipotoxic metabolic phenotype or will hepatic cells shift to other available carbon sources to maintain elevated CAC flux? Further investigation of both the upstream and downstream molecular events that control palmitate-induced mitochondrial activation in hepatic cells is clearly an important next step.
In summary, we have applied oxygen uptake measurements and 13C MFA to elucidate a critical role for mitochondrial dysregulation in mediating palmitate liptoxicity of H4IIEC3 cells. We report that a) palmitate-induced metabolic dysregulation is independent of oxidative damage and apoptosis initiation, b) apoptosis is dependent on palmitate-induced metabolic alterations leading to elevated ROS accumulation, and c) glutamine, not fatty acid beta-oxidation, provides the carbon fuel for enhanced CAC flux in response to a palmitate load. Our model also highlights important differences between the protective effects of phenformin and NAC, both of which have direct in vivo relevance. Studies using non-diabetic methionine- and choline-deficient mouse models of NASH demonstrate that metformin has the potential to reduce inflammation after induction of liver injury [34]. Additionally, NAC supplementation of HFD fed Sprague-Dawley rats successfully prevented the appearance of many markers of elevated oxidative stress such as peroxidized lipid species [35]. However, this study reported that NAC did not reverse potential upstream activators of liver dysfunction such as steatosis and only partially restored glutathione levels. Clinically, the use of antioxidants as a treatment for NASH has met with varying degrees of success. For example, the antioxidant vitamin E has been explored as a potential therapy for persons with NASH. Treatment with vitamin E resulted in reduced liver injury in adults assessed by a reduction in serum alanine and aspartate aminotransferase levels but did not improve fibrosis [36]. Interestingly, vitamin E trials in children with NASH report no improvements in alanine aminotransferase levels as a primary marker of disease but had improved NASH scores [37]. These prior in vivo studies highlight how antioxidants can treat some but not all symptoms of NASH, suggesting they do not fully restore normal redox homeostasis or block other upstream or parallel disease pathways. Improved understanding of the molecular determinants of lipotoxicity is therefore likely to suggest novel nutritional and/or pharmacologic interventions to combat the effects of NAFLD and to prevent its progression toward NASH.
Supplementary Material
H4IIEC3 rat hepatic cells were treated with the indicated concentrations of palmitate for 24 hours and cell toxicity was measured by PI fluorescence. 400 μM palmitate doubled PI fluorescence after 24 hours. Data represent mean +/− S.E., n=8 for fluorescence assays; *, different from vehicle, p <.05.
(A) The antioxidant Vitamin E (Vit E, 1 mM) to palmitate-treated (PA, 400 μM) or BSA-treated (vehicle, 800 μM) H4IIEC3 cells and (A) Caspase 3/7 activity was measured after 12 hours. (B) 24-hour cell toxicity was measured by propidium iodide. Vitamin E co-treatment significantly blunts these markers of lipotoxicity. Data represent mean +/− S.E., n=8 for the toxicity assay; * different from vehicle, p <.05.
H4IIEC3 cells were co-treated with 100 nM rotenone (ROT) and either 400 μM palmitate (PA) or 800 μM BSA (vehicle) to examine the role of mitochondrial metabolism in ROS accumulation and apoptosis. Toxicity 24-hours post-treatment was assessed using propidium iodide. Data represent mean +/− S.E., n=4 for the toxicity assay; * different from vehicle, p <.05.
Acknowledgments
This research was supported by National Science Foundation (NSF) CAREER Award CBET-0955251 (to JDY) and the Vanderbilt Diabetes Research and Training Center (NIH DK020593). RAE was supported by the NSF Graduate Research Fellowship Program. We would like to thank Alyssa Hasty, Owen McGuinness, Richard O’Brien, and David Wasserman for critical readings of this manuscript prior to journal submission. Additionally, we would like to thank Wasserman lab members Ashley S. Williams and Louise Lantier for their technical assistance with obtaining oxygen uptake measurements using the Oroboros Oxygraph-2K instrument.
Abbreviations
- BSA
bovine serum albumin
- CAC
citric acid cycle
- ETOX
etomoxir
- FFA
free fatty acid
- GC -MS
gas chromatography-mass spectrometry
- H2DCFDA
2′-7′-dichlorodihydrofluorescein diacetate
- MFA
metabolic flux analysis
- MUFA
monounsaturated fatty acid
- NAC
n-acetyl cysteine
- NAFLD
non-alcoholic fatty liver disease
- NASH
non-alcoholic steatohepatitis
- OA
oleate
- PHEN
phenformin
- PA
palmitate
- PI
propidium iodide
- ROS
reactive oxygen species
- SFA
saturated fatty acid.
Metabolites and enzymes
- AcCoA
acetyl-CoA
- AKG
alpha-ketoglutarate
- Cit
citrate
- Fum
fumarate
- Glc
glucose
- Glu
glutamate
- Gln
glutamine
- Lac
lactate
- Mal
malate
- Net Glyc
net glycolysis
- Pyr
pyruvate
- Suc
succinate
- ADH
alpha-ketoglutarate dehydrogenase
- CS
citrate synthase
- GLN
glutamine uptake
- ME
malic enzyme
- PC
pyruvate carboxylase
Footnotes
There is no conflict of interest to report.
Author Contributions: R.A. Egnatchik performed and designed the experiments and wrote and edited the manuscript. A.K. Leamy performed the beta-oxidation measurements and edited the manuscript. Y. Noguchi edited the manuscript and aided in experimental design. M. Shiota helped design the beta-oxidation measurements and edited the manuscript. J.D. Young wrote and edited the manuscript and aided in experimental design.
Publisher's Disclaimer: This is a PDF file of an unedited manuscript that has been accepted for publication. As a service to our customers we are providing this early version of the manuscript. The manuscript will undergo copyediting, typesetting, and review of the resulting proof before it is published in its final citable form. Please note that during the production process errors may be discovered which could affect the content, and all legal disclaimers that apply to the journal pertain.
References
- 1.Satapati S, Sunny NE, Kucejova B, Fu X, He TT, et al. Elevated TCA cycle function in the pathology of diet-induced hepatic insulin resistance and fatty liver. J Lipid Res. 2012;53:1080–1092. doi: 10.1194/jlr.M023382. [DOI] [PMC free article] [PubMed] [Google Scholar]
- 2.Sunny NE, Parks EJ, Browning JD, Burgess SC. Excessive hepatic mitochondrial TCA cycle and gluconeogenesis in humans with nonalcoholic fatty liver disease. Cell Metab. 2011;14:804–810. doi: 10.1016/j.cmet.2011.11.004. [DOI] [PMC free article] [PubMed] [Google Scholar]
- 3.Samuel VT, Liu ZX, Qu X, Elder BD, Bilz S, et al. Mechanism of hepatic insulin resistance in non-alcoholic fatty liver disease. J Biol Chem. 2004;279:32345–32353. doi: 10.1074/jbc.M313478200. [DOI] [PubMed] [Google Scholar]
- 4.Savage DB, Petersen KF, Shulman GI. Disordered lipid metabolism and the pathogenesis of insulin resistance. Physiol Rev. 2007;87:507–520. doi: 10.1152/physrev.00024.2006. [DOI] [PMC free article] [PubMed] [Google Scholar]
- 5.Sanyal AJ, Campbell-Sargent C, Mirshahi F, Rizzo WB, Contos MJ, et al. Nonalcoholic steatohepatitis: association of insulin resistance and mitochondrial abnormalities. Gastroenterology. 2001;120:1183–1192. doi: 10.1053/gast.2001.23256. [DOI] [PubMed] [Google Scholar]
- 6.Serviddio G, Bellanti F, Tamborra R, Rollo T, Capitanio N, et al. Uncoupling protein-2 (UCP2) induces mitochondrial proton leak and increases susceptibility of non-alcoholic steatohepatitis (NASH) liver to ischaemia-reperfusion injury. Gut. 2008;57:957–965. doi: 10.1136/gut.2007.147496. [DOI] [PubMed] [Google Scholar]
- 7.Pessayre D, Fromenty B. NASH: a mitochondrial disease. J Hepatol. 2005;42:928–940. doi: 10.1016/j.jhep.2005.03.004. [DOI] [PubMed] [Google Scholar]
- 8.Nakamura S, Takamura T, Matsuzawa-Nagata N, Takayama H, Misu H, et al. Palmitate Induces Insulin Resistance in H4IIEC3 Hepatocytes through Reactive Oxygen Species Produced by Mitochondria. Journal of Biological Chemistry. 2009;284:14809–14818. doi: 10.1074/jbc.M901488200. [DOI] [PMC free article] [PubMed] [Google Scholar]
- 9.Noguchi Y, Young J, Aleman J, Hansen M, Kelleher J, et al. Effect of Anaplerotic Fluxes and Amino Acid Availability on Hepatic Lipoapoptosis. Journal of Biological Chemistry. 2009;284:33425–33436. doi: 10.1074/jbc.M109.049478. [DOI] [PMC free article] [PubMed] [Google Scholar]
- 10.Malhi H, Bronk SF, Werneburg NW, Gores GJ. Free fatty acids induce JNK-dependent hepatocyte lipoapoptosis. Journal of Biological Chemistry. 2006;281:12093–12101. doi: 10.1074/jbc.M510660200. [DOI] [PubMed] [Google Scholar]
- 11.Pfaffenbach K, Gentile C, Nivala A, Wang D, Wei Y, et al. Linking endoplasmic reticulum stress to cell death in hepatocytes: roles of C/EBP homologous protein and chemical chaperones in palmitate-mediated cell death. American Journal of Physiology-Endocrinology and Metabolism. 2010;298:E1027–E1035. doi: 10.1152/ajpendo.00642.2009. [DOI] [PMC free article] [PubMed] [Google Scholar]
- 12.Leamy AK, Egnatchik RA, Young JD. Molecular mechanisms and the role of saturated fatty acids in the progression of non-alcoholic fatty liver disease. Prog Lipid Res. 2013;52:165–174. doi: 10.1016/j.plipres.2012.10.004. [DOI] [PMC free article] [PubMed] [Google Scholar]
- 13.Listenberger L, Ory D, Schaffer J. Palmitate-induced apoptosis can occur through a ceramide-independent pathway. Journal of Biological Chemistry. 2001;276:14890–14895. doi: 10.1074/jbc.M010286200. [DOI] [PubMed] [Google Scholar]
- 14.Wei Y, Wang D, Topczewski F, Pagliassotti M. Saturated fatty acids induce endoplasmic reticulum stress and apoptosis independently of ceramide in liver cells. American Journal of Physiology-Endocrinology and Metabolism. 2006;291:E275–E281. doi: 10.1152/ajpendo.00644.2005. [DOI] [PubMed] [Google Scholar]
- 15.Listenberger L, Han X, Lewis S, Cases S, Farese R, et al. Triglyceride accumulation protects against fatty acid-induced lipotoxicity. Proceedings of the National Academy of Sciences of the United States of America. 2003;100:3077–3082. doi: 10.1073/pnas.0630588100. [DOI] [PMC free article] [PubMed] [Google Scholar]
- 16.Gao D, Nong S, Huang X, Lu Y, Zhao H, et al. The effects of palmitate on hepatic insulin resistance are mediated by NADPH Oxidase 3-derived reactive oxygen species through JNK and p38MAPK pathways. J Biol Chem. 2010;285:29965–29973. doi: 10.1074/jbc.M110.128694. [DOI] [PMC free article] [PubMed] [Google Scholar]
- 17.Adam-Vizi V, Chinopoulos C. Bioenergetics and the formation of mitochondrial reactive oxygen species. Trends in Pharmacological Sciences. 2006;27:639–645. doi: 10.1016/j.tips.2006.10.005. [DOI] [PubMed] [Google Scholar]
- 18.Brookes PS, Yoon YS, Robotham JL, Anders MW, Sheu SS. Calcium, ATP, and ROS: a mitochondrial love-hate triangle. American Journal of Physiology-Cell Physiology. 2004;287:C817–C833. doi: 10.1152/ajpcell.00139.2004. [DOI] [PubMed] [Google Scholar]
- 19.Kamata H, Honda S, Maeda S, Chang L, Hirata H, et al. Reactive oxygen species promote TNF alpha-induced death and sustained JNK activation by inhibiting MAP kinase phosphatases. Cell. 2005;120:649–661. doi: 10.1016/j.cell.2004.12.041. [DOI] [PubMed] [Google Scholar]
- 20.Srivastava S, Chan C. Hydrogen peroxide and hydroxyl radicals mediate palmitate-induced cytotoxicity to hepatoma cells: Relation to mitochondrial permeability transition. Free Radical Research. 2007;41:38–49. doi: 10.1080/10715760600943900. [DOI] [PubMed] [Google Scholar]
- 21.Wei Y, Wang D, Gentile C, Pagliassotti M. Reduced endoplasmic reticulum luminal calcium links saturated fatty acid-mediated endoplasmic reticulum stress and cell death in liver cells. Molecular and Cellular Biochemistry. 2009;331:31–40. doi: 10.1007/s11010-009-0142-1. [DOI] [PMC free article] [PubMed] [Google Scholar]
- 22.Wiechert W, Mollney M, Isermann N, Wurzel W, de Graaf A. Bidirectional reaction steps in metabolic networks: III. Explicit solution and analysis of isotopomer labeling systems. Biotechnology and Bioengineering. 1999;66:69–85. [PubMed] [Google Scholar]
- 23.Antoniewicz MR, Kelleher JK, Stephanopoulos G. Elementary metabolite units (EMU): A novel framework for modeling isotopic distributions. Metabolic Engineering. 2007;9:68–86. doi: 10.1016/j.ymben.2006.09.001. [DOI] [PMC free article] [PubMed] [Google Scholar]
- 24.Young J, Walther J, Antoniewicz M, Yon H, Stephanopoulos G. An Elementary Metabolite Unit (EMU) based method of isotopically nonstationary flux analysis. Biotechnology and Bioengineering. 2008;99:686–699. doi: 10.1002/bit.21632. [DOI] [PubMed] [Google Scholar]
- 25.Antoniewicz MR, Kelleher JK, Stephanopoulos G. Determination of confidence intervals of metabolic fluxes estimated from stable isotope measurements. Metab Eng. 2006;8:324–337. doi: 10.1016/j.ymben.2006.01.004. [DOI] [PubMed] [Google Scholar]
- 26.Srivastava S, Chan C. Application of metabolic flux analysis to identify the mechanisms of free fatty acid toxicity to human hepatoma cell line. Biotechnology and Bioengineering. 2008;99:399–410. doi: 10.1002/bit.21568. [DOI] [PMC free article] [PubMed] [Google Scholar]
- 27.Cook GA, Gamble MS. REGULATION OF CARNITINE PALMITOYLTRANSFERASE BY INSULIN RESULTS IN DECREASED ACTIVITY AND DECREASED APPARENT KI VALUES FOR MALONYL-COA. Journal of Biological Chemistry. 1987;262:2050–2055. [PubMed] [Google Scholar]
- 28.Kaushik VK, Young ME, Dean DJ, Kurowski TG, Saha AK, et al. Regulation of fatty acid oxidation and glucose metabolism in rat soleus muscle: effects of AICAR. American Journal of Physiology-Endocrinology and Metabolism. 2001;281:E335–E340. doi: 10.1152/ajpendo.2001.281.2.E335. [DOI] [PubMed] [Google Scholar]
- 29.Pagliassotti M, Wei Y, Wang D. Saturated fatty acids induce cytotoxicity in hepatocytes via effects on the endoplasmic reticulum. Obesity Research. 2005;13:A31–A31. [Google Scholar]
- 30.Borradaile NM, Han X, Harp JD, Gale SE, Ory DS, et al. Disruption of endoplasmic reticulum structure and integrity in lipotoxic cell death. Journal of Lipid Research. 2006;47:2726–2737. doi: 10.1194/jlr.M600299-JLR200. [DOI] [PubMed] [Google Scholar]
- 31.Hickson-Bick DLM, Sparagna GC, Buja LM, McMillin JB. Palmitate-induced apoptosis in neonatal cardiomyocytes is not dependent on the generation of ROS. American Journal of Physiology-Heart and Circulatory Physiology. 2002;282:H656–H664. doi: 10.1152/ajpheart.00726.2001. [DOI] [PubMed] [Google Scholar]
- 32.Hawley SA, Ross FA, Chevtzoff C, Green KA, Evans A, et al. Use of Cells Expressing gamma Subunit Variants to Identify Diverse Mechanisms of AMPK Activation. Cell Metabolism. 2010;11:554–565. doi: 10.1016/j.cmet.2010.04.001. [DOI] [PMC free article] [PubMed] [Google Scholar]
- 33.Owen MR, Doran E, Halestrap AP. Evidence that metformin exerts its anti-diabetic effects through inhibition of complex 1 of the mitochondrial respiratory chain. Biochemical Journal. 2000;348:607–614. [PMC free article] [PubMed] [Google Scholar]
- 34.Kita Y, Takamura T, Misu H, Ota T, Kurita S, et al. Metformin Prevents and Reverses Inflammation in a Non-Diabetic Mouse Model of Nonalcoholic Steatohepatitis. Plos One. 2012;7 doi: 10.1371/journal.pone.0043056. [DOI] [PMC free article] [PubMed] [Google Scholar]
- 35.Baumgardner JN, Shankar K, Hennings L, Albano E, Badger TM, et al. N-acetylcysteine attenuates progression of liver pathology in a rat model of nonalcoholic steatohepatitis. Journal of Nutrition. 2008;138:1872–1879. doi: 10.1093/jn/138.10.1872. [DOI] [PMC free article] [PubMed] [Google Scholar]
- 36.Sanyal AJ, Chalasani N, Kowdley KV, McCullough A, Diehl AM, et al. Pioglitazone, Vitamin E, or Placebo for Nonalcoholic Steatohepatitis. New England Journal of Medicine. 2010;362:1675–1685. doi: 10.1056/NEJMoa0907929. [DOI] [PMC free article] [PubMed] [Google Scholar]
- 37.Lavine JE, Schwimmer JB, Van Natta ML, Molleston JP, Murray KF, et al. Effect of Vitamin E or Metformin for Treatment of Nonalcoholic Fatty Liver Disease in Children and Adolescents The TONIC Randomized Controlled Trial. Jama-Journal of the American Medical Association. 2011;305:1659–1668. doi: 10.1001/jama.2011.520. [DOI] [PMC free article] [PubMed] [Google Scholar]
- 38.Fernandez CA, Des Rosiers C, Previs SF, David F, Brunengraber H. Correction of 13C mass isotopomer distributions for natural stable isotope abundance. J Mass Spectrom. 1996;31:255–262. doi: 10.1002/(SICI)1096-9888(199603)31:3<255::AID-JMS290>3.0.CO;2-3. [DOI] [PubMed] [Google Scholar]
Associated Data
This section collects any data citations, data availability statements, or supplementary materials included in this article.
Supplementary Materials
H4IIEC3 rat hepatic cells were treated with the indicated concentrations of palmitate for 24 hours and cell toxicity was measured by PI fluorescence. 400 μM palmitate doubled PI fluorescence after 24 hours. Data represent mean +/− S.E., n=8 for fluorescence assays; *, different from vehicle, p <.05.
(A) The antioxidant Vitamin E (Vit E, 1 mM) to palmitate-treated (PA, 400 μM) or BSA-treated (vehicle, 800 μM) H4IIEC3 cells and (A) Caspase 3/7 activity was measured after 12 hours. (B) 24-hour cell toxicity was measured by propidium iodide. Vitamin E co-treatment significantly blunts these markers of lipotoxicity. Data represent mean +/− S.E., n=8 for the toxicity assay; * different from vehicle, p <.05.
H4IIEC3 cells were co-treated with 100 nM rotenone (ROT) and either 400 μM palmitate (PA) or 800 μM BSA (vehicle) to examine the role of mitochondrial metabolism in ROS accumulation and apoptosis. Toxicity 24-hours post-treatment was assessed using propidium iodide. Data represent mean +/− S.E., n=4 for the toxicity assay; * different from vehicle, p <.05.