Abstract
Purpose
In glioblastoma, EphB4 receptors, a member of the largest family of receptor tyrosine kinases, are overexpressed in both tumor cells and angiogenic blood vessels. The purpose of this study was to examine whether the EphB4-binding peptide TNYL-RAW labeled with both 64Cu and near-infrared fluorescence dye Cy5.5 could be used as a molecular imaging agent for dual-modality positron emission tomography/computed tomography [PET/CT] and optical imaging of human glioblastoma in orthotopic brain tumor models.
Materials and Methods
TNYL-RAW was conjugated to Cy5.5 and the radiometal chelator 1,4,7,10-tetraazadodecane-N,N′,N″,N‴ -tetraacetic acid. The conjugate was then labeled with 64Cu for in vitro binding and in vivo dual μPET/CT and optical imaging studies in nude mice implanted with EphB4-expressing U251 and EphB4-negative U87 human glioblastoma cells. Tumors and brains were removed at the end of the imaging sessions for immunohistochemical staining and fluorescence microscopic examinations.
Results
μPET/CT and near-infrared optical imaging clearly showed specific uptake of the dual-labeled TNYL-RAW peptide in both U251 and U87 tumors in the brains of the nude mice after intravenous injection of the peptide. In U251 tumors, the Cy5.5-labeled peptide colocalized with both tumor blood vessels and tumor cells; in U87 tumors, the tracer colocalized only with tumor blood vessels, not with tumor cells.
Conclusions
Dual-labeled EphB4-specific peptide could be used as a noninvasive molecular imaging agent for PET/CT and optical imaging of glioblastoma owing to its ability to bind to both EphB4-expressing angiogenic blood vessels and EphB4-expressing tumor cells.
Keywords: EphB4, Peptide, μPET/CT, Near-infrared, Optical imaging
Introduction
Glioblastoma multiform (GBM) is the most malignant primary brain tumor. It exhibits rapid malignant progression and is extremely resistant to common multi-modal therapies. GBM is characterized by the nature of extensive invasion into surrounding normal brain tissue, which often results in recurrence near the resection margin [1, 2]. The prognosis for individuals with GBM depends upon how early the tumor is detected and how quickly treatments begin. Early diagnosis and treatment often extend the quality and length of life for individuals suffering with GBM. Thus, there is a pressing need to develop new diagnostic imaging agents to detect GBM at an early stage and to evaluate its response to therapy.
Erythropoietin-producing human hepatocellular carcinoma (Eph) receptors are the largest family of vertebrate receptor tyrosine kinases. Eph signaling plays an important role in several normal developmental processes, such as cell migration, axon guidance, and angiogenesis and limb development [3–9]. Eph receptors have also been implicated in tumorigenesis, angiogenesis, invasion, and metastasis [10–13]. Overexpression of the EphB4 receptor, an important member of the Eph receptor family, has been observed in numerous tumor types, including breast, prostate, bladder, lung, colon, ovarian, and gastric tumors [14–20]. In high-grade glioblastoma, EphB4 is expressed at high levels in both tumor cells and blood vessels [14]. Therefore, EphB4 is a promising target for noninvasive molecular imaging of glioblastoma.
Previously, we have reported use of the EphB4 receptor-specific TNYL-RAW peptide and TNYL-RAW-conjugated polymeric micelles for molecular imaging of EphB4 expression in human cancer xenograft models [21, 22]. In the current study, we developed an EphB4-binding peptide labeled with both 64Cu and near-infrared (NIR) fluorescence dye Cy5.5. We demonstrated that this dual-labeled TNYL-RAW was able to target both EphB4-expressing angiogenic tumor blood vessels and EphB4-expressing tumor cells. Thus, dual-labeled EphB4 imaging agents could be used for dual positron emission tomography/computed tomography (PET/CT) and optical imaging of glioblastoma.
Materials and Methods
Reagents and Cell Lines
All amino acid derivatives and coupling reagents were purchased from Novabiochem (San Diego, CA), Bachem (Torrance, CA), and Chem-Impex International (Wood Dale, IL). All other chemicals were purchased from Sigma-Aldrich (St. Louis, MO) unless otherwise specified. 64CuCl2 solution was purchased from the University of Wisconsin (Madison, WI). Human glioblastoma U87 cells stably transfected with the luciferase gene (U87-Luc) were a gift from Dr. Juri Gelovani (Wayne State University, Detroit, MI). Human glioblastoma U251 cells were a gift from Dr. Shuyun Huang (UT MD Anderson Cancer Center). Cell authenticity has been confirmed by fingerprint experiment from a sequencing core facility (UT MD Anderson Cancer Center, TX). Dulbecco's Modified Eagle Medium/Nutrient Mixture F-12 (DMEM/F12) medium was obtained from Gibco (Carlsbad, CA). D-Luciferin was purchased from BIOSYNTH Chemistry & Biology (Staad, Switzerland). Rabbit anti-human EphB4 antibody was obtained from Santa Cruz Biotechnology (Santa Cruz, CA). Cy5.5 dye was purchased from Amersham Pharmacia Biotech (Piscataway, NJ). Rat anti-mouse CD31 antibody was purchased from Millipore (Billerica, MA).
Synthesis of Cy5.5-TNYL-RAW and Cy5.5-TNYL-RAW-DOTA
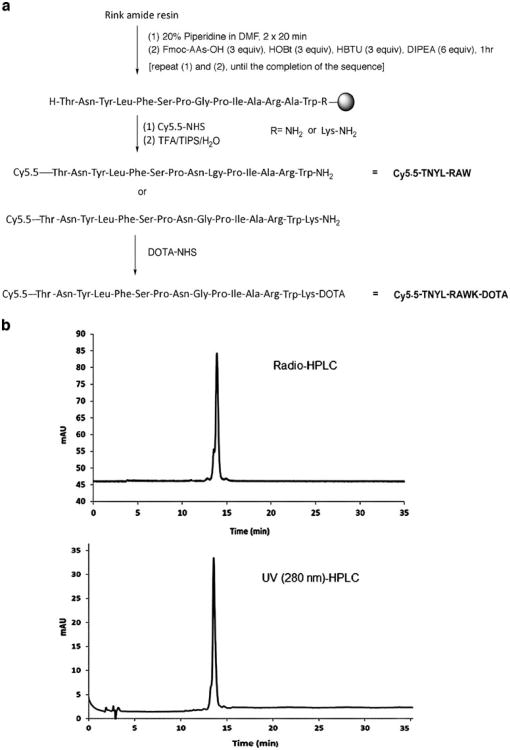
Peptide Cy5.5-Thr(tBu)-Asn(Trt)-Tyr(tBu)-Leu-Phe-Ser(tBu)-Pro-Asn(Trt)-Gly-Pro-ILe-Ala-Arg(Pbf)-Ala-Trp(Boc) and Cy5.5-Thr(tBu)-Asn(Trt)-Tyr(tBu)-Leu-Phe-Ser(tBu)-Pro-Asn(Trt)-Gly-Pro-ILe-Ala-Arg(Pbf)-Ala-Trp(Boc)-Lys(Boc) were synthesized on solid phase (Fig. 1a). Briefly, the Rink amide resin (0.05–0.1 g) was swollen and washed five times with 1.5 ml of dimethylformamide (DMF)/methylene chloride (CH2Cl2). Fluorenylmethyloxycarbonyl (Fmoc) groups were removed by washing with 1.5 ml of 20 % piperidine in DMF two times for 20 min each. For coupling, threefold excesses of Fmoc–amino acids, diisopropylcarbodiimide, and 1-hydroxybenzotriazole were used in 3 ml of DMF/CH2Cl2. This procedure was then repeated once.
Fig. 1.
a Synthetic schemes of Cy5.5-TNYL-RAW and Cy5.5-TNYL-RAW-DOTA. b HPLC chromatograms of Cy5.5-TNYL-RAW-64Cu-DOTA. The radiochemical purify was >95 %.
After the coupling and deprotection steps, resins were washed three times with 3 ml of DMF/CH2Cl2. After peptide chain elongation was complete, resins were washed three times with 3 ml of CH2Cl2 and treated with trifluoroacetic acid/triisopropylsilane/H2O (95:2.5:2.5, v/v/v) for 15 min each. The combined filtrates were left at room temperature for 1–2 h, and the volumes were then reduced in a vacuum. The resulting peptides Cy5.5-TNYL-RAW and Cy5.5-TNYL-RAWK were precipitated in ice-cold ethyl ether, collected by centrifugation, washed two times with ethyl ether, and centrifuged at 5,000 rpm for 10 min.
After they were dried, the peptides were purified by reverse-phase high-performance liquid chromatography (RP-HPLC) on an Agilent 1200 system (Vydac C-18, 10×250 mm, 10 μm; Agilent, Santa Clara, CA). A solution of 1,4,7,10-tetraazadodecane-N,N′, N″,N‴ -tetraacetic acid (DOTA)-NHS (1 eq) and Cy5.5-TNYL-RAWK in DMF and N,N-diisopropylethylamine (10/1) was stirred at room temperature overnight. After the solvent was removed under vacuum, the residual was purified by RP-HPLC, eluted with a 0.01-M solution of NH4OAc in water and acetonitrile, and lyophilized to yield Cy5.5-TNYL-RAWK-DOTA. The scrambled peptide (scTNYL-RAW) and its corresponding labeled compounds Cy5.5-scTNYL-RAW and Cy5.5-scTNYL-RAWK-DOTA were similarly synthesized. The products were validated by analytical HPLC and electrospray ionization mass spectrometry (Agilent Technologies, Santa Clara, CA).
Immobilization of EphB4 Receptors to Sensor Chips
Stock solution (100 μg/ml) of EphB4/Fc (extracellular domain of human EphB4 fused to the carboxy terminal Fc region of human IgG1) in phosphate-buffered saline (PBS) was diluted to 25, 12.5, and 6.25 μg/ml with 10 mM sodium acetate buffer at pH 4.5 and immobilized to a CM5 sensor chip using the amine coupling reaction, following the manufacturer-provided procedures (GE Healthcare, Piscataway, NJ). Briefly, the surfaces of the chips in flow cell (FC)-1, FC-2, FC-3, and FC-4 were activated by exposing them to a mixture of 200 mM N-ethyl-N′-(dimethylaminopropyl)carbodiimide and 50 mM N-hydroxysuccinimide for 7 min. FC-1 was used as a reference surface and was directly deactivated by injection of 1 M ethanolamine at pH 8.5 for 7 min. FC-2, FC-3, and FC-4 were injected with 25, 12.5, and 6.25 μg/ml EphB4/Fc, respectively, followed by injection of 1 M ethanolamine to block the remaining activated ester groups on the surface. The chip was allowed to stabilize for at least 2 h in 10 mM HEPES buffer, pH 7.4, including 150 mM NaCl, 1 % BSA, 3 mM EDTA, and 0.005 % surfactant P20 (HBSEP) running buffer before the test analytes were injected.
Surface Plasmon Resonance Assay for Receptor Binding Affinity
Binding assays were performed at 25 °C in HBSEP running buffer. The peptides were diluted in HBSEP buffer, filtered, degassed, and injected at concentrations between 1.6 and 800 nM at a flow rate of 30 μl per minute. The injection time of peptides into the HBSEP buffer was 4 min, followed by a 4-min dissociation period. The chips were regenerated using a 1-min pulse of 10 mM glycine (pH 2.2) after each binding circle. Each cycle consisted of a 1-min waiting period to allow monitoring of the baseline binding stability. For subtraction of bulk effects caused by changes in the buffer composition or nonspecific binding, double referencing was performed in surface plasmon resonance (SPR) binding studies. Thus, all samples analyzed were additionally injected onto an uncoated reference surface (FC-1). Samples of the running buffer were also injected onto the EphB4/Fc-coated flow cells. All sensorgrams were double-reference-subtracted from those obtained from the reference flow cell and those from buffer-alone samples. Data were evaluated with BIAevaluation software (version 3.0, GE Healthcare) with application of a simple 1:1 binding mass transfer model. The sensorgrams obtained were fitted globally over the whole range of injected concentrations for both the association and dissociation phases. Equilibrium dissociation constants were then calculated from the rate constants (Kd=Koff/Kon).
Stable Transfection of Luciferase Gene into U251 Cells (U251-Luc)
U251 cells were seeded in six-well plates (5×10⁵ cells per well) and incubated overnight at 37 °C in a humidified incubator in an atmosphere of 5 % CO2 24 h before the experiment. DMEM/F12 culture medium (2 ml), excluding fetal bovine serum, with 50 μl of Cignal™ Lenti Positive Control (luc) viral particles (Qiagen, Frederick, MD) and 8 μg/ml polybrene were added into the well after the previous complete DMEM/F12 culture medium was removed. The plates were gently swirled to mix the solution. Six hours later, the viral supernatant from the wells was removed, and the cells were reinfected with 2 ml of fresh supernatant (with 8 μg/ml polybrene). The next day, viral supernatant was removed, and DMEM/F12 with 10 % fetal bovine serum was added into the cells.
The cells were incubated for 72 h and then subcultured into 100mm dishes. Puromycin (Sigma, 1 μg/ml) was added into the cells to select the cells expressing luciferase. After 1 week, the luciferase activity of the selected positive cells was tested using the Xenogen IVIS-200 optical in vivo imaging system (Caliper Life Sciences, Hopkinton, MA).
Radiolabeling of Cy5.5-TNYL-RAWK-DOTA
64CuCl2 (74–148 MBq [2–4 mCi]) in 0.1 M sodium acetate (pH 5.2) was added to 10 μg of Cy5.5-TNYL-RAWK-DOTA in water. The reaction mixture was incubated at 70 °C for 1 h. The progress of the reaction was monitored using a RP-HPLC system equipped with a NaCl crystal radiodetector. The reaction was terminated with the addition of ethylenediaminetetraacetic acid. The 64Cu-labeled peptide was further purified, if necessary, by RP-HPLC on an Agilent 1100 system (4.6×250 mm, 10 mm; Vydac C-18) which was eluted with a linear gradient of 10–90 % acetonitrile in a 0.1 % aqueous trifluoroacetic acid solution over 35 min at a flow rate of 1.0 ml/min. Cy5.5-TNYL-RAWK-64Cu-DOTA (retention time, 13.5 min) was collected in 1- to 2-ml fractions. The solvent was then removed, reconstituted in saline, and passed through a 0.22-mm filter for use in the animal experiments.
Radiochemical purity, defined as the ratio of the main product peak to all peaks, was determined by HPLC on an Agilent 1100 system (4.6×250 mm, 10 mm; Vydac C-18, with UV and radioactivity detectors). The column was eluted with a linear gradient of 10–90 % acetonitrile in a 0.1 % aqueous trifluoroacetic acid solution over 35 min at a flow rate of 1.0 ml/min.
Orthotopic Tumor Model
All animal work was carried out in accordance with the MD Anderson Institutional Animal Care and Use Committee guidelines. Male nude mice (8–10 weeks old; Charles River Laboratories, Houston, TX) were used for the imaging experiments. U87-Luc cells (1×10⁶) or U251-Luc cells (3×10⁶) were implanted into the brain of the nude mice (3 mm deep, 1 mm to the right and 2.5 mm behind the bregma) using a small animal stereotaxic device (David Kopf Instruments, Tujunga, CA).
Bioluminescence Imaging
On day 10 after tumor inoculation, the mice received a tail vein injection of d-luciferin (4 mg/kg). Tumor burden as measured by luciferase activity was assessed using the Xenogen IVIS-200 imaging system. The bioluminescence imaging signal generated in mice was quantified using Living Image V.2.11 software and IGOR image analysis software (V.4.02 A; WaveMetrics, Portland, OR). The region of interest (ROI) was manually selected, and the signal intensity was expressed in terms of the number of photons per second per square centimeter.
NIR Optical Imaging
Mice bearing U87-Luc tumors (n=12) or U251-Luc tumors (n=12) were imaged using the Xenogen IVIS-200 system at 1, 4, and 24 h after tail vein injection of 10 μg of Cy5.5-TNYL-RAWK-DOTA or scrambled peptide Cy5.5-scTNYL-RAWK-DOTA. The Cy5.5 fluorescence filter set (excitation 675 nm, bandwidth 30 nm; emission 695–770 nm) was applied. At the end of the last imaging session (24 h after injection), the mice were killed, various organ tissues were removed and weighed, and the fluorescence signal of the various tissues, including tumors, was analyzed using Living Imaging V.2.11 software and IGOR image analysis software (V.4.02 A). The ROI was manually selected, and the signal intensity was expressed in terms of the number of photons per second per square centimeter.
μPET/CT
Mice bearing U251-Luc (n = 3) or U87-Luc tumors (n=4) were imaged using (μPET/CT at 1 and 24 h after tail vein injection of Cy5.5-TNYL-RAWK-64Cu-DOTA [7.4 MBq (200 μCi), 0.5– 1.0 μg]. To confirm the specific binding of peptide on tumors, the blocking experiment was performed on the U251-Luc tumor-bearing mice. The tumor-bearing mice were injected with 7.4 MBq (200 μCi) of Cy5.5-TNYL-RAWK-64Cu-DOTA and with nonradiolabeled (“cold”) Cy5.5-TNYL-RAWK-DOTA peptide at a dose of 50 (μg/mouse. Images were acquired using an Inveon μPET/CT system (Siemens, Washington, DC). Tumor-bearing mice were anesthetized with isoflurane (2 % in oxygen) and placed in prone position. The CT parameters were as follows: X-ray voltage, 80 kVp; anode current, 500 mA; and exposure time of each of the 360 rotational steps, 300–350 ms. Images were reconstructed using the two-dimensional ordered-subsets expectation maximization algorithm. PET and CT image fusion and image analysis were performed using Inveon Research Workplace (Siemens Preclinical Solutions). For tumor voxel intensity calculation, an irregular three-dimensional ROI was manually drawn corresponding to PET images. A circular ROI was drawn on the normal brain area. A ROI was also drawn using a standard radiotracer solution (containing 1 % of the injection dose) placed beside the animals. The mean activities within the ROI of the tumor and normal brain were calculated in an Inveon Research Workplace workstation (Siemens).
Autoradiography
Mice brains containing tumors harvested at the end of the last (μPET/CT imaging session were snap-frozen and cut into 10-μm sections. The sections were photographed and exposed on BAS-SR 2025 Fuji phosphorus films. The film was scanned with a FLA5100 Multifunctional Imaging System (Fujifilm Medical Systems USA, Stamford, CT). After the autoradiographic study, optical images of the sections were acquired using an Odyssey Infrared Imaging System (LI-COR Biosciences, Lincoln, NE).
Hematoxylin and Eosin Staining and Immunohistochemical Analysis
After the (μPET/CT studies were completed, the mice were killed, and their brains including implanted tumor were excised, snapfrozen, and cut into 4-(μm sections. For NIR optical imaging study, U87-bearing mice were killed at 1, 4, and 24 h after peptide injection (n=4 for each time point). For immunohistochemical analysis, frozen U251-Luc and U87-Luc tumor sections were fixed in 4 % paraformaldehyde solution for 20 min at room temperature and washed with PBS three times. Tumor sections were blocked with 10 % goat serum for 30 min at room temperature, and the slides were then incubated with rabbit anti-human EphB4 antibody (1:100 dilution; U-200, Santa Cruz Biotechnology) and rat anti-mouse CD31 (1:50 dilution; Millipore) in PBS at 4 °C overnight. After incubation with the primary antibody, slides were washed with PBS three times and incubated with secondary goat anti-rabbit antibody conjugated with Alexa Fluor 488 (1:500 dilution; Invitrogen, Grand Island, NY) and donkey anti-rat antibody conjugated with Alexa Fluor 594 (1:500 dilution, Invitrogen). Slides were washed again in PBS and counterstained with 4′,6-diamidino-2-phenylindole (DAPI). Frozen slides were sent to the core histology facility at MD Anderson for hematoxylin and eosin (H&E) staining. Photomicrographs were obtained using a Zeiss Axiovert Z.1 fluorescence microscope (Zeiss, Germany).
Statistical Analysis
Student t tests were used to analyze biodistribution data. P values <0.05 were considered statistically significant calculated by Microsoft Excel software.
Results
Synthesis and Radiolabeling of Cy5.5-TNYL-RAWK-DOTA
Peptide synthesis and introduction of Cy5.5 were carried out on solid phase (Fig. 1a). The m/z [M + H]+ for Cy5.5-TNYL-RAW (C121H159N24O33S4) was calculated to be 2,604.0384; the actual measurement was 2,604.0366. The m/z [M + H]+ for Cy5.5-TNYL-RAWK-DOTA (C145H200N31O42S4) was calculated to be 3,175.3224; the actual measurement was 3,175.3350. Radiochemical purity, defined as the ratio of the main product peak to all peaks, was determined by HPLC to be >95 % (Fig. 1b). The specific activity of Cy5.5-TNYL-RAWK-64Cu-DOTA used in the in vitro and in vivo experiments was typically 7.4–14.8 MBq/nmol (0.2–0.4 Ci/μmol) at the end of synthesis.
Binding Affinity of Cy5.5-TNYL-RAW and Cy5.5-TNYL-RAWK-DOTA
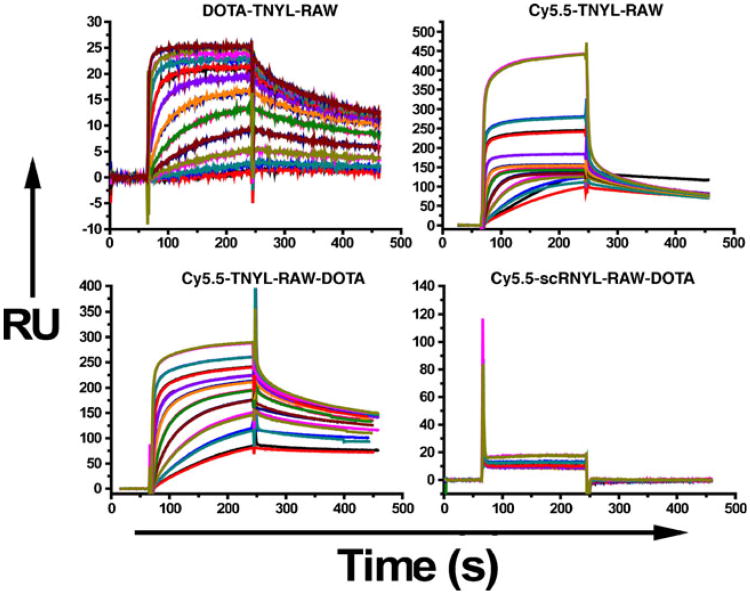
Figure 2 shows representative sensorgrams obtained from SPR analyses of DOTA-TNYL-RAW, Cy5.5-TNYL-RAW, Cy5.5-TNYL-RAWK-DOTA, and scrambled peptide Cy5.5-scTNYL-RAW, with fitting curves obtained using a global 1:1 mass transfer model. The corresponding binding kinetics and affinity data are summarized in Table 1. TNYL-RAW had a Kd of 3.06 nM. Conjugation of Cy5.5 to the N-terminus or Cy5.5 to the N-terminus and DOTA to the C-terminus of the peptide did not significantly affect the Kd value of the parent TNYL-RAW peptide. Conjugation of DOTA to the N-terminus, on the other hand, increased the Kd value by a factor of 7.6 (Table 1).
Fig. 2.
Surface plasmon resonance sensorgrams of DOTA-TNYL-RAW, Cy5.5-TNYL-RAW, Cy5.5-TNYL-RAWKI-DOTA, and scrambled Cy5.5-scTNYL-RAW on sensor chips coated with EphB4/Fc. Peptides were injected as 10 twofold-concentration series ranging from 1.6 to 800 nM and were analyzed in duplicate binding cycles. Data sets (shown in black) are overlaid with curves fit to a 1:1 mass transfer interaction model (colored lines). Vertical axes, in response units (RU), represent binding of each peptide to immobilized EphB4/Fc.
Table 1. Association rate constant (Kon), dissociation rate constant (Koff), and dissociation constant (Kd) of various TNYL-RAW peptide derivatives from surface plasmon resonance analysis measured on immobilized EphB4 receptors.
| Analyte | Kon [M−1 s−1] | Koff [s−1] | Kd [M] | χ2 |
|---|---|---|---|---|
| DOTA-TNYL-RAW | 1.1 × 10⁵ | 2.56×10⁻³ | 2.33−8 | 0.28 |
| Cy5.5-TNYL-RAW | 4.15×10⁶ | 5.28×10⁻³ | 1.27−9 | 4.37 |
| Cy5.5-TNYL-RAWK-DOTA | 1.86× 10⁶ | 1 87 × 1 0−3 | 1.01−9 | 5.67 |
| TNYL-RAW | 4.26×10⁵ | 1.3× 10⁻³ | 3.06−9 | 0.155 |
The χ2 values indicate the quality of the fit
Optical Imaging of U251-Luc and U87-Luc Tumors in the Brain
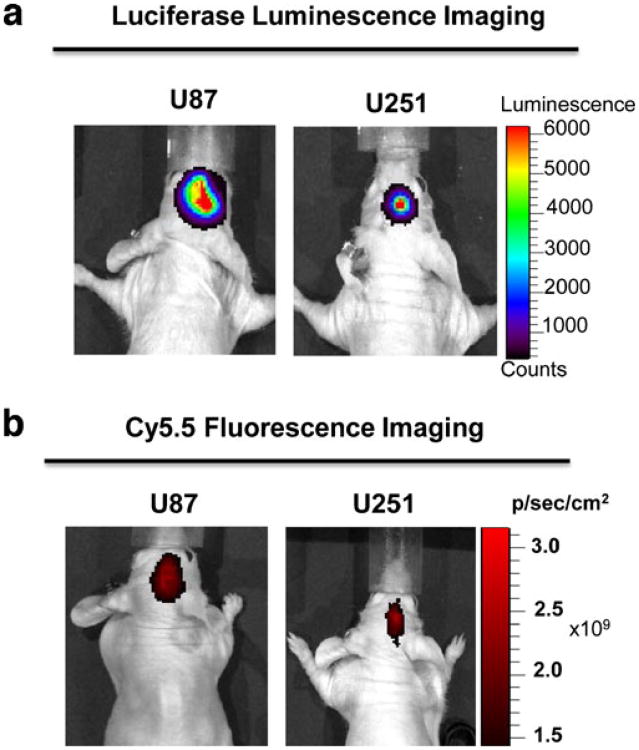
Ten days after inoculation of U87-Luc or U251-Luc cells into the brain of nude mice, strong luciferase activity was detected (Fig. 3a), indicating successful tumor intake after orthotopic tumor cell implantation.
Fig. 3.
Representative luciferase and Cy5.5 optical images of orthotopic U87-Luc and U251-Luc tumors in mice. a Luciferase signal of U87-Luc and U251-Luc 10 days after implantation of luciferase-positive tumor cells. The substrate luciferin was injected intravenously 5 min prior to imaging session. b Cy5.5 near-infrared fluorescence optical imaging of U87-Luc and U251-Luc tumors 24 h after tail vein injection of Cy5.5-TNYL-RAWK-DOTA.
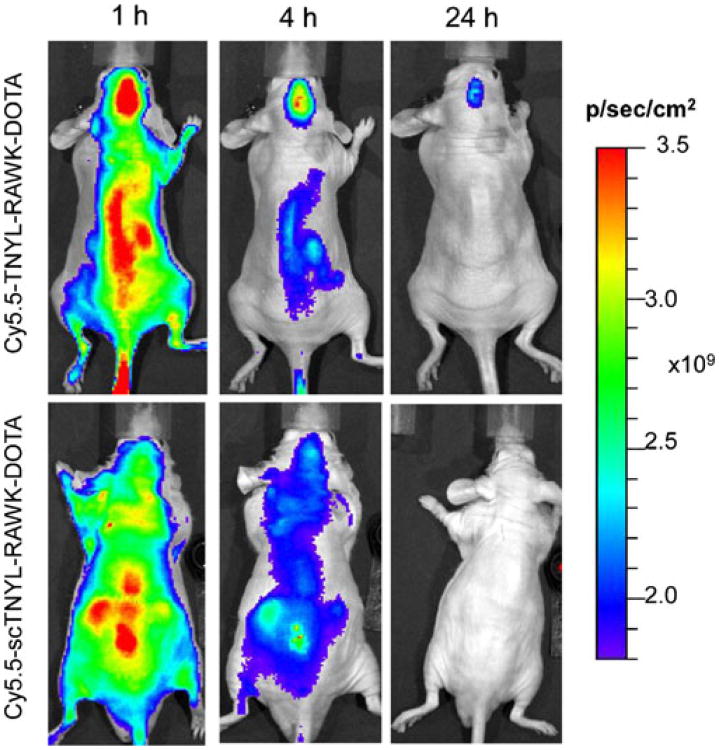
Figure 3b shows Cy5.5 fluorescence optical images of U87-Luc and U251-Luc tumors in the mouse brain 24 h after tail vein injection of Cy5.5-TNYL-RAWK-DOTA. Both U87-Luc and U251-Luc tumors were clearly visualized. To confirm the specific tumor uptake of Cy5.5-TNYL-RAWK-DOTA, NIR fluorescence imaging of Cy5.5-TNYL-RAWK-DOTA was compared with that of Cy5.5-conjugated scrambled TNYL-RAW peptide (Cy5.5-scTNYL-RAWK-DOTA) in mice bearing U87-Luc tumors. At 1, 4, and 24 h after intravenous injection, brain tumor uptake of Cy5.5-TNYL-RAWK-DOTA, but not Cy5.5-scTNYL-RAWK-DOTA, was clearly shown (Fig. 4).
Fig. 4.
Representative near-infrared fluorescence optical images of U87-Luc tumors taken at 1, 4, and 24 h after tail vein injection of Cy5.5-TNYL-RAWK-DOTA (upper panels) or Cy5.5-scTNYL-RAWK-DOTA (lower panels).
Ex vivo Analysis of the Fluorescence Signal Intensities of Dissected Tissues
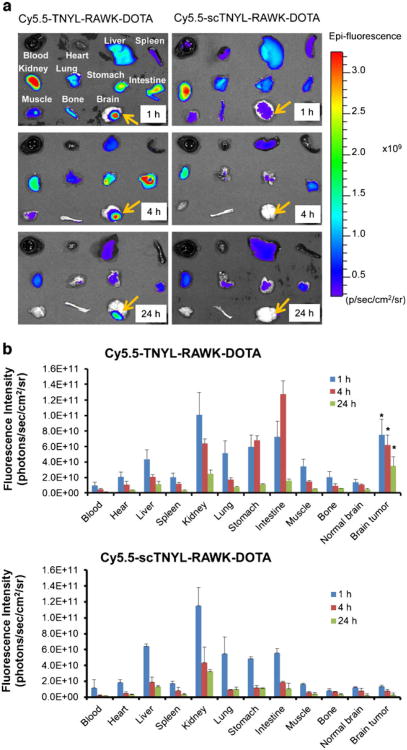
Figure 5a compares the biodistribution of Cy5.5-TNYL-RAWK-DOTA with that of Cy5.5-scTNYL-RAWK-DOTA in ex vivo analysis of dissected tissues from mice bearing U87-Luc tumors at different time points. For both compounds, high fluorescence activity was found in the liver, kidney, stomach, and intestine. At each time interval (1, 4, and 24 h), the uptake of Cy5.5-TNYL-RAWK-DOTA in U87-Luc tumors was significantly higher than that of Cy5.5-scTNYL-RAW-DOTA (P<0.05) (Fig. 5b).
Fig. 5.
Biodistribution of Cy5.5-TNYL-RAWK-DOTA or Cy5.5-scTNYL-RAWK-DOTA peptides in nude mice bearing orthotopic U87-Luc tumors at 1, 4, and 24 h after intravenous injection of each imaging probe (n=4). a Representative near-infrared fluorescence optical images of various tissues obtained from the mice at the end of each imaging session. b Biodistribution after intravenous injection of Cy5.5-TNYL-RAWK-DOTA (top panel) or Cy5.5-scTNYL-RAWK-DOTA (lower panel) using the fluorescence intensity measurement method. Data are plotted as photon flux per second per square centimeter of tissue and are presented as mean ± standard deviation (n=3). Asterisk indicates significant difference in tumor uptakes between the two compounds at each time point.
μPET/CT Imaging of Brain Tumors
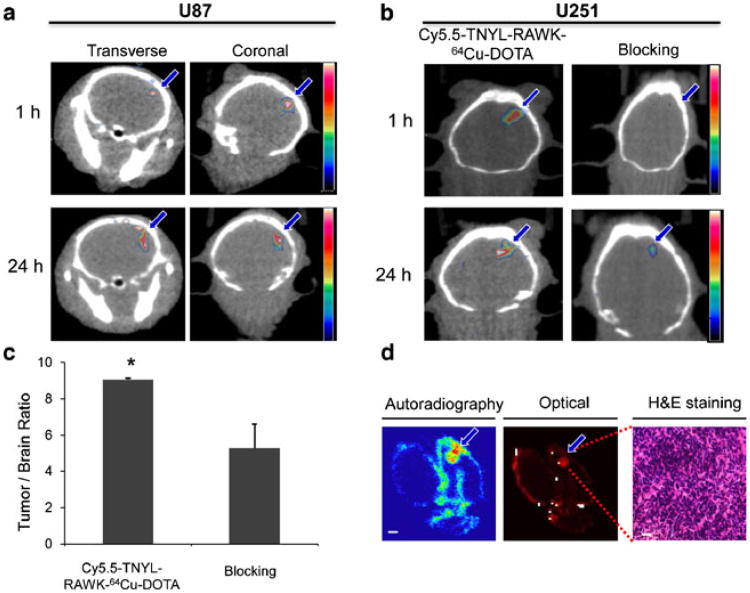
Figure 6a shows μPET/CT images of both coronal and transverse slices of mouse brains containing U87-Luc tumors. Tumors were clearly visualized at 1 and 24 h after tail vein injection of Cy5.5-TNYL-RAWK-64Cu-DOTA. Fig. 6b compares μPET/CT images obtained in the presence and absence of an excess dose of cold Cy5.5-TNYL-RAWK-DOTA at 1 and 24 h after radiotracer injection in U251-Luc tumor-bearing mice. The U251-Luc tumors were clearly visualized at both time points in the absence of the cold peptide, but tumors were barely discernible in the mice injected with the cold peptide. Coadministration ofcold Cy5.5-TNYL-RAWK-DOTA caused a 57 % reduction in the ratio of Cy5.5-TNYL-RAWK-64Cu-DOTA accumulation in the U251-Luc tumors compared with normal brain tissue, on the basis of tumor voxel intensity calculated from the μPET/CT images (P<0.05, Fig. 6c).
Fig. 6.
Micro-positron emission tomography/computed tomography (μPET/CT) and near-infrared fluorescence optical imaging of mice bearing U87-Luc and U251-Luc tumors at 1 and 24 h after intravenous injection of Cy5.5-TNYL-RAWK-64Cu-DOTA. a Representative μPET/CT images of U87-Luc tumors. b μPET/CT images of U251-Luc tumors with Cy5.5-TNYL-RAWK-64Cu-DOTA and Cy5.5-TNYL-RAWK-64Cu-DOTA plus a large excess of cold Cy5.5-TNYL-RAWK-DOTA. c Mean tumor voxel intensity/normal brain tissue voxel intensity in mice injected with Cy5.5-TNYL-RAWK-64Cu-DOTA compared with those injected with Cy5.5-TNYL-RAWK-64Cu-DOTA and cold peptide, calculated from an irregular three-dimensional region of interest manually drawn on corresponding PET images (n=3, error bars indicate standard deviation). Asterisk indicates P value <0.05. d Representative autoradiograph, near-infrared optical fluorescence image, and hematoxylin and eosin-stained photomicrograph of the same excised brain tissue containing a U251-Luc tumor. Arrows, tumors.
Autoradiography and H&E Histology
Intracranial distribution of Cy5.5-TNYL-RAWK-64Cu-DOTA was visible in both autoradiographic images and fluorescence optical images of sections of mouse brain with U251-Luc tumor (Fig. 6d). Nuclear and optical signals were high in the U251-Luc brain tumors, and signals from radioactivity colocalized with signals from fluorescence. Fig. 6d also confirms typical tumor morphology in photomicrographs of H&E-stained tissue sections from areas with high nuclear and optical signal intensity.
Immunofluorescence
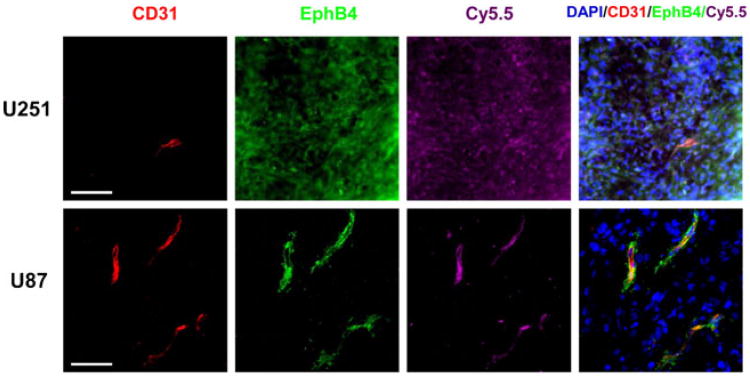
In Fig. 7, immunofluorescence shows expression of EphB4, the binding site of the Cy5.5-labeled TNYL-RAW peptide, on mouse brain sections containing implanted U251-Luc and U87-Luc tumors. In U251-Luc tumors, EphB4 (green) was expressed in both tumor cells and tumor-associated blood vessels (red CD31 staining). Cy5.5-TNYL-RAWK-64Cu-DOTA also bound to both tumor cells and tumor microvessels. However, in U87 tumors, EphB4 expression was detected only in tumor microvessels, not in tumor cells, and Cy5.5-TNYL-RAWK-64Cu-DOTA bound only to the tumor microvessels (Fig. 7).
Fig. 7.
Fluorescence microscopy of mouse brains with implanted U87-Luc or U251-Luc tumors excised after imaging studies. Mice bearing a U251-Luc or U87-Luc tumor were injected intravenously with Cy5.5-TNYL-RAWK-64Cu-DOTA peptides. Signal from Cy5.5 is pseudocolored purple. EphB4 (green) was stained with rabbit anti-human EphB4 antibody and Alexa Fluor 488-conjugated goat anti-rabbit immunoglobulin. CD31 (red), which is the marker of the endothelial cells of tumor-associated blood vessels, was stained with rat anti-mouse CD31 antibody and Alexa Fluor 594-conjugated donkey anti-rat antibody. Cell nuclei were counterstained with DAPI (blue). Bar=40 μm.
Discussion
Various imaging techniques are available for differential diagnosis and evaluation of glioblastomas as well as for monitoring response to treatment. PET imaging has a high detection sensitivity, which makes it especially suitable for tracking radiotracers used in noninvasive in vivo molecular imaging. However, PET imaging does not provide sufficient resolution. Optical imaging (near-infrared fluorescence, bioluminescence, photoacoustic imaging, etc.) is an emerging molecular imaging modality that offers high sensitivity, high spatial resolution (e.g., photoacoustic imaging), low cost, and real-time data acquisition and does not use ionization radiation [23–29]. Furthermore, the fluorescent signal from the imaging probes permits ex vivo analysis of excised tissues for validation of their binding to the molecular targets in vivo. Because of limited penetration depth, near-infrared fluorescence imaging is better applied in intraoperative setting to facilitate surgical resection of glioma because it defines tumor margin better than the currently used imaging modalities such as PET and MRI [30]. In a recent study, Stummer et al. [31] demonstrated in a clinical trial that glioblastomas contrast-enhanced with 5-aminolevulinic acid, which is a natural precursor of hemoglobin that elicits synthesis and accumulation of fluorescent porphyrins in glioblastoma tissue, were completely resected in 90 of 139 patients (65 %), whereas tumors enhanced with white light were completely resected in only 47 (36 %) of 131 patients. Using enhanced fluorescent contrast agents facilitated more complete resection of the glioblastomas, which led to 6-month improved progression-free survival in patients with malignant glioblastoma [31]. These encouraging results clearly invite for further improvement in outcome through the use of highly sensitive, highly specific NIR fluorescence imaging probes.
In the current study, we developed dual-labeled EphB4-specific TNYL-RAW peptides for visualization of glioblas-tomas with μPET/CT and NIR fluorescence imaging in an orthotopic mouse model. SPR analysis showed that the Kd values of Cy5.5-TNYL-RAW and Cy5.5-TNYL-RAWK-DOTA were ∼1 nM, in the same order of magnitude as the Kd values of the parent TNYL-RAW peptide (3.07 nM). This high binding affinity of the dual-labeled EphB4-specific peptide to the EphB4 receptor in vitro makes it suitable for in vivo molecular imaging applications.
We found that 64Cu-labeled Cy5.5-TNYL-RAW-DOTA peptide was taken up in both U251-Luc and U87-Luc tumors in the brain of nude mice and that fluorescent signal intensity reduced 57 % by in U251-Luc tumors by coinjection of a large excess of cold Cy5.5-TNYL-RAWK-DOTA peptide along with Cy5.5-TNYL-RAWK-64Cu-DOTA. In addition, the scrambled peptide had insignificant uptake in the U87-Luc tumors. Taken together, these data suggest that tumor uptake of Cy5.5-TNYL-RAWK-64Cu-DOTA in brain tumor xenografts is mediated by EphB4 receptors.
The tumor-associated blood vessels in the orthotopic mice models of human glioma also express EphB4. According to the gene sequence alignment, human and mouse EphB4 receptor extracellular domains share approximately 88 % homology. Radiolabeled TNYL-RAW has been shown to bind to EphB4-expressing tumor cells of both mouse and human origins [21]. Interestingly, in the U251 model, we found that Cy5.5-labeled peptides bound to tumor cells and tumor-associated blood vessels, both of which express EphB4. In contrast, in the U87 model, Cy5.5-labeled peptides bound only to tumor-associated vessels, which expressed EphB4, but not to tumor cells, which did not express EphB4 (Fig. 7). These findings suggested that EphB4-binding peptides could be useful for noninvasive imaging of both EphB4-expressing angiogenic blood vessels and tumor cells.
Conclusions
In this study, we found that a TNYL-RAW peptide labeled with 64Cu and Cy5.5 was an effective agent for μPET/CT imaging and NIR optical imaging in orthotopic glioblastoma mouse models. We further showed that the dual-labeled imaging probe is capable of binding to both EphB4-expressing angiogenic blood vessels and tumor cells. Specifically, in U87-Luc tumors, the dual-labeled peptide bound only to CD31- and EphB4-expressing tumor blood vessels, not to tumor cells (which did not express EphB4); however, in the U251-Luc tumors, the dual-labeled peptide bound to both EphB4-expressing angiogenic blood vessels and EphB4-expressing tumor cells. Thus, dual-labeled EphB4-specific peptide may be potentially useful as a molecular imaging agent for PET/CT detection of glioblastoma, followed by near-infrared fluorescence image-guided surgery.
Acknowledgments
We thank Erica Goodoff for editing the manuscript. This work was supported in part by the John S. Dunn Foundation. The small animal imaging facility of the University of Texas MD Anderson Cancer Center is supported in part by the National Institutes of Health through MD Anderson Cancer Center Support Grant CA016672.
Footnotes
Conflict of Interest. The authors declare that they have no conflicts of interest.
References
- 1.Furnari FB, Fenton T, Bachoo RM, et al. Malignant astrocytic glioma: genetics, biology, and paths to treatment. Genes Dev. 2007;21(2):683–710. doi: 10.1101/gad.1596707. [DOI] [PubMed] [Google Scholar]
- 2.Wen PY, Kesari S. Malignant gliomas in adults. New Engl J Med. 2008;359:492–507. doi: 10.1056/NEJMra0708126. [DOI] [PubMed] [Google Scholar]
- 3.Murai KK, Pasquale EB. ‘Eph’ective signaling: forward, reverse and crosstalk. J Cell Sci. 2003;116:2823–2832. doi: 10.1242/jcs.00625. [DOI] [PubMed] [Google Scholar]
- 4.Flanagan JG, Vanderhaeghen P. The ephrins and Eph receptors in neural development. Annu Rev Neurosci. 1998;21:309–345. doi: 10.1146/annurev.neuro.21.1.309. [DOI] [PubMed] [Google Scholar]
- 5.Boyd AW, Lackmann M. Signals from Eph and ephrin proteins: a developmental tool kit. Sci STKE. 2001;2001:re20. doi: 10.1126/stke.2001.112.re20. [DOI] [PubMed] [Google Scholar]
- 6.Holder N, Klein R. Eph receptors and ephrins: effectors of morphogenesis. Development. 1999;126:2033–2044. doi: 10.1242/dev.126.10.2033. [DOI] [PubMed] [Google Scholar]
- 7.Cheng N, Brantley DM, Chen J. The ephrins and Eph receptors in angiogenesis. Cytokine Growth Factor Rev. 2002;13:75–85. doi: 10.1016/s1359-6101(01)00031-4. [DOI] [PubMed] [Google Scholar]
- 8.Durbin L, Brennan C, Shiomi K, et al. Eph signaling is required for segmentation and differentiation of the somites. Genes Dev. 1998;12:3096–3109. doi: 10.1101/gad.12.19.3096. [DOI] [PMC free article] [PubMed] [Google Scholar]
- 9.Pasquale EB, Deerinck TJ, Singer SJ, Ellisman MH. Cek5, a membrane receptor-type tyrosine kinase, is in neurons of the embryonic and postnatal avian brain. J Neurosci. 1992;12:3956–3967. doi: 10.1523/JNEUROSCI.12-10-03956.1992. [DOI] [PMC free article] [PubMed] [Google Scholar]
- 10.Dodelet VC, Pasquale EB. Eph receptors and ephrin ligands: embryogenesis to tumorigenesis. Oncogene. 2000;19:5614–5619. doi: 10.1038/sj.onc.1203856. [DOI] [PubMed] [Google Scholar]
- 11.Easty DJ, Herlyn M, Bennett DC. Abnormal protein tyrosine kinase gene expression during melanoma progression and metastasis. Int J Cancer. 1995;60:129–136. doi: 10.1002/ijc.2910600119. [DOI] [PubMed] [Google Scholar]
- 12.Kiyokawa E, Takai S, Tanaka M, et al. Overexpression of ERK, an EPH family receptor protein tyrosine kinase, in various human tumors. Cancer Res. 1994;54:3645–3650. [PubMed] [Google Scholar]
- 13.Wicks IP, Wilkinson D, Salvaris E, Boyd AW. Molecular cloning of HEK, the gene encoding a receptor tyrosine kinase expressed by human lymphoid tumor cell lines. Proc Natl Acad Sci U S A. 1992;89:1611–1615. doi: 10.1073/pnas.89.5.1611. [DOI] [PMC free article] [PubMed] [Google Scholar]
- 14.Erber R, Eichelsbacher U, Powajbo V, et al. EphB4 controls blood vascular morphogenesis during postnatal angiogenesis. EMBO J. 2006;25:628–641. doi: 10.1038/sj.emboj.7600949. [DOI] [PMC free article] [PubMed] [Google Scholar]
- 15.Koolpe M, Burgess R, Dail M, Pasquale EB. EphB receptor-binding peptides identified by phage display enable design of an antagonist with ephrin-like affinity. J Biol Chem. 2005;280:17301–17311. doi: 10.1074/jbc.M500363200. [DOI] [PubMed] [Google Scholar]
- 16.Kumar SR, Scehnet JS, Ley EJ, et al. Preferential induction of EphB4 over EphB2 and its implication in colorectal cancer progression. Cancer Res. 2009;69:3736–3745. doi: 10.1158/0008-5472.CAN-08-3232. [DOI] [PubMed] [Google Scholar]
- 17.Kumar SR, Singh J, Xia G, et al. Receptor tyrosine kinase EphB4 is a survival factor in breast cancer. Am J Pathol. 2006;169:279–293. doi: 10.2353/ajpath.2006.050889. [DOI] [PMC free article] [PubMed] [Google Scholar]
- 18.Nakamoto M, Bergemann AD. Diverse roles for the Eph family of receptor tyrosine kinases in carcinogenesis. Microsc Res Tech. 2002;59:58–67. doi: 10.1002/jemt.10177. [DOI] [PubMed] [Google Scholar]
- 19.Pasquale EB. EPH receptor signaling casts a wide net on cell behavior. Nat Rev Mol Cell Bio. 2005;6:462–475. doi: 10.1038/nrm1662. [DOI] [PubMed] [Google Scholar]
- 20.Xia G, Kumar SP, Stein JP, et al. EphB4 receptor tyrosine kinase is expressed in bladder cancer and provides signals for cell survival. Oncogene. 2006;25:769–780. doi: 10.1038/sj.onc.1209108. [DOI] [PubMed] [Google Scholar]
- 21.Xiong CY, Huang MA, Zhang R, et al. In vivo small-animal PET/CT of EphB4 receptors using Cu-64-labeled peptide. J Nucl Med. 2011;52:241–248. doi: 10.2967/jnumed.110.081943. [DOI] [PubMed] [Google Scholar]
- 22.Zhang R, Xiong CY, Huang M, et al. Peptide-conjugated polymeric micellar nanoparticles for Dual SPECT and optical imaging of EphB4 receptors in prostate cancer xenografts. Biomaterials. 2011;32:5872–5879. doi: 10.1016/j.biomaterials.2011.04.070. [DOI] [PMC free article] [PubMed] [Google Scholar]
- 23.Wang W, Ke S, Kwon S, et al. A new optical and nuclear dual-labeled imaging agent targeting interleukin 11 receptor alpha-chain. Bioconjug Chem. 2007;18:397–402. doi: 10.1021/bc0602679. [DOI] [PubMed] [Google Scholar]
- 24.Grinvald A, Frostig RD, Lieke E, Hildesheim R. Optical imaging of neuronal activity. Physiol Rev. 1988;68:1285–1366. doi: 10.1152/physrev.1988.68.4.1285. [DOI] [PubMed] [Google Scholar]
- 25.Gibson AP, Hebden JC, Arridge SR. Recent advances in diffuse optical imaging. Phys Med Biol. 2005;50:R1–R43. doi: 10.1088/0031-9155/50/4/r01. [DOI] [PubMed] [Google Scholar]
- 26.Bremer C, Ntziachristos V, Weissleder R. Optical-based molecular imaging: contrast agents and potential medical applications. Eur Radiol. 2003;13:231–243. doi: 10.1007/s00330-002-1610-0. [DOI] [PubMed] [Google Scholar]
- 27.Hielscher AH. Optical tomographic imaging of small animals. Curr Opin Biotech. 2005;16:79–88. doi: 10.1016/j.copbio.2005.01.002. [DOI] [PubMed] [Google Scholar]
- 28.Licha K, Olbrich C. Optical imaging in drug discovery and diagnostic applications. Adv Drug Deliv Rev. 2005;57:1087–1108. doi: 10.1016/j.addr.2005.01.021. [DOI] [PubMed] [Google Scholar]
- 29.Niell CM, Smith SJ. Live optical imaging of nervous system development. Annu Rev Physiol. 2004;66:771–798. doi: 10.1146/annurev.physiol.66.082602.095217. [DOI] [PubMed] [Google Scholar]
- 30.Roessler K, Becherer A, Donat M, et al. Intraoperative tissue fluorescence using 5-aminolevolinic acid (5-ALA) is more sensitive than contrast MRI or amino acid positron emission tomography (18F-FET PET) in glioblastoma surgery. Neurol Res. 2012;34:314–317. doi: 10.1179/1743132811Y.0000000078. [DOI] [PubMed] [Google Scholar]
- 31.Stummer W, Pichlmeier U, Meinel T, et al. Fluorescence-guided surgery with 5-aminolevulinic acid for resection of malignant glioma: a randomised controlled multicentre phase III trial. Lancet Oncol. 2006;7:392–401. doi: 10.1016/S1470-2045(06)70665-9. [DOI] [PubMed] [Google Scholar]


