

Abstract
Aberrantly activated c-MET signaling occurs in several cancers, promoting the development of c-MET inhibitors. In this study, we found that eight of 8 thyroid cancer cell lines (including six anaplastic thyroid cell lines) have prominent expression of c-MET protein. Fifty percent of the thyroid cancer cell lines (four of 8) were growth-inhibited by two small molecule c-MET inhibitors (Tivantinib and Crizotinib), associated with apoptosis and G2/M cell cycle arrest. However, Crizotinib did not inhibit 50% proliferation of thyroid cancer cells (SW1736 and TL3) at a concentration at which the drug completely inhibited ligand-stimulated c-MET phosphorylation. On the other hand, Tivantinib was less potent than Crizotinib at inhibiting c-MET phosphorylation, but was more potent than Crizotinib at decreasing cell growth. Suppressing c-MET protein expression and phosphorylation using siRNA targeting c-MET did not induce cell cycle arrest and apoptosis. Taken together, Tivantinib and Crizotinib have off target(s) activity, contributing to their anti-tumor activity. In vivo study showed that Crizotinib markedly inhibited the growth of thyroid cancer cells (SW1736) in immunodeficient mice. In summary, c-MET inhibitors (Tivantinib and Crizotinib) suppress the growth of aggressive thyroid cancer cells, and this potential therapeutic benefit results from their non-MET-targeting effects.
Keywords: c-MET, thyroid cancer, Crizotinib, Tivantinib, off-target
Introduction
HGF/c-MET axis plays an essential role in normal physiological processes such as embryonic development, angiogenesis and wound healing (1). Cancers activate this pathway by several different mechanisms including over-expression of c-MET, or activating mutations of the kinase domain of c-MET. This is associated with activation of downstream signaling pathways including MAPK/ERK, PIK3/AKT, STATs and IκBα/NF-κB which enhance proliferation, invasion, migration, survival, and metastasis (1, 2).
Various therapeutic approaches to control deregulated c-MET signaling of cancer cells have been developed, including small molecule c-MET kinase inhibitors (3, 4). Tivantinib (ARQ-197) was the first reported non-ATP–competitive small molecule c-MET inhibitor showing a growth-inhibitory effect against a panel of c-MET–expressing cancer cell lines (5). Clinical studies found that it was well tolerated in patients with advanced solid tumors (6, 7). Another drug, Crizotinib (PF-2341066) is a potent ATP competitive inhibitor of both c-MET and Anaplastic Lymphoma Kinase (ALK) demonstrating a >100-fold selectivity for inhibition of c-MET compared to >120 other kinases (8). Crizotinib was approved by the US Food and Drug Administration (FDA) for the treatment of patients with ALK positive, non-small-cell lung cancer (NSCLC) in 2011 (9). Patients are still being recruited for Phase I, II and III anti-tumor clinical trials for these drugs (http://www.clinicaltrials.gov; 2013).
The most common endocrine malignancy is thyroid cancer whose incidence has been increasing by 5.6% per year in men and 7.0% per year in women since 2005, with an estimated 60,220 new cases expected to be diagnosed in 2013 in the USA (American Cancer Society: Cancer Facts & Figures; 2013). These thyroid cancers are classified as follicular, papillary, medullary and anaplastic. Individuals with anaplastic thyroid carcinoma (ATC) have a fulminant course with a very poor prognosis (median survival from diagnosis, 5 months) (10).
Both thyroid cancer cell lines and thyroid carcinoma tissue specimens (11–15) have high expression of c-MET. Nearly 70%–90% of papillary thyroid carcinoma (PTC) samples have c-MET expression as contrasted to undetectable levels in normal thyroid tissue (11–15). To date, only several PTC cell lines (BHP (16), B-CPAP and TPC-1 (17)) were examined and found to be growth inhibited in vitro by an experimental c-MET inhibitor known as PHA665752.
Based on the foregoing data, we examined the effect of two c-MET inhibitors (Tivantinib and Crizotinib) on growth and pathway signaling of 8 human thyroid cell lines, especially focusing on anaplastic thyroid cancer.
Materials and Methods
Compound
c-MET inhibitors Tivantinib [ActiveBiochem (Maplewood, NJ)], Crizotinib and SU11274 [Selleck Chemical (Houston, TX)] were suspended in DMSO and stored until use in small aliquots at −20°C. Crizotinib used in in vivo experiments was kindly sponsored by Pfizer, Inc. Their molecular structures are showed in Supplementary Fig. S1. Recombinant Human HGF [PeproTech (Rocky Hill, NJ)] was dissolved in sterile PBS (10 μg/ml), and stored in aliquots at −80°C.
Cell lines and culture
Cancer cell lines used in this study, are listed in Table 1. T2 (anaplastic thyroid cancer), TL3 (lymph node metastasis of T2 anaplastic thyroid cancer) were established in our laboratory (manuscript in preparation) at the beginning of 2010; BHP2-7, WRO, T238, C643, Cal-62 and SW1736 were kindly provided by Dr. James A. Fagin (Memorial Sloan-Kettering Cancer Center, New York, NY, USA) at the end of 2009; the c-MET negative (18) melanoma cell line, MDA-MB-435 was provided by Dr. Guy Juillard (University of California Los Angeles); the breast cancer cell line, MDA-MB-231, and the colon cancer cell line, HT29, were obtained from American Type Culture Collection (Manassas, VA). The exact receiving dates of MDA-MB-435, MDA-MB-231 and HT29 are not know. SW1736 cells were maintained in RPMI 1640 supplemented with lx MEM non-essential amino acids (Gibco), the other cell lines were maintained in RPMI 1640. Heat-inactivated fetal bovine serum (10%, v/v; Gemini Bio-Products) was added to all cell cultures. Cells were maintained at 37°C in a humidified chamber of 95% air and 5% CO2. Cancer cells were passaged using 2.5% trypsin-EDTA solution when reaching 95% confluence. Cell counts were determined using a hemocytometer (Allegiance Healthcare), and only cells in the log phase of growth were used for all studies. All cells were verified by short tandem repeat (STR) profiling (UCLA Sequencing & Genotyping Core, Los Angeles, CA).
Table 1.
Cell line information including known mutations
| Name | Type | Reported Mutation | Reference |
|---|---|---|---|
| SW1736 | ATC | BRAF V600E | (26) |
| Cal-62 | ATC | KRAS G12R | (26) |
| T238 | ATC | PIK3CA E542K and BRAF V600E | (26) |
| T2 | ATC | None | 8 |
| TL3 | ATC | P53 C277Y | 8 |
| C643 | ATC | HRAS G13R | (26) |
| BHP2-7 | PTC | RET/PTC rearrangement | (27) |
| WRO | FTC | BRAF WT | (27) |
| MDA-MB-435 | Melanoma | BRAF V600E | (28) |
| MDA-MB-231 | Breast Cancer | BRAF G464V & KRAS G13D | (28) |
| HT29 | Colon Cancer | P53 R273H | (29) |
Our unpublished data. T2 is the primary ATC and TL3 is the lymph node metastasis of T2.
Tissue Samples
Normal thyroid tissue samples were obtained from the National University Hospital-National University of Singapore (NUH-NUS) Tissue Repository with approval of the Institutional Review Board (IRB) of NUH-NUS for research use. Five adjacent non-cancerous thyroid tissues were obtained from surgical specimens and they were used as normal thyroid control tissue. Three papillary thyroid carcinoma tissues from surgical specimens were obtained from Department of Pathology, UCLA Medical Center, Los Angeles and the use was approved by UCLA institutional review board.
Western blotting
Cell lysates were prepared using the lysis buffer [50 mmol/L Tris-HCl (pH 7.4), 150 mmol/L NaCl, 0.5% NP-40] containing both protease and phosphatase inhibitor cocktail (Roche Molecular Biochemicals). Protein lysates (50 μg) were boiled in Laemmli sample buffer (Bio-Rad Laboratories), separated by electrophoresis on precast 4% to 15% SDS-polyacrylamide gels (Bio-Rad), and transferred to polyvinylidene difluoride membranes. Membranes were probed with antibodies from Cell Signaling Technology as well as Santa Cruz Biotechnology, and developed using the enhanced chemiluminescence kit (Pierce). Western blots were stripped between hybridizations with stripping buffer [10 mmol/L Tris-HCl (pH 2.3), 150 mmol/L NaCl]. All antibodies used in this study are listed in Supplementary Table S1.
RNA interference
c-MET siRNA_5 (S100300860) and c-MET siRNA_10 (S102654897) were purchased from Qiagen. The c-MET siRNAs and a control scramble siRNA (Ambion) were transfected into SW1736 cells using Lipofectamine 2000 (Invitrogen) according to the manufacturer’s instructions.
Cellular proliferation assay
For measurement of proliferation, cells were placed into 96-well plates in triplicates and treated with either diluent control (DMSO, 0.1%) or various concentrations of either Tivantinib or Crizotinib (0.03 μM–10 μM). The cells were incubated at 37°C for 72 hours, at which time 10 μl MTT (3-(4,5-dimethylthiazol-2-yl)-2,5-diphenyltetrazolium bromide) (5 mg/mL; Sigma) dissolved in PBS, was added to each well, followed 4 hours later by 100 μl of 20% SDS. The absorbance of the product was measured with an ELISA reader at 540 nm after 16 additional hours. The half maximal inhibitory concentration (IC50) represented the concentration which reduced 50% cellular growth compared to diluent control wells.
Cell cycle analysis and apoptosis assay
For cell cycle analysis, cells were cultured with various concentrations of test compounds for 24 hours, washed, fixed in 70% ethanol, treated with RNase A and exposed to propidium iodide for analysis by flow cytometry. For apoptosis assay, Annexin V-FITC Apoptosis Detection Kit (BD Pharmingen) was used according to the manufacturer’s instructions.
Reverse transcription and quantitative real-time PCR
Total RNA from cultured cells was extracted using RNeasy Mini Kit (Qiagen) and subject to DNA digestion using RNase-Free DNase set (Qiagen); RNA (1μg) was processed directly to cDNA by reverse transcription with iScript cDNA Synthesis Kit (Bio-Rad) following the manufacturer’s instructions. Real-time PCR was performed to evaluate mRNA level of c-MET in thyroid cancer cells and normal tissues using SsoFast EvaGreen Supermix (Bio-Rad). Each sample was tested in triplicates, and GAPDH was used as a control for the target gene. Primers used: c-MET forward: AGTGAAGTGGATGGCTTTGG; c-MET reverse: GGCAGTATTCGGGTTGTAGG; GAPDH forward: GTCAAGGCTGAGAACGGGAA; GAPDH reverse: AAATGAGCCCCAGCCTTCTC.
Murine xenograft model
Female nu/nu athymic mice (5-week-old) were purchased from Vital River Laboratory Animal Technology and maintained in pathogen-free conditions. Both the Crizotinib group and the vehicle (water) group included 5 mice. 1.2 × 10⁷ SW1736 cells in 0.2 ml Matrigel (BD Biosciences) were injected subcutaneously in both hind-flanks of the nude mice. Daily treatment with either 50 mg/kg Crizotinib or vehicle by oral gavage began 10 days after injection when the tumors were established. Tumors were measured with Vernier calipers every 3–4 days, and the volume was calculated using the formula: (length × width × depth) × 0.5236 (19). The animal experiment was performed in accordance with the guideline of Cedars-Sinai Research Institute. Results were expressed as mean tumor volume ± SD. Mice were humanely euthanized on day 50, 4 hours after Crizotinib or vehicle was gavaged. The tumors were dissected, and either fixed in 10% formalin followed by paraffin embedding for immunohistochemisty, or rapidly frozen in liquid nitrogen followed by homogenizing on ice for western blotting.
Immunohistochemistry
Paraffin-embedded tissue sections were deparaffinized and immersed in 3% hydrogen peroxide to eliminate endogenous peroxidase activity. To assess cellular proliferation, primary antibodies to Ki67 were used. Following over-night primary antibody incubation, the sections were rinsed then incubated with a secondary antibody labeled with peroxidase at 37°C for 20 minutes, and colorized with the enzyme substrate 3-amino-9-ethylcarbazole (AEC) (Dako). Following every step, sections were rinsed with 0.01M PBS 3 times for 5 minutes each. Slides were lightly counterstained with hematoxylin. PBS was used to replace the primary antibody to serve as a negative control.
Statistical Analysis
Student’s t-test was used for all the statistical analyses, and significant differences were considered as P < 0.05.
Results
1. Expression of c-MET in thyroid cancer cells
A melanoma control cell line MDA-MB-435 (Fig. 1A) had little detectable c-MET protein by western blotting, while all eight thyroid cancer cell lines, including 1 Follicular Thyroid Carcinoma (FTC) cell line (WRO), 1 PTC cell line (BHP2-7) and 6 ATC cell lines (SW1736, Cal-62, T238, T2, TL3, C643), showed notable expression of the c-MET protein (Fig. 1A), with four of 8 thyroid cancer cell lines (T2, WRO, BHP2-7, T238) having clear constitutively phosphorylated c-MET (Fig. 1A). Each had a dramatic increase of their phosphorylated c-MET receptor after 10 minutes exposure to 20 ng/ml HGF, a c-MET ligand (Fig. 1A). Normal thyroids (5 samples, Fig. 1B) demonstrated no detectable c-MET; and PTC tissues (3 samples, Fig. 1B) showed detectable c-MET expression, which was markedly less than the T2 cell line. Generally, levels of c-MET mRNA in PTC tissues were higher than normal thyroid tissues (Fig. 1C). However, levels of c-MET mRNA in the thyroid cancer cell lines were lower than the normal thyroid tissues and PTC tissues (Fig. 1C), suggesting differences in post-transcriptional control of this tyrosine kinase receptor between the thyroid cancer cell lines and resected thyroid tissue/carcinoma.
Figure 1. Total and phosphorylated (p-) MET expression in thyroid cancer cells and normal thyroid cells.

(A) Western blotting of c-MET and p-MET expression in 8 thyroid cancer cell lines and a control melanoma cell line (MDA-MB-435) ± exposure to c-MET ligand (HGF, 20 ng/ml, 10 minutes). β-actin is the loading control. (B) Western blotting for c-MET expression in 5 normal thyroid samples (N1–N5), 3 PTC samples (C1–C3) and T2 thyroid cancer cell line (positive control). (C) c-MET RNA levels in c-MET negative MDA-MB-435 cells (sample # 1), thyroid cancer cell lines (#s 2–9), normal thyroid tissues (#s 10–14) and PTC tissues (#s 15–17) were measured using real-time PCR. Data are presented as the mean ± SD of triplicate samples.
2. Effect of c-MET inhibitors on cancer cell proliferation
Proliferation of four of 8 thyroid cancer cell lines (SW1736, T2, TL3, BHP2-7) was inhibited by c-MET inhibitors, with an IC50 between 0.1–1 μM for Tivantinib (Fig. 2A) and 2–3.5 μM for Crizotinib (Fig. 2B). The other 4 thyroid cancer cell lines (Cal-62, T238, WRO, C643), as well as the c-MET negative MDA-MB-435 melanoma cells, had minimal response to either Tivantinib or Crizotinib, not reaching an IC50 value even in the presence of the maximal drug dose (10 μM).
Figure 2. Effect of Tivantinib and Crizotinib on cell proliferation.

(A, B) The proliferation rates of thyroid cancer cell lines and MDA-MB-435 (control melanoma cell line) cultured with increasing concentrations of either Tivantinib (A) or Crizotinib (B) as measured by MTT assay (Material and Methods). Results represent the mean ± SD of MTT experiment results performed in triplicates.
The ability of Tivantinib and Crizotinib to inhibit cell growth of two non-thyroid c-MET expressing cell lines (MDA-MB-231, breast cancer; HT29, colon cancer) was also tested. For Tivantinib, the IC50 to inhibit cell proliferation of MDA-MB-231 and HT29 was 0.65 μM and 0.54 μM, respectively (Supplementary Fig. S2A). For Crizotinib, the IC50 for the inhibition of cell proliferation was 2.8 μM for MDA-MB-231 and 2.6 μM for HT29 (Supplementary Fig. S2A).
3. Effect of c-MET inhibitors on cell cycle and apoptosis of human thyroid cancer cells
Three ATC cell lines (SW1736, T2, TL3) that were responsive to the c-MET inhibitors, were analyzed for changes in cell cycle and apoptosis after exposure to increasing doses of either Tivantinib or Crizotinib (0.1–10 μM). Both agents induced a profound dose-dependent cell growth arrest in the G2/M phase for each of the cell lines (Figs. 3A, B). For example, a 24 hour exposure of either Tivantinib (1 μM) or Crizotinib (10 μM) induced a mean G2/M arrest of 57% and 74%, respectively, of the SW1736 cells, compared to 9% for the diluent-treated control cells. Similar dose-response curves were noted for T2 (G2/M: 45%, and 26% cells when treated with either 1 μM Tivantinib or 10 μM Crizotinib, respectively, compared to 3% cells in control dishes) and for TL3 (G2/M 23% and 48% treated with either 1 μM Tivantinib or 10 μM Crizotinib, respectively, compared to 2% of cells receiving diluent control) (Fig. 3B).
Figure 3. Effect of Tivantinib and Crizotinib on cell cycle and apoptosis.

(A) Cell cycle analysis of SW1737, T2, TL3 thyroid cancer cell lines after treatment with increasing concentrations of Tivantinib and Crizotinib (0.1, 1.0, 10 μM, 24 hours). (B) Graphic display of G2/M data shown on Panel A. (C) Apoptosis measurement (% Annexin V positive cells) after these cells were treated with either Tivantinib or Crizotinib (0.1, 1.0, 10 μM, 24 hours). Results expressed as Mean ± SD. *: P < 0.05; **: P < 0.01.
Cell cycle analysis revealed that these inhibitors induced apoptosis (Fig. 3A, sub-G1 cells). To investigate more thoroughly, the cells were analyzed for Annexin V/Propidium Iodide positivity after exposure to either Tivantinib or Crizotinib (0.1, 1.0, and 10 μM, 24 hours) (Fig. 3C). When cultured with 10 μM of either Tivantinib or Crizotinib, apoptosis was respectively: 14% and 15% for SW1736, 21% and 19% for T2, and 20% and 27% for the TL3 thyroid cancer cells. In contrast, apoptosis was 10% (SW1736), 11% (T2), and 10% (TL3) for diluent treated control cells under the same conditions (Fig. 3C).
4. c-MET inhibitors block HGF induced activation of c-MET and its downstream signaling
Two thyroid cancer cell lines (SW1736 and TL3 cells), who were growth inhibited by both c-MET inhibitors, were serum-starved (24 hours) followed by 10 minutes stimulation with 20 ng/ml HGF. p-MET increased dramatically after HGF stimulation in both cells; Tivantinib and Crizotinib (0.1, 1.0, and 10 μM) in a dose-dependent manner inhibited this induced phosphorylation (Fig. 4). Furthermore, phosphorylation of AKT and STAT3 was attenuated in both cells in a dose-dependent manner, mirroring an inactivation of c-MET. Similarly, SU11274 (another ATP-competitive c-MET inhibitor, 10μM) also inhibited p-MET, p-AKT, p-STAT3 in both cells. Phosphorylation of ERK and 4E-BP1 (indicator of the activation of mTOR pathways) was not significantly altered by either inhibitor (Fig. 4). Crizotinib was 10–100 fold more potent than Tivantinib in blocking c-MET phosphorylation (Fig. 4 and Table 2). In contrast, both inhibitors potently decreased levels of p-STAT3 and p-AKT (Fig. 4).
Figure 4. Effect of Crizotinib, Tivantinib and SU11274 on levels of c-MET phosphorylation and downstream signaling pathway in SW1736 and TL3 thyroid cancer cells.
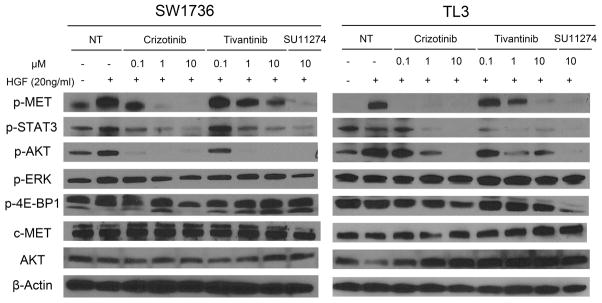
Cells were pre-starved in culture medium containing 0.5% FBS (24 hour) ± either Crizotinib or Tivantinib (0.1, 1.0, 10 μM) or SU11274 (10 μM), and stimulated with 20 ng/ml recombinant human HGF for 10 minutes before lysates were made for western blotting. A series of c-MET downstream signaling pathway proteins and phosphor-proteins were detected using western blotting. β-actin was used as a loading balance control.
Table 2.
Tivantinib and Crizotinib inhibition (IC50) of p-MET and cell growth of cancer cells.
| Tivanitivib | Crizotinib | ||||
|---|---|---|---|---|---|
| p-MET inhibition (IC50) | Growth inhibition (IC50) | p-MET inhibition (IC50) | Growth inhibition (IC50) | ||
| MDA-MB-231 | Report (5, 8) | 0.1–0.3 μM | 0.55 μM | 0.011 μM | NA |
| Test | > 1 μM | 0.65 μM | 0.01–0.1μM | 2.8 μM | |
| HT-29 | Report (5, 8) | 0.1–0.3 μM | 0.49 μM | 0.011 μM | NA |
| Test | > 1 μM | 0.54 μM | 0.01–0.1μM | 2.6 μM | |
| SW1736 | Test | ≈ 1 μM | 0.11 μM | 0. 1–1μM | 2.5 μM |
| TL3 | Test | ≈ 1 μM | 0.33 μM | < 0.1μM | 2.6μM |
Note: IC50 values of p-MET inhibition in our tests were estimated according to the western blotting results. NA: not analyzed.
Tivantinib and Crizotinib also inhibited HGF induced c-MET phosphorylation of MDA-MB-231 and HT29 in a dose-dependent manner (Supplementary Fig. S2B). Crizotinib was nearly 100-fold more potent in preventing phosphorylation of c-MET after HGF stimulation (Supplementary Fig. S2B).
5. Crizotinib markedly decreased growth of SW1736 anaplastic thyroid cancer cell xenografts in vivo
To test if Crizotinib could suppress thyroid cancer cell growth in vivo, nude mice were subcutaneously implanted with SW1736 human anaplastic thyroid tumor cells. 10 days after implantation, mice were given Crizotinib [50 mg/kg or vehicle (water) daily by oral gavage]. The experiment was stopped at day 50, due to the excessive tumor size of the vehicle cohort of mice. Crizotinib markedly suppressed SW1736 cell growth in the xenograft model (Fig. 5A). At the end of the experiment, the mean tumor volume was 2.26 ± 0.72 cm3 in the vehicle group, compared to 1.00 ± 0.36 cm3 in the Crizotinib cohort (55.8% decrease; Fig. 5A). Compared to vehicle treated nude mice, SW1736 cancer cells obtained from Crizotinib treated mice showed less c-MET phosphorylation (Fig. 5B) and Ki67 positivity (arrows, Fig. 5C).
Figure 5. Crizotinib inhibited the growth of SW1736 human anaplastic thyroid tumor xenografts in vivo.

(A) 1.2 × 10⁷ SW1736 cells were injected into both hind-flanks of 10 nu/nu mice. 10 days after injection, either Crizotinib (50 mg/kg, 5 mice) or vehicle (water, 5 mice) were given by oral gavage on a daily basis for 40 days. The volume of 10 tumors of both Crizotinib and vehicle groups were measured every 3–4 days. Results expressed as Mean ± SD. *: P < 0.05; **: P < 0.01. (B) Implanted tumors were dissected from the nu/nu mice 4 hours after drug administration at day 50. c-MET phosphorylation (p-MET) of the SW1736 cells in the tumor tissues were measured using western blotting. (C) Ki67 positivity (arrows) in the dissected tumor tissues was measured using immunohistochemistry.
6. Down-regulation of c-MET in SW1736 did not induce cell cycle arrest or apoptosis
SW1736 thyroid cancer cells were transfected with siRNAs that directly targeted c-MET, and both c-MET protein expression and phosphorylation were suppressed markedly after 48 hours (Fig. 6A). Neither cell cycle arrest nor apoptosis was observed in SW1736 cells at 48 hours after c-MET siRNA transfection (Figs. 6B and C). For example, the percent of cells in the G2/M phase was 8.7%, 9.5%, 8.3% (Fig. 6B), and the apoptosis values were 9.7%, 10.2%, 10.5% (Fig. 6C) after the cells were transfected with either control siRNA, c-MET siRNA_5, or c-MET siRNA_10, respectively, and no statistical significant difference was observed.
Figure 6. Effect of c-MET RNAi on cell cycle and apoptosis of SW1736.

(A) SW1736 cells were transfected with either scramble control siRNA, or siRNAs targeting c-MET (c-MET siRNA_5 or c-MET siRNA_10). Cells were harvested 48 hours after transfection; and c-MET and p-MET levels were measured using western blotting 48 hours after transfection. (B) Cell cycle analysis and (C) Apoptosis analysis of SW1736 cells harvested 48 hours after siRNA transfection.
Discussion
In our study, c-MET protein was predominantly expressed in eight of 8 thyroid cancer cell lines, weakly expressed in 3 PTC tissues and undetectable in 5 normal thyroids and a melanoma cell line (MDA-MB-435) (Figs. 1A and B). The reason that the expression level of c-MET protein is lower in PTC tissue samples than the PTC (and other) cell lines using Western blotting might be as bellow: Cell lines are pure populations of c-MET positive cells, while the resected PTC tissues may contain non-cancerous cells that are c-MET negative, such as cells in the peri-tumoral normal follicle (20), causing the average c-MET level in the tissue to be lower. In parallel with this observation, several reports performed immunoprecipitation to enrich c-MET protein before detecting its expression using Western blotting in PTC tissue samples (11, 21). We did find that levels of c-MET mRNA in PTC tissues were 4–7 folds higher than present in normal thyroids (Fig. 1C), consistent with a previous report, indicating that c-MET mRNA levels were 6.6-fold higher in PTC tissues compared with paired normal thyroid tissues (22). In contrast to the levels of c-MET protein, we noted levels of c-MET mRNA were comparable in all the thyroid cancer cell lines (including a PTC cell line, BHP2-7) and the normal thyroid tissues but notably lower than in the PTC samples (Fig. 1C). Further studies are needed to determine if post-transcriptional regulation of levels of c-MET protein has an important role in thyroid tissues.
Our second observation concerned the anti-proliferative activity of the two c-MET inhibitors: Tivantinib, a non-ATP-competitive inhibitor, and Crizotinib, an ATP-competitive inhibitor. Crizotinib completely inhibited c-MET phosphorylation in SW1736 and TL3 at 1 μM and 0.1 μM (Fig. 4 and Table 2), respectively. Nevertheless, Crizotinib inhibited less than 50% of SW1736 cell growth at 1 μM (Fig. 2B), and less than 20% of TL3 cell growth at 0.1μM (Fig. 2B). The inconsistency between the concentrations required for inhibiting c-MET phosphorylation and those impairing cell proliferation clearly indicates that c-MET was not the sole target of Crizotinib causing a growth inhibition of the thyroid cancer cell growth.
On the other hand, Tivantinib was at least 10-fold less potent than Crizotinib at attenuating phosphorylation of c-MET and AKT (Fig. 4 and Table 2); however, Tivantinib was 5–10 fold more potent than Crizotinib in inhibiting cell growth (Fig. 2 and Table 2), as well as mediating apoptosis and G2/M cell cycle arrest (Fig. 3). Congruent with these biological findings, biochemical analysis showed that Crizotinib and Tivantinib inhibited c-MET with a Ki value of 4 nM (8) and 355 nM (5), respectively. The observation that Tivantinib more potently inhibited growth of SW1736 and TL3 than Crizotinib, but Crizotinib more potently inhibited c-MET activation, indicates that Tivantinib also impaired thyroid cancer cell proliferation in a non-MET-targeting manner.
Two non-thyroidal cancer cell lines (MDA-MB-231 and colon cancer cell HT29) have been tested in previous studies (5, 8) using c-MET inhibitors. In these two cell lines, we again noticed the disassociation between the ability of the drugs (Tivantinib and Crizotinib) to inhibit the c-MET activation and to impair cell growth: 1. Crizotinib did not markedly inhibit cell growth when c-MET phosphorylation was greatly suppressed (Supplementary Fig. S2); 2. Tivantinib showed a more potent capability in suppressing cell growth while it’s a weaker c-MET inhibitor comparing to Crizotinib (Supplementary Fig. S2 and Table 2). Hence, both Tivantinib and Crizotinib potently inhibit thyroid cancer cells, probably in part by non-MET signaling pathways.
To explore further the question of how important c-MET inhibition is as a potential therapeutic target for thyroid cancer cells, we silenced c-MET in thyroid cancer cells (SW1736). Inhibition of c-MET phosphorylation and protein levels of c-MET in SW1736 cells (Fig. 6A) did not produce either notable cell cycle arrest (Fig. 6B) or apoptosis (Fig. 6C). This is further evidence indicating that the non-MET off-target activity of both inhibitors mainly contributed to their observed cytotoxic effects on thyroid cancer cells.
Furthermore, Basilico et al (23) and Katayama et al (24) reported that the cytotoxic activity of Tivantinib against cancer cells is due to perturbating cellular microtubule dynamics. This is consistent with our finding that Tivantinib has unidentified off-target anti-tumor activity independent of c-MET. However, in contrast to prior knowledge (5), both research groups reported that Tivantinib does not suppress c-MET phosphorylation in tumor cells. We find that Tivantinib only weakly suppressed c-MET phosphorylation; this discrepancy between the studies may represent genomic or tissue specific differences between the cancer cells.
Crizotinib was initially reported as a c-MET inhibitor (8). According to its FDA review document (25), Crizotinib showed inhibitory activity in the nM range against 17 kinases (c-MET, Tie2, TrkA, ALK, TrkB, Abl, Yes, Lck, Rse, Axl, Fes, Lyn, Arg, Ros, Ron, Abl, Mer), and produced a 50% cellular inhibitory activity of less than 2.8 μM for 9 kinases (c-MET, Tie2, TrkA, ALK, TrkB, Lck, Axl, Ron, Abl). Although c-MET is not the main functional target of Crizotinib in thyroid cancer cells, it still suppressed thyroid cancer cell growth both in vitro (Figs. 2 and 3) and in vivo (Figs. 6A, B and D), indicating its potential benefit in thyroid cancer therapy, especially anaplastic thyroid cancer therapy.
Crizotinib and Tivantinib are currently in clinical trials (http://www.clinicaltrials.gov; 2013). Our studies suggest that they may have a benefit for therapy of thyroid cancer, probably as a result of their non-MET targeting effect(s). An expanded understanding of these additional signaling pathways may allow monitoring of the tumor cells before and after initiation of treatment to choose the best drug therapy.
Supplementary Material
Acknowledgments
Grant Support
This study was supported by The Cedars-Sinai Thyroid Cancer Program, National Institutes of Health grant 5R01CA026038-33 and the Singapore Ministry of Health’s National Medical Research Council under its Singapore Translational Research (STaR) Investigator Award to H.P. Koeffler, H. and C. Koeffler Funds, China Scholarship Council, and National Natural Science Foundation of China grants 81030033, 30971150 to J. Gu.
We are grateful to Drs. Qi Cao, Dong Yin, Dhong Hyun Lee, Dechen Lin, Daniel Chan, Maya Koren-Michowitz, and Manoj Garg for their helpful discussions.
Footnotes
Conflicts of Interest: The authors disclose no potential conflicts of interest.
References
- 1.Trusolino L, Bertotti A, Comoglio PM. MET signalling: principles and functions in development, organ regeneration and cancer. Nat Rev Mol Cell Biol. 2010;11:834–48. doi: 10.1038/nrm3012. [DOI] [PubMed] [Google Scholar]
- 2.Gherardi E, Birchmeier W, Birchmeier C, Woude GV. Targeting MET in cancer: rationale and progress. Nat Rev Cancer. 2012;12:89–103. doi: 10.1038/nrc3205. [DOI] [PubMed] [Google Scholar]
- 3.Eder JP, Vande Woude GF, Boerner SA, LoRusso PM. Novel therapeutic inhibitors of the c-Met signaling pathway in cancer. Clin Cancer Res. 2009;15:2207–14. doi: 10.1158/1078-0432.CCR-08-1306. [DOI] [PubMed] [Google Scholar]
- 4.Cecchi F, Rabe DC, Bottaro DP. Targeting the HGF/Met signalling pathway in cancer. Eur J Cancer. 2010;46:1260–70. doi: 10.1016/j.ejca.2010.02.028. [DOI] [PMC free article] [PubMed] [Google Scholar]
- 5.Munshi N, Jeay S, Li Y, Chen CR, France DS, Ashwell MA, et al. ARQ 197, a novel and selective inhibitor of the human c-Met receptor tyrosine kinase with antitumor activity. Mol Cancer Ther. 2010;9:1544–53. doi: 10.1158/1535-7163.MCT-09-1173. [DOI] [PubMed] [Google Scholar]
- 6.Yap TA, Olmos D, Brunetto AT, Tunariu N, Barriuso J, Riisnaes R, et al. Phase I trial of a selective c-MET inhibitor ARQ 197 incorporating proof of mechanism pharmacodynamic studies. J Clin Oncol. 2011;29:1271–9. doi: 10.1200/JCO.2010.31.0367. [DOI] [PubMed] [Google Scholar]
- 7.Rosen LS, Senzer N, Mekhail T, Ganapathi R, Chai F, Savage RE, et al. A phase I dose-escalation study of Tivantinib (ARQ 197) in adult patients with metastatic solid tumors. Clin Cancer Res. 2011;17:7754–64. doi: 10.1158/1078-0432.CCR-11-1002. [DOI] [PubMed] [Google Scholar]
- 8.Zou HY, Li Q, Lee JH, Arango ME, McDonnell SR, Yamazaki S, et al. An orally available small-molecule inhibitor of c-Met, PF-2341066, exhibits cytoreductive antitumor efficacy through antiproliferative and antiangiogenic mechanisms. Cancer Res. 2007;67:4408–17. doi: 10.1158/0008-5472.CAN-06-4443. [DOI] [PubMed] [Google Scholar]
- 9.FDA New Release - FDA approves Xalkori with companion diagnostic for a type of late-stage [web site on the Internet] U.S. Food and Drug Administration; 2013. released 2011 Aug 26; cited 2013 Sept 21. Available from: http://www.fda.gov/NewsEvents/Newsroom/PressAnnouncements/ucm269856.htm. [Google Scholar]
- 10.Smallridge RC, Copland JA. Anaplastic thyroid carcinoma: pathogenesis and emerging therapies. Clin Oncol (R Coll Radiol) 22:486–97. doi: 10.1016/j.clon.2010.03.013. [DOI] [PMC free article] [PubMed] [Google Scholar]
- 11.Mineo R, Costantino A, Frasca F, Sciacca L, Russo S, Vigneri R, et al. Activation of the hepatocyte growth factor (HGF)-Met system in papillary thyroid cancer: biological effects of HGF in thyroid cancer cells depend on Met expression levels. Endocrinology. 2004;145:4355–65. doi: 10.1210/en.2003-1762. [DOI] [PubMed] [Google Scholar]
- 12.Bergstrom JD, Hermansson A, Diaz de Stahl T, Heldin NE. Non-autocrine, constitutive activation of Met in human anaplastic thyroid carcinoma cells in culture. Br J Cancer. 1999;80:650–6. doi: 10.1038/sj.bjc.6690406. [DOI] [PMC free article] [PubMed] [Google Scholar]
- 13.Trovato M, Villari D, Bartolone L, Spinella S, Simone A, Violi MA, et al. Expression of the hepatocyte growth factor and c-met in normal thyroid, non-neoplastic, and neoplastic nodules. Thyroid. 1998;8:125–31. doi: 10.1089/thy.1998.8.125. [DOI] [PubMed] [Google Scholar]
- 14.Di Renzo MF, Olivero M, Serini G, Orlandi F, Pilotti S, Belfiore A, et al. Overexpression of the c-MET/HGF receptor in human thyroid carcinomas derived from the follicular epithelium. J Endocrinol Invest. 1995;18:134–9. doi: 10.1007/BF03349722. [DOI] [PubMed] [Google Scholar]
- 15.Ruco LP, Ranalli T, Marzullo A, Bianco P, Prat M, Comoglio PM, et al. Expression of Met protein in thyroid tumours. J Pathol. 1996;180:266–70. doi: 10.1002/(SICI)1096-9896(199611)180:3<266::AID-PATH658>3.0.CO;2-Q. [DOI] [PubMed] [Google Scholar]
- 16.Chattopadhyay C, El-Naggar AK, Williams MD, Clayman GL. Small molecule c-MET inhibitor PHA665752: effect on cell growth and motility in papillary thyroid carcinoma. Head Neck. 2008;30:991–1000. doi: 10.1002/hed.20816. [DOI] [PubMed] [Google Scholar]
- 17.Bu R, Uddin S, Ahmed M, Hussain AR, Alsobhi S, Amin T, et al. c-Met inhibitor synergizes with tumor necrosis factor-related apoptosis-induced ligand to induce papillary thyroid carcinoma cell death. Mol Med. 2012;18:167–77. doi: 10.2119/molmed.2011.00238. [DOI] [PMC free article] [PubMed] [Google Scholar]
- 18.Meric F, Lee WP, Sahin A, Zhang H, Kung HJ, Hung MC. Expression profile of tyrosine kinases in breast cancer. Clin Cancer Res. 2002;8:361–7. [PubMed] [Google Scholar]
- 19.Luong QT, O’Kelly J, Braunstein GD, Hershman JM, Koeffler HP. Antitumor activity of suberoylanilide hydroxamic acid against thyroid cancer cell lines in vitro and in vivo. Clin Cancer Res. 2006;12:5570–7. doi: 10.1158/1078-0432.CCR-06-0367. [DOI] [PubMed] [Google Scholar]
- 20.Zanetti A, Stoppacciaro A, Marzullo A, Ciabatta M, Fazioli F, Prat M, et al. Expression of Met protein and urokinase-type plasminogen activator receptor (uPA-R) in papillary carcinoma of the thyroid. J Pathol. 1998;186:287–91. doi: 10.1002/(SICI)1096-9896(199811)186:3<287::AID-PATH175>3.0.CO;2-X. [DOI] [PubMed] [Google Scholar]
- 21.Scarpino S, Cancellario d’Alena F, Di Napoli A, Pasquini A, Marzullo A, Ruco LP. Increased expression of Met protein is associated with up-regulation of hypoxia inducible factor-1 (HIF-1) in tumour cells in papillary carcinoma of the thyroid. J Pathol. 2004;202:352–8. doi: 10.1002/path.1522. [DOI] [PubMed] [Google Scholar]
- 22.Huang Y, Prasad M, Lemon WJ, Hampel H, Wright FA, Kornacker K, et al. Gene expression in papillary thyroid carcinoma reveals highly consistent profiles. Proc Natl Acad Sci U S A. 2001;98:15044–9. doi: 10.1073/pnas.251547398. [DOI] [PMC free article] [PubMed] [Google Scholar]
- 23.Basilico C, Pennacchietti S, Vigna E, Chiriaco C, Arena S, Bardelli A, et al. Tivantinib (ARQ197) displays cytotoxic activity that is independent of its ability to bind MET. Clin Cancer Res. 2013;19:2381–92. doi: 10.1158/1078-0432.CCR-12-3459. [DOI] [PubMed] [Google Scholar]
- 24.Katayama R, Aoyama A, Yamori T, Qi J, Oh-Hara T, Song Y, et al. Cytotoxic Activity of Tivantinib (ARQ 197) Is Not Due Solely to c-MET Inhibition. Cancer Res. 2013;73:3087–96. doi: 10.1158/0008-5472.CAN-12-3256. [DOI] [PMC free article] [PubMed] [Google Scholar]
- 25.FDA Pharmacology Review — Crizotinib [web site on the Internet] U.S. Food and Drug Administration; 2013. cited 2013 Sept 21. Available from: http://www.accessdata.fda.gov/drugsatfda_docs/nda/2011/202570Orig1s000PharmR.pdf. [Google Scholar]
- 26.Ricarte-Filho JC, Ryder M, Chitale DA, Rivera M, Heguy A, Ladanyi M, et al. Mutational profile of advanced primary and metastatic radioactive iodine-refractory thyroid cancers reveals distinct pathogenetic roles for BRAF, PIK3CA, and AKT1. Cancer Res. 2009;69:4885–93. doi: 10.1158/0008-5472.CAN-09-0727. [DOI] [PMC free article] [PubMed] [Google Scholar]
- 27.Schweppe RE, Klopper JP, Korch C, Pugazhenthi U, Benezra M, Knauf JA, et al. Deoxyribonucleic acid profiling analysis of 40 human thyroid cancer cell lines reveals cross-contamination resulting in cell line redundancy and misidentification. J Clin Endocrinol Metab. 2008;93:4331–41. doi: 10.1210/jc.2008-1102. [DOI] [PMC free article] [PubMed] [Google Scholar]
- 28.Hollestelle A, Elstrodt F, Nagel JH, Kallemeijn WW, Schutte M. Phosphatidylinositol-3-OH kinase or RAS pathway mutations in human breast cancer cell lines. Mol Cancer Res. 2007;5:195–201. doi: 10.1158/1541-7786.MCR-06-0263. [DOI] [PubMed] [Google Scholar]
- 29.Rodrigues NR, Rowan A, Smith ME, Kerr IB, Bodmer WF, Gannon JV, et al. p53 mutations in colorectal cancer. Proc Natl Acad Sci U S A. 1990;87:7555–9. doi: 10.1073/pnas.87.19.7555. [DOI] [PMC free article] [PubMed] [Google Scholar]
Associated Data
This section collects any data citations, data availability statements, or supplementary materials included in this article.