

Abstract
This study examined the molecular mechanism of action of anti-mitotic drugs. The hypothesis was tested that death in mitosis occurs through sustained mitotic arrest with robust Cdk1 signaling causing complete phosphorylation of Mcl-1 and Bcl-xL, and conversely, that mitotic slippage is associated with incomplete phosphorylation of Mcl-1/Bcl-xL. The results, obtained from studying six different cancer cell lines, strongly support the hypothesis and identify for the first time a unique molecular signature for mitotic death. The findings represent an important advance in understanding anti-mitotic drug action and provide insight into cancer cell susceptibility to such drugs which has important clinical implications.
Keywords: Bcl-2 proteins, apoptosis, cancer cell lines, mitotic arrest, mitotic death, phosphorylation
1. Introduction
Bcl-2 proteins play a key role in the regulation of apoptosis [1; 2; 3]. The BH3-only pro-apoptotic members act as essential initiators of intrinsic apoptosis, whereas the multidomain pro-apoptotic Bax and Bak act as essential mediators of mitochondrial membrane permeability. The actions of the pro-apoptotic Bcl-2 proteins are antagonized by the anti-apoptotic, or pro-survival, members of the Bcl-2 family, which includes Bcl-2, Bcl-xL, Mcl-1, and several others, through selective protein-protein interactions [2]. Bcl-2 proteins in general act as critical recipients for and sensors of apoptotic signals, and changes in their subcellular location, post-translational modifications and abundance control the delicate interplay between cell survival and cell death.
Previously we have presented evidence that phospho-regulation of anti-apoptotic Bcl-2 proteins by Cdk1/cyclin B1 plays a key role in the regulation of cell fate after mitotic arrest [4]. We showed that after Taxol treatment, slippage-resistant HT29 colon carcinoma cells died in mitosis coincident with robust Cdk1 activity and extensive Mcl-1/Bcl-xL phosphorylation. In contrast, slippage-prone DLD-1 colon carcinoma cells displayed weak Cdk1 activity and partial and transient Mcl-1/Bcl-xL phosphorylation and died in subsequent interphase or survived. The results suggested that inactivation of anti-apoptotic Bcl-2 proteins via Cdk1-mediated phosphorylation may represent a mitotic death signature. However, this conclusion was based on examining two colon carcinoma cell lines which differed in fate after mitotic arrest. In this study, we sought to test the generality of these observations by determining whether Mcl-1/Bcl-xL phosphorylation was associated with mitotic death after Taxol treatment in several other cancer cell lines. In addition to colon carcinoma cell lines we examined KB3 cervical carcinoma, SKOV-3 ovarian, and two prostate cancer cell lines, DU-145 and LnCap, as Taxanes are an important class of drugs used clinically to treat these types of cancers [5; 6]. The results show that death in mitosis is tightly associated with Mcl-1/Bcl-xL phosphorylation and thus identify for the first time a molecular signature for mitotic death.
2. Materials and methods
2.1. Materials
Antibody against cyclin B1 (sc-245) was purchased from Santa Cruz (Santa Cruz, CA); antibodies against Bcl-xL (2762), poly (ADP-ribose) polymerase (PARP) (9532) and GAPDH (2118) were purchased from Cell Signaling Technology (Beverly, MA); Annexin V conjugated to phycoerythrin (PE) was purchased from Pharmingen (San Diego, CA); antibody against mitotic protein monoclonal 2 (MPM-2) (05-368) was purchased from Millipore (Temecula, CA); and antibody against Mcl-1 (ADI-AAP-240) was purchased from Enzo Life Sciences (Farmingdale, NY). Taxol (paclitaxel) was purchased from Sigma (St. Louis, MO), PI/RNAse staining buffer from BD Biosciences (San Jose, CA), and RO-3306 was purchased from Axxora (San Diego, CA).
2.2. Cell culture
Colon carcinoma cell lines HT29 and DLD-1, which stably express GFP-tagged histone H2B, and HeLa subline, KB3 cells, were maintained in Dulbecco’s modified Eagle’s medium supplemented with 10% bovine growth serum, 2 mM L-glutamine, 50 units/mL penicillin and 50 units/mL streptomycin at 37°C under 5% CO2. Selection for GFP-tagged histone H2B in DLD-1 and HT29 cells was maintained with puromycin at 0.5 μg/mL (HT29) or 2 μg/mL (DLD-1). Prostate cancer (DU-145, LnCap) and ovarian cancer (SKOV-3) cell lines were maintained in RPMI media with 5% or 10% fetal bovine serum (FBS), respectively. Additionally, 2 mM L-glutamine, 50 units/mL penicillin and 50 units/mL streptomycin was added and cells were maintained at 37°C under 5% CO2. Cell synchronization was done by double thymidine block as described previously [7].
2.3. Immunoblotting
Whole cell extracts were prepared by washing harvested cells with ice-cold PBS and suspending pellets in lysis buffer (40 mM HEPES, pH 7.5, 120 mM NaCl, 1% Triton X-100, 1 mM EDTA, 20 μg/mL aprotinin, 50 μg/mL leupeptin, 10 μM pepstatin, 1 mM phenylmethylsulfonyl fluoride, 20 mM β-glycerophosphate, 50 mM NaF, 1 mM Na3VO4, and 1 μM okadaic acid) for 1 h with occasional mixing. Insoluble material was removed by centrifugation (15 min at 15,000 × g), and the supernatant was retained as the whole cell extract. Protein concentration was determined using the Bio-Rad protein assay and analyzed by SDS-PAGE and immunoblotting as described [8].
2.4. Cell cycle analysis
Cell cycle analysis was performed using propidium iodide (PI) staining and flow cytometry according to the manufacturer’s instructions (BD Pharmingen) at the UAMS Flow Cytometry Core Facility using a FACSCalibur (Becton Dickinson, Mountain View, CA). The data were analyzed using the ModFit DNA analysis program (Verity Software House).
2.5. Cell death assays
Phycoerythrin-annexin V staining for early apoptotic cells was performed according to the manufacturer’s instructions (BD Biosciences). Cell death was also determined by measuring membrane integrity by permeability of cells to fluorescein isothiocyanate (FITC)-annexin V/propidium iodide (PI). For analysis of cell phase, propidium iodide staining was done according to manufacturer’s instructions (BD Pharmingen). All flow cytometric analyses were performed at the UAMS Flow Cytometry Core Facility.
3. Results
3.1. Establishing parameters that define mitotic death
We have previously shown that when treated with Taxol, HT29 cells undergo primarily apoptotic death in mitosis, which we refer to as mitotic death, based on the pattern of nuclear condensation and fragmentation, the coincidence of mitotic markers (cyclin B1 expression, MPM2 immunoreactivity), and cell death markers including PARP cleavage [4]. Under conditions of mitotic death, robust Bcl-xL phosphorylation and Mcl-1 phosphorylation/degradation was observed [4]. In this study, we sought to determine whether phospho-regulation of anti-apoptotic Bcl-2 proteins represented a molecular signature for mitotic death. Our approach for defining mitotic death involved a combination of cell cycle analysis by propidium iodide staining and flow cytometry, together with immunoblotting for mitotic and cell death markers. The principle was first illustrated with HT29 cells since they display almost uniformly mitotic death in response to Taxol [4] (Fig. 1). HT29 cells were treated with Taxol for periods up to 48 h, and DNA content was examined by propidium iodide staining and flow cytometry, with the histograms shown in Fig. 1A and quantitation of the data in Fig. 1B. Untreated cells had DNA content reflecting distribution in G1, S, or G2 and/or M phases as expected. After 24 h of Taxol treatment, there was a large increase in cells with 4N DNA content as well as cells with sub-G1 DNA content. After 48 h of treatment, the majority of cells had sub-G1 DNA content. Note that if a cell undergoes DNA fragmentation after arresting in M phase, its DNA content will decrease incrementally and appear in the flow cytometric analysis at positions corresponding to S and G1 phases before appearing as sub-G1 DNA. Thus a cell undergoing mitotic death with partially degraded DNA cannot be distinguished from an S or G1 phase cell. In order to avoid such ambiguities, cells with strictly sub-G1 content were included in the quantification of Fig. 1B, and as such may represent an underestimation of cells with fragmented DNA. An independent measure of cell death, using PE-Annexin V staining, was performed to support the data derived from analysis of sub-G1 DNA. Annexin V measures externalization of membrane phospholipids, an early event in apoptosis. This is also shown in Fig. 1B (% cell death) and similar levels as seen with sub-G1 DNA analysis were observed.
Figure 1.

HT29 colon carcinoma cells undergo mitotic arrest and mitotic death after treatment with Taxol. (A) Flow cytometric analysis for cell cycle distribution of HT29 cells treated or untreated with 100 nM Taxol is shown. (B) Tabulation of data from flow cytometric analysis showing the proportion of cells with 4N DNA or sub G1 DNA content. An independent measure of cell death, PE-Annexin V staining for was also performed and is shown on the right portion of the table for cells untreated or treated with Taxol. (C) Immunoblots were performed with MPM-2 antibody or for the proteins indicated. GAPDH was used as a loading control.
Overall, the HT29 data of Fig. 1A, B are consistent with Taxol inducing mitotic arrest and subsequent apoptosis. However, if a mitotically arrested cell undergoes mitotic slippage, defined as mitotic exit without division, its DNA content will remain 4N until the cell dies or undergoes DNA re-replication. Thus the appearance of a Taxol-treated cell with 4N DNA content and subsequent sub-G1 DNA content does not necessarily reflect a cell dying in mitosis, but may represent a cell undergoing mitotic slippage and non-mitotic death. Because flow cytometric analysis alone cannot properly assess the mode of cell death after Taxol treatment, additional parameters are needed to establish that death occurred in mitosis. For this purpose, whole cell extracts were prepared and subjected to immunoblotting with MPM-2 antibody, which specifically recognizes several mitotic phosphoproteins, and for cyclin B1, which is elevated in G2 and M phases. As shown in Fig. 1C, in HT29 cells Taxol induced strong MPM-2 immunoreactivity and high levels of cyclin B1 expression seen from 16–32 h. In addition, Taxol promoted PARP cleavage beginning at 16 h. The fact that PARP cleavage occurs in tandem with robust expression of the two mitotic markers infers the occurrence of mitotic death and establishes that the flow cytometric data (Fig. 1A) reflect mitotic arrest and death rather than the alternate possibility of slippage and death. Thus examination of DNA content by flow cytometry and analysis of mitotic and death markers by immunoblotting together allow the mode of death to be established. Immunoblotting for Mcl-1 and Bcl-xL indicated that in HT29 cells, Taxol induced phosphorylation and degradation of Mcl-1 to undetectable levels and robust phosphorylation of Bcl-xL. To test whether these events represented a mitotic death signature, additional cell lines were next examined.
3.2. Demonstration of the generality of the mitotic death signature
The effects of Taxol and subsequent cell fate are to some degree concentration-dependent and individual cell lines differ in Taxol sensitivity. In order to compare different cell lines and to eliminate this concern, it was necessary to normalize the Taxol concentration. This was done by using a Taxol concentration equivalent to 20 × IC50 value, based on published values [9]. Having examined HT29 cells first as a model for mitotic death, we next examined KB-3 cells (a subline of HeLa cervical carcinoma), SKOV-3 ovarian carcinoma cells, and DU-145 and LnCap prostate carcinoma cells. Each were treated with Taxol and subjected to DNA content analysis, an additional cell death assay, and examination of mitotic markers and PARP cleavage by immunoblotting. These data are presented in Fig. 2A, B and C. All four cell lines, with only some minor differences, were similar to HT29, with cells arresting with G2/M DNA content after 24 h and a subsequent increase in sub-G1 DNA content at 24–48 h of treatment (A and B panels of each figure). The coincidence of PARP cleavage and expression of mitotic markers (cyclin B1 expression, MPM2 immunoreactivity) confirmed that all four cell lines undergo primarily mitotic death (C panels of each figure). Further, in each case Taxol induced phosphorylation and profound loss of expression of Mcl-1 and complete or near complete phosphorylation of Bcl-xL. To confirm that these events represented elements of a mitotic death signature, DLD-1 cells, which we previously showed undergo largely non-mitotic death after Taxol treatment, were examined [4]. As shown in Fig. 3, despite the high relative concentration of Taxol and apparent G2/M arrest after 24 h of treatment (Fig. 3A), cyclin B1 expression and MPM2 staining were weak and transient, and PARP cleaved more completely after the mitotic markers were undetectable. In concert, Mcl-1 expression levels were maintained to a much greater extent than observed under conditions of mitotic death, and Bcl-xL was only partially phosphorylated (Fig. 3C) hence indicating that these cells undergo mitotic slippage and non-mitotic death.
Figure 2.

KB3, SKOV-3, DU-145 and LnCap cells undergo mitotic arrest and mitotic death after treatment with Taxol. (A) Flow cytometric analysis for cell cycle distribution of the indicated cell lines treated or untreated with 100 nM Taxol is shown. KB3 cells were treated with 100 nM Taxol whereas SKOV-3, DU-145 and LnCap cells were treated with 200 nM Taxol (all doses normalized to 20X IC50 values). (B) Tabulation of data from flow cytometric analysis showing the proportion of cells with 4N DNA or sub G1 DNA content. An independent measure of cell death (total Propidium Iodide (PI) staining for KB3, Annexin V/PI staining for SKOV-3 and DU-145 and Trypan blue positive count for LnCap cells) was also performed and is shown on the right portion of the table for cells untreated or treated with Taxol. (C) Immunoblots were performed with MPM-2 antibody or for the proteins indicated. GAPDH was used as a loading control.
Figure 3.

DLD-1 cells do not undergo death in mitosis when treated with 1 μM Taxol. (A) Flow cytometric analysis for cell cycle distribution of DLD-1 cells untreated or treated for 24 h or 48 h with 1 μM Taxol is shown. (B) Tabulation of data from flow cytometric analysis showing the proportion of cells with 4N DNA or sub G1 DNA content. An independent measure of cell death using Annexin-PE staining was also performed and is shown on the right portion of the table for cells untreated or treated with 1 μM Taxol. (C) Immunoblots were performed with MPM-2 antibody or for the proteins indicated. GAPDH was used as a loading control.
3.3. Enforcing slippage via Cdk1 inhibition promotes non-mitotic death and lack of mitotic death signature
Our previous work has shown that the inactivation of anti-apoptotic Bcl-2 proteins by phosphorylation is mediated by the prolonged activity of Cdk1/cyclin B1 [4]. To further test the hypothesis that mitotic death was associated with Cdk-1 mediated Mcl-1/Bcl-xL phosphorylation, we reasoned that inhibition of Cdk1 during mitotic arrest would inhibit or reverse of Mcl-1/Bcl-xL phosphorylation in concert with mitotic slippage and induction of non-mitotic death. Thus KB3 cells were synchronized with a double thymidine block, treated with 100 nM Taxol for 10 h, at which point they were in M phase [7], and then further treated with the Cdk1 inhibitor RO-3306 [10] for 14 h (24h after Taxol treatment). This schedule ensured that the Cdk1 inhibitor was added at the beginning of M phase arrest, as earlier addition would preclude entry into M phase. As shown in Fig. 4, in the presence of the Cdk1 inhibitor, we observed protection from inactivation of the anti-apoptotic Bcl-2 proteins. Thus Mcl-1 levels were preserved when compared to Taxol alone and Bcl-xL was dephosphorylated which protects its function [8]. Concomitant loss of MPM-2 staining and decreased cyclin B1 expression in the presence of RO-3306 confirmed that the Cdk1 inhibitor induced mitotic slippage as predicted. Co-treatment with Taxol and RO-3306 induced a greater extent of cell death than Taxol alone as indicated by PARP cleavage and propidium iodide staining (Fig. 4), suggesting that mitotic slippage can act as a trigger for death, as has been demonstrated previously [11]. These results indicate that cells undergoing cell death after mitotic slippage do so in the absence of inactivation of anti-apoptotic Bcl-2 proteins, further supporting the hypothesis that phosphorylation and inactivation of anti-apoptotic Bcl-2 proteins is specific to mitotic arrest initiated apoptosis.
Figure 4.
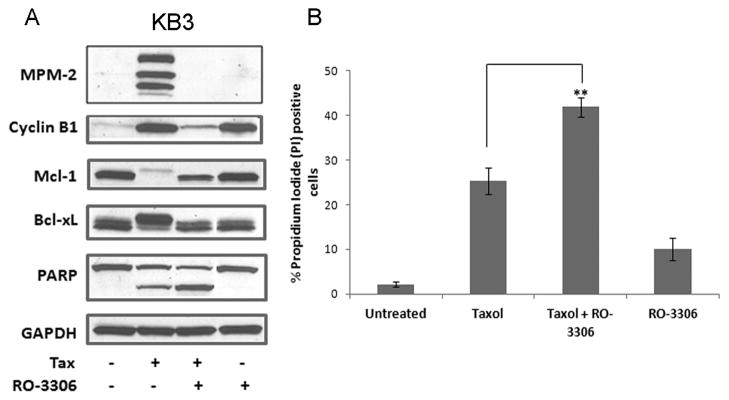
Inhibition of Cdk1/cyclin B1 during mitotic arrest prevents phosphorylation-dependent inactivation of Mcl-1 and Bcl-xL. (A) KB3 cells were synchronized by a double thymidine block and then untreated or treated with 100 nM Taxol for 10 h. RO-3306 (10 μM) was then added for an additional 14 h and cells harvested at 24 h post Taxol treatment. Immunoblots were performed with MPM-2 antibody or for the proteins indicated. GAPDH was used as a loading control. (B) KB3 cells were synchronized with double thymidine block and then treated or untreated with 100 nM Taxol for 10h followed by addition of 10 μM RO-3306 for a further 14 h. Cell death was analyzed by propidium iodide staining. Data shown as mean ± SD (n=3). ** = p < 0.05 (Student’s t test).
3.4. Cisplatin-induced cell death fails to provoke the mitotic death signature
DNA damaging agents most typically activate checkpoints in S and G2 phases of the cell cycle rather than the spindle assembly checkpoint and thus characteristically promote death outside of mitosis [12]. To further verify that Mcl-1/Bcl-xL phosphorylations are elements of a mitotic death signature, DLD-1 and HT29 cell lines were treated with cisplatin and subjected to the same series of analyses. Propidium iodide staining and flow cytometry showed a trend toward decreased 4N DNA content after 24 and 48 h of treatment and an increase in sub-G1 DNA which was more extensive for HT29 cells than for DLD-1 cells (Fig. 5A, B). Cisplatin strongly induced cell death as indicated by complete PARP cleavage at 72 h for both cell lines (Fig. 5C). Cisplatin increased cyclin B1 expression in both cell lines but no signal was detected with MPM2 antibody although both mitotic markers were observed with Taxol treatment as a positive control (Fig. 5C). The increase in cyclin B1 expression and absence of MPM2 staining, together with the lack of G2/M arrest observed by flow cytometry, is compatible with cisplatin causing S phase arrest, the cell cycle phase where cyclin B1 levels begin to increase [13]. Together, these data demonstrate that cisplatin induces non-mitotic death. Importantly, cisplatin failed to induce phosphorylation of either Mcl-1 or Bcl-xL; neither protein underwent the characteristic mobility shift observed after Taxol treatment (Fig. 5C). However, both proteins decreased in expression with time of cisplatin treatment approximately in parallel with PARP cleavage, and decreased expression may be a consequence of apoptosis induction. In contrast to Mcl-1 degradation in response to Taxol which appears to be triggered by phosphorylation, it is clear that reduced expression of Mcl-1 in response to cisplatin involves a phosphorylation-independent mechanism. Finally, whereas Bcl-xL levels are stable after Taxol treatment, they diminish markedly in response to cisplatin treatment, and emphasize again that distinct mechanisms are operating with regard to Bcl-2 proteins during mitotic versus non-mitotic death.
Figure 5.

Lack of signature in DLD-1 and HT29 cells undergoing non-mitotic death in response to the DNA damaging agent, cisplatin. (A) Flow cytometric analysis for cell cycle distribution in cells untreated or treated for 24 h or 48 h with 50 μM cisplatin is shown. (B) Tabulation of data from flow cytometric analysis showing the proportion of cells with 4N DNA or sub G1 DNA content. (C) DLD-1 and HT29 cells were untreated or treated with 50 μM cisplatin for 24 h or 24 h. Immunoblots were performed with MPM-2 antibody or for the proteins indicated. GAPDH was used as a loading control.
4. Discussion
Based on findings from one cell line, HT29, which died in mitosis when treated with Taxol, we previously suggested that mitotic death may entail unique and specific molecular events culminating in phosphorylation and inactivation of anti-apoptotic Bcl-2 proteins [4]. However, because these events might be cell type-specific rather than of general significance, we examined in this study many additional cell lines. Furthermore, to strengthen the hypothesis, we compared data obtained with Taxol to that with the DNA-damaging agent cisplatin, which induces non-mitotic death. The data presented here clearly establish for the first time a mitotic death signature involving actual (Mcl-1) or functional (Bcl-xL) loss of anti-apoptotic Bcl-2 protein function via phosphorylation. This conclusion was based on analysis of the mode of cell death in several cancer cell lines treated with Taxol or cisplatin. Although not directly examined in this study as several cell lines lacked detectable expression, Bcl-2 also undergoes phosphorylation and inactivation in response to mitotic inhibitors [7]. The results are summarized in Table 1, and show that these events are closely associated with mitotic death and are not observed in the context of non-mitotic deathThe occurrence of these events across multiple types of cancer cell lines and in response to different mitotic inhibitors [14] strongly suggests that a highly conserved pathway, designed to eliminate anti-apoptotic Bcl-2 function during prolonged mitotic arrest, is responsible. Extensive phosphorylation of anti-apoptotic Bcl-2 proteins is only observed during mitosis and mitotic arrest and does not appear to be associated with cell death occurring at other phases of the cell cycle. Because of the highly compact and inaccessible nature of chromatin during mitosis, many regulatory processes are achieved through protein phosphorylation and degradation [15]. Our study reveals that the same applies to death in mitosis, where elimination of anti-apoptotic Bcl-2 function via phosphorylation/degradation provides an attractive solution to the problem of death induction in cells where transcription is strongly repressed. DNA damage-induced interphase death typically involves transcriptional upregulation of pro-apoptotic Bcl-2 proteins which acts to overwhelm anti-apoptotic Bcl-2 proteins [16; 17].
Table 1.
Generality of the mitotic death signature across multiple cancer cell lines.
| Cell lines | Drug | Death in Mitosis | Persistent/High cyclin B1 expression | Complete Bcl-xL phosphorylation | Mcl-1 phosphorylation and degradation | |
|---|---|---|---|---|---|---|
| Cervical cancer | KB3 | Taxol | YES | ✓ | ✓ | ✓ |
| Ovarian carcinoma | SKOV-3 | Taxol | YES | ✓ | ✓ | ✓ |
| Prostate cancer | DU-145 | Taxol | YES | ✓ | ✓ | ✓ |
| LnCap | Taxol | YES | ✓ | ✓ | ✓ | |
| Colon carcinoma | HT29 | Taxol | YES | ✓ | ✓ | ✓ |
| DLD-1 | Taxol | NO | ✘ | ✘ | ✘ | |
| HT29 | Cisplatin | NO | ✘ | ✘ | ✘ | |
| DLD-1 | Cisplatin | NO | ✘ | ✘ | ✘ |
The fate of cells after mitotic slippage appears to be context-dependent and varies depending on the cell type, type of anti-mitotic drug, and perhaps other factors such as the specific assays utilized and the precise scheduling of drug additions. We observed for example that inducing slippage with RO-3306 in Taxol-treated mitotically arrested HT29 cells protected against Taxol-induced death at early time-points [4], whereas RO-3306-induced slippage increased the extent of death by Taxol in KB3 cells (Fig. 4). Similarly, in a study of nocodazole-treated HeLa cells, it was found that slippage protected the immediate apoptosis triggered by mitotic arrest but promoted apoptosis occurring later in interphase [18]. Thus there appears to exist a complex system that is both cell type- and time-dependent that regulates the generation of post-slippage death signals. These considerations raise the important question of what constitutes the desired outcome after spindle disruption. Because the possibility of survival following slippage exists under certain circumstances, it seems reasonable to argue that mitotic death is the preferred outcome of anti-mitotic drug therapy. This in turn raises the question of whether mitotic death is a clinically relevant mechanism of tumor cell death following anti-mitotic drug treatment. A recent review made a strong case that microtubule inhibitors such as taxanes likely exert their toxicity in the clinical setting by inhibiting interphase rather than mitotic microtubule function[6]. The evidence includes the slow doubling time of human tumors and the correspondingly low mitotic index, and the poor activity in clinical trials of agents which specifically target proteins involved in mitosis versus the established efficacy of microtubule inhibitors [6]. This view has been challenged on the basis that knowledge of the molecular mechanisms of new antimitotic drugs in the context of human tumors is lacking [19], and emphasizes the need to establish well-defined markers or signatures for the different outcomes. Examination of the fate and mode of death of cells treated with anti-mitotic drugs by observing nuclear fluorescence by time-lapse microscopy is extremely time consuming and cannot be readily adapted to clinical samples. The results presented here define a molecular signature for mitotic death, and the development of methods to assess the presence or absence of such a signature in the clinical setting will provide an opportunity to more clearly define the mode of action of microtubule inhibitors and anti-mitotic drugs in vivo.
Acknowledgments
This work was supported by NIH Grant CA-109821. We thank Martin Cannon for providing SKOV-3 ovarian carcinoma cells and Masahiro Higuchi for providing DU-145 and LnCap prostate cancer cell lines.
Footnotes
Conflict of Interest
The authors declare no conflict of interest.
Publisher's Disclaimer: This is a PDF file of an unedited manuscript that has been accepted for publication. As a service to our customers we are providing this early version of the manuscript. The manuscript will undergo copyediting, typesetting, and review of the resulting proof before it is published in its final citable form. Please note that during the production process errors may be discovered which could affect the content, and all legal disclaimers that apply to the journal pertain.
References
- 1.Youle RJ, Strasser A. The BCL-2 protein family: opposing activities that mediate cell death. Nat Rev Mol Cell Biol. 2008;9:47–59. doi: 10.1038/nrm2308. [DOI] [PubMed] [Google Scholar]
- 2.Letai AG. Diagnosing and exploiting cancer’s addiction to blocks in apoptosis. Nat Rev Cancer. 2008;8:121–132. doi: 10.1038/nrc2297. [DOI] [PubMed] [Google Scholar]
- 3.Chipuk JE, Moldoveanu T, Llambi F, Parsons MJ, Green DR. The BCL-2 family reunion. Mol Cell. 2010;37:299–310. doi: 10.1016/j.molcel.2010.01.025. [DOI] [PMC free article] [PubMed] [Google Scholar]
- 4.Sakurikar N, Eichhorn JM, Chambers TC. Cyclin-dependent kinase-1 (Cdk1)/cyclin B1 dictates cell fate after mitotic arrest via phosphoregulation of antiapoptotic Bcl-2 proteins. The Journal of biological chemistry. 2012;287:39193–39204. doi: 10.1074/jbc.M112.391854. [DOI] [PMC free article] [PubMed] [Google Scholar]
- 5.Jordan MA, Wilson L. Microtubules as a target for anticancer drugs. Nat Rev Cancer. 2004;4:253–265. doi: 10.1038/nrc1317. [DOI] [PubMed] [Google Scholar]
- 6.Komlodi-Pasztor E, Sackett DL, Fojo AT. Inhibitors targeting mitosis: tales of how great drugs against a promising target were brought down by a flawed rationale. Clinical cancer research: an official journal of the American Association for Cancer Research. 2012;18:51–63. doi: 10.1158/1078-0432.CCR-11-0999. [DOI] [PubMed] [Google Scholar]
- 7.Terrano DT, Upreti M, Chambers TC. Cyclin-dependent kinase 1-mediated Bcl-xL/Bcl-2 phosphorylation acts as a functional link coupling mitotic arrest and apoptosis. Mol Cell Biol. 2010;30:640–656. doi: 10.1128/MCB.00882-09. [DOI] [PMC free article] [PubMed] [Google Scholar]
- 8.Upreti M, Galitovskaya EN, Chu R, Tackett AJ, Terrano DT, Granell S, Chambers TC. Identification of the major phosphorylation site in Bcl-xL induced by microtubule inhibitors and analysis of its functional significance. J Biol Chem. 2008;283:35517–35525. doi: 10.1074/jbc.M805019200. [DOI] [PMC free article] [PubMed] [Google Scholar]
- 9.NCI-60 DTP Human Tumor Cell Line Screen. National Cancer Institute Developmental Therapeutics Program. 2002 [Google Scholar]
- 10.Vassilev LT, Tovar C, Chen S, Knezevic D, Zhao X, Sun H, Heimbrook DC, Chen L. Selective small-molecule inhibitor reveals critical mitotic functions of human CDK1. Proc Natl Acad Sci U S A. 2006;103:10660–10665. doi: 10.1073/pnas.0600447103. [DOI] [PMC free article] [PubMed] [Google Scholar]
- 11.Tao W, South VJ, Zhang Y, Davide JP, Farrell L, Kohl NE, Sepp-Lorenzino L, Lobell RB. Induction of apoptosis by an inhibitor of the mitotic kinesin KSP requires both activation of the spindle assembly checkpoint and mitotic slippage. Cancer Cell. 2005;8:49–59. doi: 10.1016/j.ccr.2005.06.003. [DOI] [PubMed] [Google Scholar]
- 12.Sperka T, Wang J, Rudolph KL. DNA damage checkpoints in stem cells, ageing and cancer. Nat Rev Mol Cell Biol. 2012;13:579–590. doi: 10.1038/nrm3420. [DOI] [PubMed] [Google Scholar]
- 13.Smits VA, Medema RH. Checking out the G(2)/M transition. Biochimica et biophysica acta. 2001;1519:1–12. doi: 10.1016/s0167-4781(01)00204-4. [DOI] [PubMed] [Google Scholar]
- 14.Du L, Lyle CS, Chambers TC. Characterization of vinblastine-induced Bcl-xL and Bcl-2 phosphorylation: evidence for a novel protein kinase and a coordinated phosphorylation/dephosphorylation cycle associated with apoptosis induction. Oncogene. 2005;24:107–117. doi: 10.1038/sj.onc.1208189. [DOI] [PubMed] [Google Scholar]
- 15.Sullivan M, Morgan DO. Finishing mitosis, one step at a time. Nat Rev Mol Cell Biol. 2007;8:894–903. doi: 10.1038/nrm2276. [DOI] [PubMed] [Google Scholar]
- 16.Tsuruya K, Yotsueda H, Ikeda H, Taniguchi M, Masutani K, Hayashida H, Hirakata H, Iida M. Involvement of p53-transactivated Puma in cisplatin-induced renal tubular cell death. Life sciences. 2008;83:550–556. doi: 10.1016/j.lfs.2008.08.002. [DOI] [PubMed] [Google Scholar]
- 17.Sheridan C, Brumatti G, Elgendy M, Brunet M, Martin SJ. An ERK-dependent pathway to Noxa expression regulates apoptosis by platinum-based chemotherapeutic drugs. Oncogene. 2010;29:6428–6441. doi: 10.1038/onc.2010.380. [DOI] [PubMed] [Google Scholar]
- 18.Chan YW, Ma HT, Wong W, Ho CC, On KF, Poon RY. CDK1 inhibitors antagonize the immediate apoptosis triggered by spindle disruption but promote apoptosis following the subsequent rereplication and abnormal mitosis. Cell cycle. 2008;7:1449–1461. doi: 10.4161/cc.7.10.5880. [DOI] [PubMed] [Google Scholar]
- 19.Kitagawa K. Too early to say, “no targeting of mitosis!”. Nature reviews. Clinical oncology. 2011;8:444. doi: 10.1038/nrclinonc.2010.228-c1. author reply 444. [DOI] [PubMed] [Google Scholar]