Abstract
A universal process in experimental biology is the use of engineered cells; more often, stably or transiently transfected cells are generated for the purpose. Therefore, it is important that cell health assessment is conducted to check for stress mediated by induction of heat shock proteins (Hsps). For this purpose, we have developed an integrated platform that would enable a direct assessment of transfection efficiency (TE) combined with cellular toxicity and stress response. We make use of automated microscopy and high content analysis to extract from the same well a multiplexed readout to assess and determine optimal chemical transfection conditions. As a proof of concept, we investigated seven commercial reagents, in a matrix of dose and time, to study transfection of an EGFP DNA plasmid into HeLa cells and their consequences on health and fitness; where we scored for cellular proliferation, EGFP positive cells, and induction of Hsp10 and Hsp70 as makers of stress responses. FuGENE HD emerged as the most optimal reagent with no apparent side effects suitable for performing microtiter based miniaturized transfection for both chemical and RNAi screening. In summary, we report on a high content assay method to assess cellular overall fitness upon chemical transfection.
Keywords: chemical transfection, HCA, HCS, Hsp10, Hsp70, cell stress, INCA2000, INCA6000
INTRODUCTION
The introduction of exogenous DNA or RNA into a cell is a fundamental tool in biomolecular research. The main applications of this technique consist in the expression of exogenous proteins and/or gene silencing. The two most common approaches for inserting DNA or RNA into a cell involve either the use of a viral vector (transduction) or a non-viral vector (transfection). Viral vectors are relatively more efficient but because of several drawbacks such as immunogenicity [1], inflammation [1] and low efficiency of processing for shRNA [2, 3]; thus, non viral vectors constitute a viable alternative. Transfection overcomes the limitations of viral vectors and is relatively simple and cheap. Transfection can be accomplished using two most common methods; either the application of an electrical current (electroporation) or the use of chemical reagents (chemical transfection). Electroporation exerts cytotoxic effects on the cells, requires specialized equipment and is not easily amenable to large scale experiments. Chemical transfection is therefore more popular, however optimization of conditions is essential to achieve high levels of TE combined with low toxicity. Researchers usually follow general guidelines from manufacturers when designing conditions for transfection experiments, but for optimal results the volume of reagent needs to be optimized on a case by case basis. In absence of optimization, toxicity may be observed and to date it is unclear whether transfection itself induces toxicity to the cells, and if the toxicity of transfection depends on the nature of the nucleic acid transfected. Despite the widespread use of chemical transfection and the vast amount of studies relying on this technology, these questions are largely overlooked.
Few systematic comparative studies of different chemical transfection reagents investigating the side effects of chemical transfection have been published and none of them takes advantage of direct, multiplexed readouts from the same well. To quantify cytotoxicity, most previous studies rely on low content cell viability assays based on MTT [1], Alamar Blue [4], ATP quantification [5], and SYTOXdye exclusion [6]. In addition to constituting indirect readouts that may overlook toxicity if the signal is saturated [7], these viability assays have other drawbacks that limit their use. MTT assay requires a laborious step of DMSO solubilization of MTT-formazan generated by cellular reduction of the MTT reagent, and high variability results based on exposure time with MTT reagent. A limitation of ATP quantification is a large variability in results as ATP levels greatly vary in cells. In addition, cell lysis is required, which limits the use of this method as an end point measurement [7]. With SYTOX, a nuclear dye that penetrates and labels cells with compromised plasma membranes, dying cells may still retain their membrane integrity for a substantial period of time after cell injury; as a result, depending on the time of readout, this method is prone to false-negative results [8, 9]. For evaluation of TE, previous comparative studies mostly relied on flow cytometry post-transfection of an EGFP-encoding DNA plasmid [5, 6, 10] or on luciferase activity post-transfection of a luciferase-encoding DNA plasmid [1, 11, 12]. For studies relying on the use of Fluorescence Activated Cell Sorting (FACS), this approach has the disadvantage that adherent cells need to be trypsinized prior to analysis, therefore limiting the throughput of such studies and not being amenable to multiplexing with non-flow cytometry-based readouts. Studies relying on measuring luciferase activity record the average signal of a cell population, an indirect and inaccurate approach to calculate the TE since it cannot output the percentage of transfected cells. In one study, automated imaging and image analysis post-transfection of an EGFP-encoding DNA-based plasmid was employed to measure TE [4]; but surprisingly the authors did not take advantage of high content analysis to overlay nuclei count and EGFP expression and rather reported total EGFP signal intensity for the well, defeating the purpose of using microscopy that enables cell-by-cell analysis.
To date, no comparative study of transfection conditions was conducted using multiplexed readouts to measure cell proliferation and percentage of transfected cells from the same well. In addition, cell stress induced by chemical transfection has been completely overlooked by researchers in previous studies looking to optimize transfection conditions. For this reason, we sought to develop a platform that would allow to rapidly identify the best transfection conditions for a given cell line using a systematic approach. In this study, we present the results of the systematic profiling of a panel of seven different commercially available transfection reagents tested at multiple concentrations and at three different time points post transfection using our newly developed approach.
MATERIALS AND METHODS
Reagents
The following commercially available transfection reagents were obtained from their respective manufacturers: TransIT-LT1 (Mirus Bio, Madison, WI), X-tremeGENE 9 (Roche Applied Science, Penzberg, Germany), FuGENE 6 and FuGENE HD (Promega, Madison, WI), Lipofectamine LTX and Lipofectamine RNAiMAX (Life Technologies, Carlsbad, CA), and DharmaFECT 1 (Thermo Scientific, Waltham, MA). Phosphate-buffered saline without Mg2+ and Ca2+ (PBS), Hoechst 33342 nuclear stain and Opti-MEM reduced serum media were purchased from Life Technologies. Triton X-100, Tween 20 were purchased from Sigma-Aldrich (Saint Louis, MO). Paraformaldehyde (PFA) was obtained from Electron Microscopy Sciences (Hatfield, PA). The EGFPDNA plasmid pEF6-EGFP was a kind gift of Dr. Andrea Ventura (Cancer Biology & Genetics Program, Memorial Sloan-Kettering Cancer Center). The scrambled siRNA Silencer Select Negative Control #1 was purchased from Ambion (Cat. #4390844, Life Technologies).
Tissue culture
HeLa human epithelial adenocarcinoma cells were cultured as previously described [13] in Dulbecco’s modified Eagle’s medium (DMEM) (Life Technologies) supplemented with 10% fetal bovine serum (FBS) (PAA, GE Healthcare Bio-Sciences, Piscataway, NJ) and 1 mM glutamine (Life Technologies) but in absence of antibiotics.
Multiplexed assay for optimization of transfection conditions
HeLa cells were seeded in 384-well microtiter plates (Cat. #3985, Corning, NY) at a seeding density of 1,000 cells per well in 40 μL antibiotic-free media and incubated in the automated temperature controlled Steri-Cult incubator (Thermo Scientific) in a humidified atmosphere at 37°C, 5% CO2. Cells were seeded in multiple plates per time point allowing for multiple immunostaining procedures. After 24 hours, cells were transfected with the EGFPDNA plasmid pEF6-EGFP, scrambled siRNA duplex or treated with transfection reagent only as a control. Seven transfection reagents were tested at three dilutions each ranging from 0.025 to 0.1 μL per well, and according to recommendations from the manufacturer (Table 1). Each condition was tested in quadruplicate and reported nuclei count and TE data corresponds to the average of quadruplicate wells ± standard deviation. Following incubation in the Steri-Cult for 24, 48 or 72 hours post-transfection, cells were fixed and stained using an automated plate washer for aspirations (BioTek, Winooski, VT) and using the automated dispenser Multidrop for liquid dispensing (Thermo Scientific). Plates were fixed with 4% PFA (v/v) for 20 minutes, washed twice with PBS, and nuclei were stained at the same time as cells were permeabilized with a solution of 10 μM Hoechst 33342 and 0.05% Tween 20(v/v) in PBS for 10 minutes.
Table 1.
Summary of the seven chemical transfection reagents used in this study.
Guidelines from the respective manufacturer are summarized for each reagent including the recommended amount based on volume to mass ratio or on well surface area, extrapolated to 384-well microtiter plate format. For each reagent, the tested range was within the recommended range.
| Transfection reagent volume | |||||||
|---|---|---|---|---|---|---|---|
| 96-well format | 384-well format | ||||||
| Recommended | Extrapolated | Tested | |||||
| Transfection reagent | Provider | Formulation | Recommended for DNA/siRNA | Based on volume:mass ratio (μL/μg DNA or siRNA) | Based on well surface area (μL) | For 20 ng DNA (μL) | |
| TransIT-LT1 | Mirus Bio | Non-liposomal lipid | DNA | 2:1 to 8:1 | - | 0.04 to 0.16 | 0.025 to 0.1 |
| X-tremeGENE 9 | Roche | Lipids and other | DNA/siRNA | 3:1 to 5:1 | - | 0.06 to 0.3 | |
| FuGENE 6 | Promega | Non-liposomal lipid | DNA | 1.5:1 to 6:1 | - | 0.03 to 0.12 | |
| FuGENE HD | Promega | Non-liposomal lipid | DNA | 1.5:1 to 4:1 | - | 0.03 to 0.08 | |
| Lipofectamine LTX | Invitrogen | Cationic lipid | DNA | 1:1 to 6:1 | - | 0.02 to 0.12 | |
| Lipofectamine RNAiMAX | Invitrogen | Cationic lipid | DNA/siRNA | - | 0.1 to 0.3 | 0.025 to 0.075 | |
| DharmaFECT 1 | Thermo-Scientific | Cationic lipid | siRNA | - | 0.05 to 0.5 | 0.01 to 0.1 | |
Cell transfection
Dilutions of transfection reagents in Opti-MEM reduced serum media with or without EGFP DNA plasmid or scrambled siRNA duplex were prepared in 96-well microtiter plates (Cat. #3357, Thermo Scientific) and incubated at room temperature for 15 minutes to allow for complex formation. Transfer of 10 μL complex to the assay plates was conducted by quadrant using a custom designed 384 head on a PP-384-M Personal Pipettor (Apricot Designs, Monrovia, CA) to create four replicates for each condition on the same plate. The final concentration in EGFPDNA plasmid was 0.33 ng/μL and the final concentration in scrambled siRNA duplex was 100nM. Results were confirmed in an independent experiment.
Heat shock protein (Hsp) immunostaining and actin staining
Following fixation and permeabilization, cells were blocked with a solution of 10% FBS (v/v) in PBS for 1 hour at room temperature. Following aspiration, 30 μL of a solution of primary antibody directed toward either human Hsp10 (Cat. #sc-376313, Santa Cruz Biotechnology, Santa Cruz, CA) or Hsp70 (Cat. #sc-271215, Santa Cruz Biotechnology) in 1% FBS (v/v) in PBS was added to the corresponding wells for 1 hour at room temperature. The primary antibody concentration was 2 μg/mL (1:100 stock dilution) for both Hsp10 and Hsp70, according to prior optimization. After two washes in PBS, 30 μL of a solution of AF633-conjugated goat anti-mouse IgG secondary antibody (Cat. #A-21052, Life Technologies) was added for 1 hour at room temperature. After two washes in PBS, 40 μL of a 1:100 dilution of rhodamine-phalloidin (Cat. #R415, Life Technologies) in PBS was added for 30 minutes at room temperature. Following two washes in PBS, 50 μL PBS was added to the wells and plates were sealed for imaging.
Automated image acquisition and analysis
For nuclei count and TE readouts, whole well images were acquired using the IN Cell Analyzer 2000 (INCA2000) automated epifluorescence microscope (GE Healthcare, Piscataway, NJ) at 4X magnification (0.20 NA). Automated image analysis was conducted with the IN Cell Developer 1.9 software (GE Healthcare) using custom-developed analysis protocols. For cell segmentation and nuclei count readout images were acquired in the DAPI channel using 350/50 nm excitation and 455/50 nm emission filters with a 0.1 second exposure time. The custom protocol developed for nuclei count readout identifies nuclei based on object segmentation and data is reported as the sum of nuclei count for the whole well. In addition, for the TE readout, images were acquired in the FITC channel using 490/20 nm excitation and 525/36 nm emission filters with a 0.5 second exposure time. The custom protocol developed for the transfection readout segments EGFP objects on the FITC channel and counts EGFP object that overlap with nuclei segmented on the DAPI channel. Data is reported as the sum of EGFP positive cell for the whole well as well as the total number of cells (sum of all nuclei) to calculate the TE (percentage of cells expressing EGFP).
For quantification of stress induction and assessment of cell morphology, four fields per well were imaged using the IN Cell Analyzer 6000 (INCA6000) automated laser-based imaging platform with confocal modality (GE Healthcare) at 40X magnification (0.60 NA). Automated image analysis was conducted with the IN Cell Developer 1.9 software (GE Healthcare) using custom-developed analysis protocols. For cell segmentation and nuclei count, images were acquired in the DAPI channel at405 nm excitation and 455/50 nm emission filters with a 0.1 second exposure time. The custom protocol developed for nuclei count readout identifies nuclei based on object segmentation and data is reported as the sum of nuclei count for all imaged fields. For visualization of EGFP expressing cells, images were acquired in the FITC channel at 488 nm excitation and 524/48 nm emission filters with a 0.3 second exposure time. For assessment of cell morphology, images of actin stained with rhodamine-phalloidin were acquired in the dsRed channel at 561 nm excitation and 605/52 nm emission filters with a 0.2 second exposure time. For visualization and quantification of stress induction, images of Hsp10 and Hsp70 immunostained with an AF633-conjugated secondary antibody were acquired in the Cy5 channel at 642 nm excitation and 682/60 nm emission filters with a 0.5 second exposure time. Object-based segmentation on the Cy5 channel was used to identify areas of Hsp expression and the sum of Hsp immunostaining fluorescence intensity for all segmented objects and for all fields was normalized by the nuclei count to report an average per-cell value. Qualitative assessment of cell morphology was conducted by visual inspection to confirm induction of cell stress.
RESULTS
Automated imaging platform for the study of cellular transfection conditions
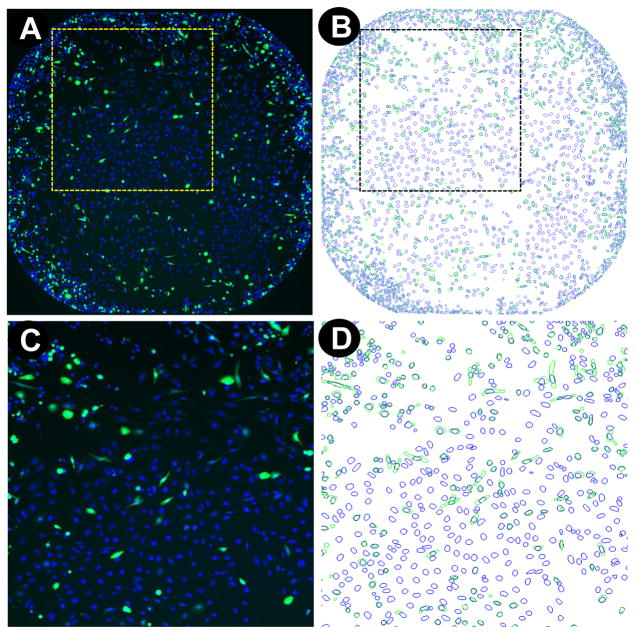
Multiple transfection reagents are commercially available to the research community from various suppliers, along with guidelines for recommended amounts (Table 1). However, optimal conditions may vary between cell types and the process of transfection itself may induce cell toxicity. For this reason, we sought to develop a platform that would allow to systematically, rapidly and accurately identify optimal transfection conditions for a given cell line. To develop such a platform, we turned to automated microscopy and high content image analysis. Microscopy offers the ability to multiplex readouts within the same well and to perform cell by cell analysis, leading to improved accuracy compared to measuring an average response in separate experiments [7]. For this reason, we took advantage of automated microscopy to assess in parallel TE as well as any potential toxicity induced by the transfection process. Our strategy consists of transfecting HeLa cells, as a model system for validating the approach, with a DNA plasmid encoding for EGFP, and testing in parallel a panel of transfection reagentsthrough performing multiplexed readout as a function of time over three days following transfection. Whole well imaging at 4X objective magnification was used to measure cell proliferation and TE in the same well as follows: Hoechst staining of nuclei post-cell fixation enables the identification of cells and allows to count the total number of cells to measure cell proliferation. In addition, the number of EGFP expressing cells relative to the total number of cells allows to calculate TE as the percentage of EGFP expressing cells for the whole well (Table 2, Fig. 1), a more accurate measure of TE than the total fluorescence intensity which is prone to artifacts such as fluorescent cell debris and skewed data due to a few bright cells. To maximize data accuracy, we chose whole well imaging to yield the TE and cell proliferation readouts, since the heterogeneous cell distribution may lead to incorrect outputs if imaged fields do not cover a significant surface of the well (Fig. 1A). Whole well imaging ensures that even cells clustering to the edges of the well can accurately be quantified by automated image analysis (Fig. 1B). Moreover, high content analysis allows to dismiss fluorescent artifacts or cell debris when quantifying TE, as only objects segmented on the FITC channel that overlap with objects segmented on the DAPI channel are used to calculate the percentage of EGFP expressing cells (Fig. 1C&D).
Table 2.
Summary of the multiplexed microscopy based assay readouts.
Readouts employed in this study to evaluate cell proliferation, TE, Hsp10 and Hsp70 induction and cell morphology from the same well. Whole well imaging at 4X objective magnification was conducted for the nuclei count TE readouts. Four fields per well covering about 10% of the well were imaged at 40X objective magnification to quantify cell stress as measured by Hsp10 and Hsp70 induction and to evaluate cell morphology by actin staining.
| Channel | Fluorophore | Quantification | Readout | Objective magnification | 384-well coverage |
|---|---|---|---|---|---|
| DAPI | Hoechst | Nuclei count | Cell proliferation | 4X/40X | Whole well/10% |
| FITC | GFP | % GFP expressing cells | Transfection efficiency | 4X/40X | Whole well/10% |
| Cy5 | Anti-Hsp/AF633 | Intensity per cell | Hsp10/70 induction | 40X | 10% |
| DsRed | Phalloidin-rhodamine | N/A | Cell morphology | 40X | 10% |
Figure 1. Whole well imaging on the INCA2000, quantification of cellular proliferation, and TE.
(A) Whole well images are captured at 4X objective magnification on the DAPI and FITC channel for (B) Automated image analysis and quantification of Hoechst-stained nuclei (blue mask overlay) and EGFP expression (green mask overlay). Accurate quantification of the number of EGFP expressing cells relative to the total number of cells for assessment of TE is achieved by quantifying EGFP objects that overlap with a nucleus (C&D) to dismiss fluorescent artifacts and cell debris.
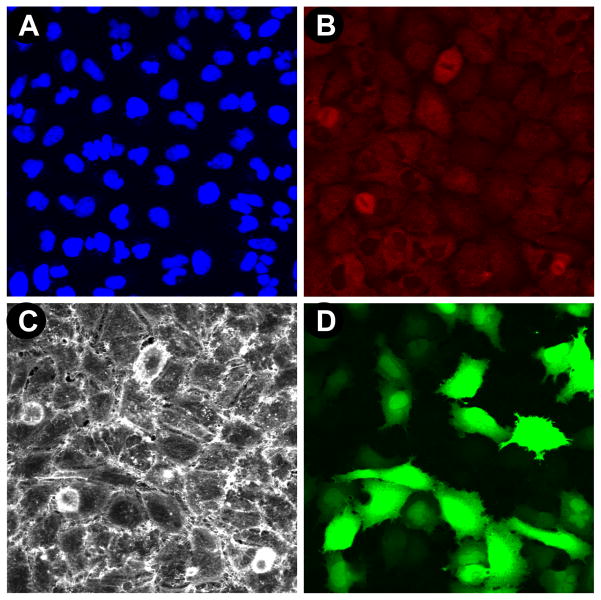
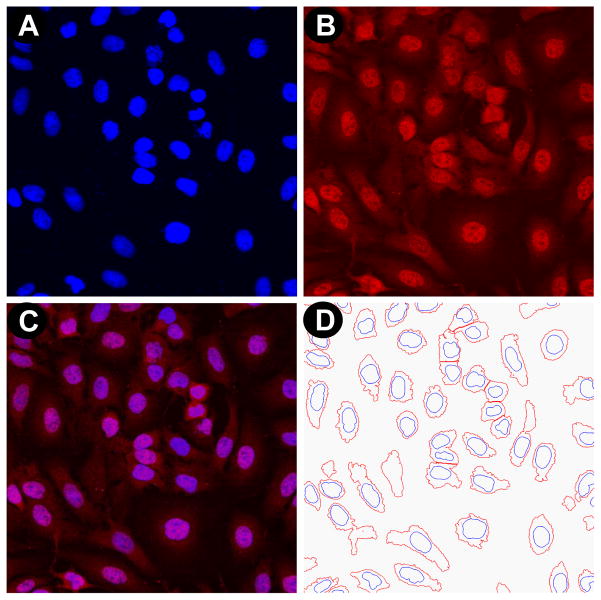
While previous comparative studies of transfection conditions usually measured the effect of chemical transfection on cell viability, the induction of cell stress has been completely overlooked. For this reason we sought to include induction of cell stress and cell morphology in our multiplexed readout, and this was achieved by immunostaining, automated 40X objective magnification imaging and quantification of Hsp10 or Hsp70 induction, as well as the qualitative assessment of cell morphology by staining actin (Table 2, Fig. 2). Importantly, the same wells were used for quantification of cell proliferation, TE and for measuring induction of cell stress, ensuring consistency between different readouts. For each well and for each condition, a four-channel 40X magnification image results from our multiplexed readout, consisting in Hoechst stained nuclei (Fig. 2A), Hsp10 or Hsp70 immunostaining (Fig. 2B), phalloidin staining of actin (Fig. 2C) and EGFP expression following transfection with the EGFPDNA plasmid (Fig. 2D). The resulting fused image allows for simultaneous evaluation of cell proliferation, TE, stress induction, and overall morphological changes (Fig. 2E). For quantification of Hsp induction, 40X images were analyzed using a custom-developed algorithm relying on the DAPI and Cy5 channels (Table 2). Hoechst stained nuclei are used to identify cells and to count the total number of cells (Fig. 3A), and Hsp expression is imaged following immunostaining (Fig. 3B). Masks identifying Hsp expression and nuclei (Fig. 3C) are used to quantify Hsp induction as the sum of intensity of Hsp immunostaining per cell (Fig. 3D).
Figure 2. Four channel imaging at 40X objective magnification on the INCA6000 microscope.
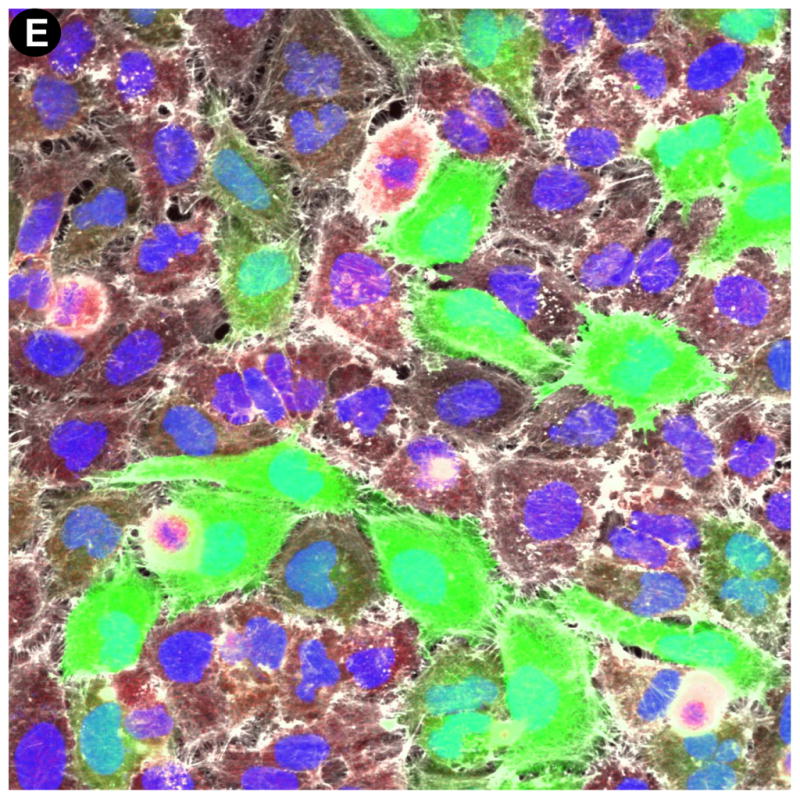
Automated laser-based imaging platform with confocal modality at 40X objective magnification of (A) Hoechst-stained nuclei, (B) anti-Hsp70/AF633 immunostaining of Hsp70, (C) Rhodamine-phalloidin staining of actin, and (D) EGFP expression.(E) Assessment of cell morphology on the fused images from A, B, C, and D; enabling visualization and potential quantification of cell stress as measured by Hsp induction levels.
Figure 3. Automated image analysis for quantification of Hsp10 induction.
(A) Hoechst-stained nuclei and (B) anti-Hsp10/AF633 immunostaining of Hsp10 are imaged on the INCA6000 automated laser-based imaging platform with confocal modality at 40X objective magnification. (C) The two fused images allow to quantify by (D) automated image analysis the sum of Hsp10 immunostaining intensity per cell for the four imaged fields per well. Under our experimental conditions, Hsp10 localization is predominantly nuclear.
Assessment of cell proliferation and TE
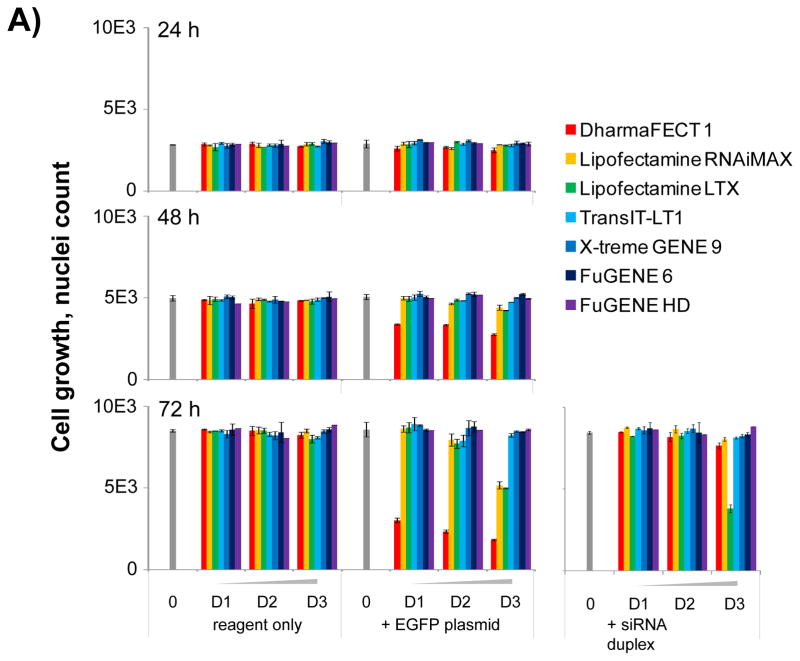
To evaluate our approach, we constituted a panel of seven transfection reagents from five different suppliers, that we tested in parallel at three different concentrations within their respective recommended range for the transfection of an EGFP DNA plasmid (Table 1). Testing our panel of transfection reagents in parallel using our high content analysis platform revealed that different reagents had different effects on cellular proliferation. As expected, most reagents did not prevent cell proliferation; however, dose-dependent and time-dependent antiproliferative effect were observed for three reagents: DharmaFECT 1, Lipofectamine RNAiMAX (RNAiMAX) and Lipofectamine LTX (LTX) (Fig. 4A). For RNAiMAX (Fig. 4B) and LTX, a significant decrease in cell proliferation was only observed at the highest concentration tested of 0.1 μL per well. For DharmaFECT 1, cell proliferation was drastically inhibited compared to control across all tested concentrations (Fig. 4A&5A). Of note, the antiproliferative effect was only observed when transfection reagents were combined with the EGFPDNA plasmid and not for reagent only control wells (Fig. 4A&5A). This result indicates that the observed toxicity is the result of cell transfection with the DNA-based plasmid rather than toxicity of the reagent themselves. DharmaFECT1 being intended for the transfection of siRNA duplexes rather than DNA (Table 1), this may explain the strong antiproliferative effect observed in combination with the EGFP DNA plasmid. As a control, we tested in parallel the transfection of a scrambled siRNA duplex and found that as opposed to the DNA plasmid, DharmaFECT 1 in combination with the scrambled siRNA duplex did not induce any significant antiproliferative effects. This observation tends to confirm that DharmaFECT 1 is cytotoxic when used to transfect DNA and should not be used. Only LTX, at the highest concentration tested, prevented the proliferation of HeLa cells in combination with the scrambled siRNA duplex (Fig. 4A).
Figure 4. Cellular proliferation assessment in the presence or absence of seven transfection reagents.
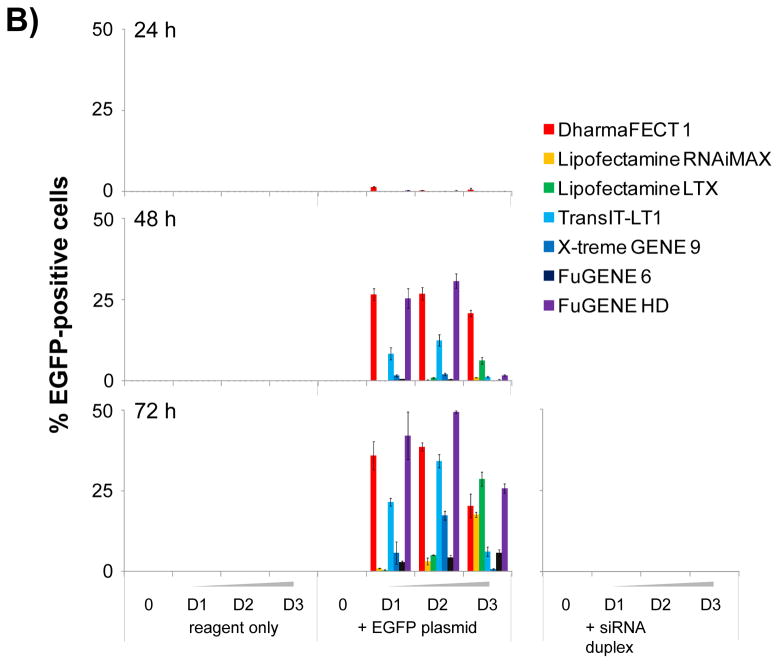
(A) Bar graph summary of the quantification of cellular proliferationbased on whole well imaging of Hoechst-stained nuclei and automated image analysis. Seven commercially available chemical transfection reagents are tested at 3 dilutions D1, D2 and D3 corresponding respectively to 0.025, 0.05 and 0.1 μL per well compared to control wells in absence of transfection reagent. Cell proliferation is measured at 24, 48 and 72 hours post transfectionwith chemical transfection reagent only and in combination with the EGFP DNA plasmid or scrambled siRNA duplex. (B) Bar graph summary of the quantification of TE based on whole well imaging and automated image analysis of Hoechst-stained nuclei and EGFP expression. TE is calculated as the percentage of EGFP-expressing cells as determined by the total count of EGFP masks overlapping with a Hoechst-stained nucleus mask compared to the total count of Hoechst-stained nuclei masks. Seven commercially available chemical transfection reagents are tested at 3 dilutions D1, D2 and D3 corresponding respectively to 0.025, 0.05 and 0.1 μL per well compared to control wells in absence of transfection reagent. TE is measured at 24, 48 and 72 hours post transfection with chemical transfection reagent only and in combination with the EGFP DNA plasmid or scrambled siRNA duplex.
Figure 5. Whole well TE assessment of five transfection reagents.
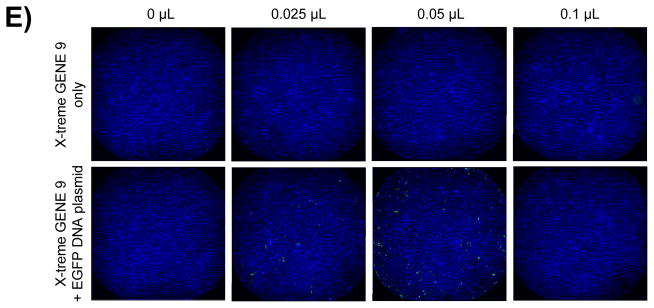
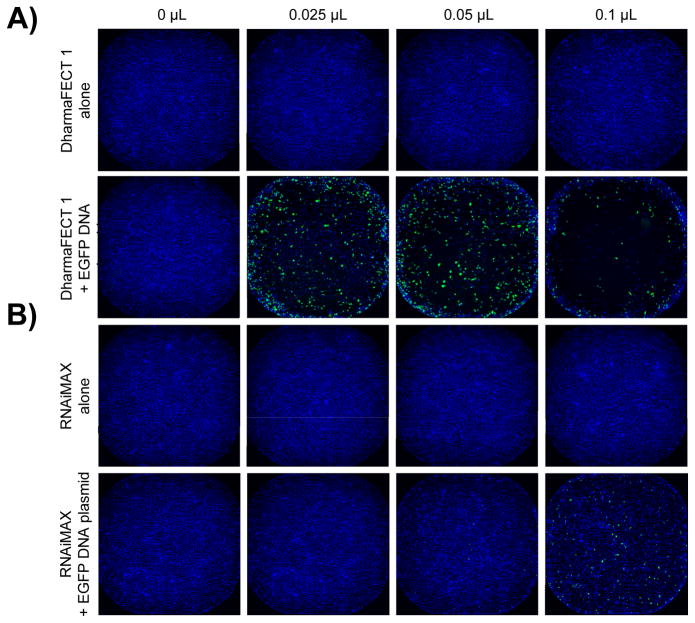
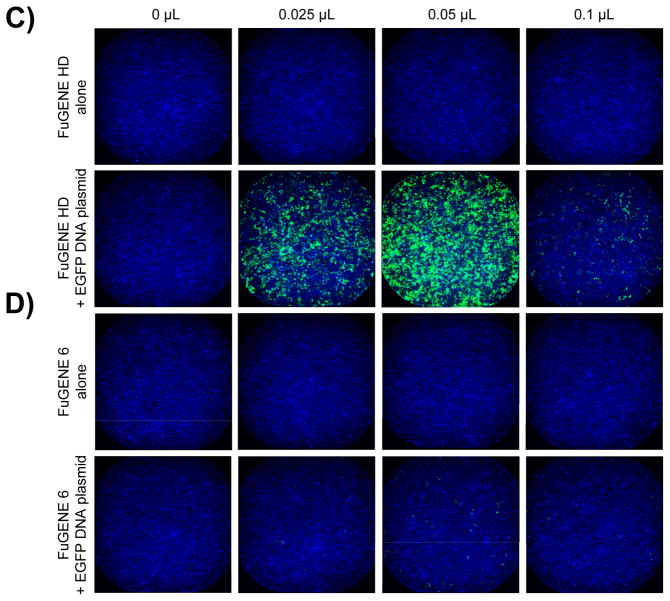
Fused whole well images of the DAPI and FITC channels captured at 4X objective magnification on the INCA2000 72 hours post transfection and showing the ensemble of Hoechst-stained nuclei and EGFP expressing cells. Representative images are shown for wells treated with 0, 0.025, 0.05 and 0.1 μL transfection reagent only or in combination with the EGFP DNA plasmid, for (A) DharmaFECT 1, (B) RNAiMAX, (C) FuGENE HD, (D) FuGENE 6 and (E) X-treme GENE 9.
When we quantified the percentage of EGFP-expressing cells, we found that our panel of reagents yielded a wide range of TEs (Fig. 4B); the highest being observed with FuGENE HD (Fig. 5C), followed by DharmaFECT 1 (Fig. 5A), TransIT-LT1 and LTX, all resulting in between 25 and 50% EGFP-positive cells (Fig. 4B). Interestingly, the highest TE was not always achieved with the largest amount of reagent tested, since DharmaFECT 1, FuGENE HD and TransIT-LT1 reached their optimal concentration at 0.05 μL per well (Fig. 4B, 5A&C). FuGENE 6 and X-tremeGENE 9, on the other hand, did not lead to significant EGFP expression at least in our study (Fig. 4B, 5D&E). Altogether, our results highlight the importance of thoroughly optimizing conditions for transfection beyond the manufacturer’s recommendations.
Assessment of cell stress induction
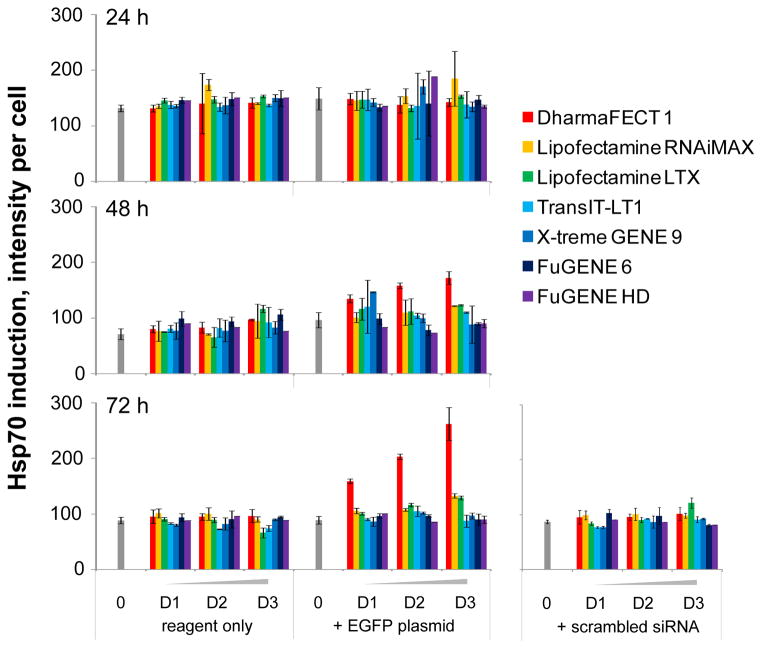
Heat shock proteins act as molecular guardians of proteome integrity and their expression is induced in response to cell exposure to environmental stress in order to prevent protein misfolding and aggregation [14]. As such, measuring Hsp induction would constitute a reliable method to quantify cell exposure to a toxic environment. In order to assess any cell stress induced by the chemical transfection process, we chose to measure Hsp10 and Hsp70 expression as two distinct representatives of the four main classes of heat shock proteins involved in the folding of newly formed proteins and the prevention of unfolded protein aggregation [15, 16]. Both Hsp10 and Hsp70 induction correlate well with cell stress induction, while their intracellular localization may differ: Hsp10 has been reported mainly in the cytosol and nucleus [17] and Hsp70 seems predominantly expressed in the cytosol, mitochondria and the endoplasmic reticulum [18]. Using high content analysis, we quantified Hsp expression from the same wells used to measure cell proliferation and TE. Interestingly, we observed completely different patterns of expression for Hsp10 and Hsp70 for our controls in absence of treatment. Hsp10 was not significantly expressed in control wells (Fig. 6) while Hsp70 was induced 24 hours post-transfection (Fig. 7). Hsp70 induction gradually decreased over time in control untreated wells, suggesting that its expression may well be a response to cell seeding. This constitutes an important observation highlighting the necessity to monitor cell stress over time when optimizing transfection conditions, since early time points may be affected by stress inherent to the experimental conditions, but non-specific to tested reagents.
Figure 6. Hsp10 induction assessment in the presence or absence of seven transfection reagents.
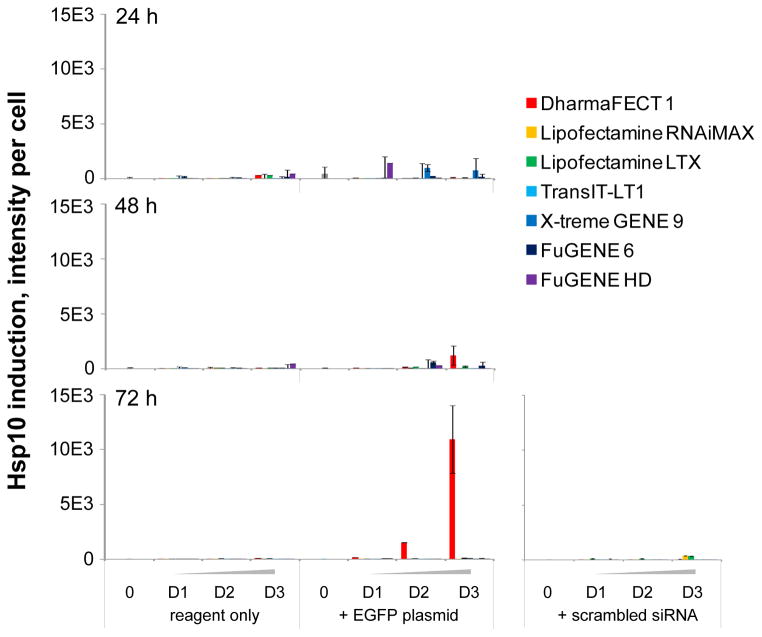
Bar graph summary of the quantification of Hsp10 induction based on imaging and automated image analysis of Hoechst-stained nuclei and Hsp10 immunostaining as a function of time. Seven commercially available transfection reagents are tested at 3 dilutions D1, D2 and D3 corresponding respectively to 0.025, 0.05 and 0.1 μL per well compared to control wells in absence of transfection reagent. Hsp10 induction is measured at 24, 48 and 72 hours post transfection with chemical transfection reagent only and in combination with the EGFP DNA plasmid or scrambled siRNA duplex. Images on the Cy5 channel imaged at 40X objective magnification on the INCA6000 automated laser-based imaging platform with confocal modality showing Hsp10 expression.
Figure 7. Hsp70 induction assessment in the presence or absence of seven transfection reagents.
Bar graph summary of the quantification of Hsp70 induction based on imaging and automated image analysis of Hoechst-stained nuclei and Hsp70 immunostaining as a function of time. Seven commercially available chemical transfection reagents are tested at 3 dilutions D1, D2 and D3 corresponding respectively to 0.025, 0.05 and 0.1 μL per well compared to control wells in absence of transfection reagent. Hsp70 induction is measured at 24, 48 and 72 hours post transfection with chemical transfection reagent only and in combination with the EGFP DNA or scrambled siRNA duplex. Images on the Cy5 channel imaged at 40X objective magnification on the INCA6000 automated laser-based imaging platform with confocal modality showing Hsp70 expression.
We found that only one reagent induced a significant increase in Hsp10 expression; namely, DharmaFECT 1 in a time and dose-dependent manner, with a peak at 72 hours for 0.1 μL per well (Fig. 6). Interestingly, Hsp10 induction was accompanied with its translocation from the cytosol to the nucleus (Figs. 3&6). To our knowledge, this observation has not been previously reported, Hsp10 being described as mainly cytosolic [18, 19]. Of note, Hsp10 induction by DharmaFECT 1 was observed only in combination with the EGFPDNA plasmid and not with the reagent alone, consistent with the decrease in cell proliferation previously observed with this reagent (Fig. 4A). In concordance with the hypothesis that the observed toxicity is specific to transfection of DNA rather than siRNA duplex, we found that no significant Hsp10 induction was triggered by any of the tested reagents in combination with the scrambled siRNA duplex (Fig. 6A). The other two reagents previously found to decrease cell proliferation, namely RNAiMAX (Fig. 6) and LTX, did not significantly induce Hsp10 expression. This observation highlights the importance of using a multiplexed readout to assess toxicity induced by transfection, as a single readout may fail to accurately report on cell stress and toxicity.
Similar to our previous findings, DharmaFECT 1 combined with the EGFP DNA plasmid was found to induce Hsp70 in a time and dose-dependent manner and was maximal for 0.1 μL per well at 72h post-transfection (Fig. 7). Hsp70 expression was found to be cytosolic in absence of stress (Fig. 2) and nuclear upon induction (Fig. 7), consistent with Hsp70 translocation from the cytosol to the nucleus as previously described [20]. At 72 hours post-transfection, a slight increase in Hsp70 expression was observed with the highest concentration of RNAiMAX (Fig. 7) and LTX when combined with the DNA plasmid, albeit much more modest as compared to DharmaFECT 1 (Fig. 6). This observation correlates with the antiproliferative effect observed with these reagents (Fig. 4A). Mirroring our observations with Hsp10, no Hsp70 induction was observed with the scrambled siRNA duplex transfection, indicating that differential effects are observed based on the nature of the nuclei acid combined with transfection reagents. Altogether, our observations are consistent and our results validate the use of our platform for in-depth characterization of the negative side effects of chemical transfection reagents.
DISCUSSION
In absence of any comparative study of transfection reagents combined with rigorous evaluation of their cytotoxic effects, we developed a profiling platform that would allow the rapid study and optimization of transfection conditions for a given cell type, beyond the generic recommendations from the manufacturers, and using multiplexed direct readouts. For this purpose, we employed a high content assay approach allowing to multiplex readouts from the same well: cell proliferation, TE, Hsp10 and Hsp70 induction, and qualitative assessment of cell morphology (Table 2). This approach is amenable to extracting even more information from the same well, such as nuclei shape and size, or quantitative assessment of cell morphology. Multiplexing is preferred to running different assays in parallel, as the variability between experiments conducted in different wells and on different days could lead to inaccurate conclusions. In addition, as opposed to end point measurements relying on low content viability assays commonly used to assess cytotoxicity, a high content assay strategy allows to quantify cell proliferation directly by measuring nuclei count (Figs. 1 & 4). Direct nuclei count constitutes a better measure of cellular growth inhibition as compared to viability assays relying on the metabolic conversion of a dye [2, 21, 22], since such assays suffer from saturation kinetics [23] which may lead to overlooking toxicity [7]. Furthermore, this type of assay measures the average response of a heterogeneous cell population, in contrast to cell by cell analysis enabled by nuclei count [7]. To maximize data accuracy, we took advantage of whole-well imaging at 4X objective magnification on the INCA2000 automated epifluorescence microscope for nuclei count readout, as the cell distribution in a well is not uniform and could lead to an inexact output if imaged fields do not cover a significant portion of the well surface (Fig. 1).
We also employed the whole well imaging technique to quantify TE. Very often, TE is estimated using a surrogate measurement consisting in the total fluorescence intensity as measured by a plate reader following transfection and expression of a plasmid coding for a fluorescent protein. This approach is prone to a number of artifacts, due to its inability to extract any cell-by-cell information: (a) a few bright cells will skew the results toward high efficiency, (b) fluorescent cell debris will be included in the total fluorescence intensity readout, and (c) fluorescence intensity not only reflects the efficiency of transfection of a fluorescent vector, but also the efficiency of its expression. For these reason, we chose to stay away from a fluorescence intensity-based readout, and instead calculated the percentage of cells expressing EGFP, the true measure of transfection efficiency. This measure can only be obtained from cell-by-cell analysis, which our approach enables. In order to dismiss fluorescent artifacts such as cell debris, we developed a custom image analysis algorithm that outputs the number of EGFP positive cells by overlapping objects segmented on the FITC channel with nuclei identified on the DAPI channel (Fig. 1). Hence, only EGFP positive cells were taken into account to calculate TE using this cell-by-cell analysis approach (Fig. 4B); this method is more accurate than measuring the average signal of the well population as was the case in most previous comparative studies [1, 4, 11, 12] and does not require to trypsinize cells, which is needed for flow cytometry-based readouts [5, 6, 10]. Importantly, we calculated TE based on the same wells used to measure cell proliferation, ensuring consistency between readouts. An additional readout extracted from the same wells was the quantification of Hsp10 and Hsp70 inductions. For this readout, higher magnification is needed to accurately quantify the intensity of Hsp immunostaining, and we used a 40X objective magnification on the INCA6000 for this purpose. Another advantage of microscopy-based readouts is the ability to image wells at different magnifications with different instruments taking advantage of the best instrument for different readouts (Table 2).
When we compared the TEs achieved by our panel of reagents, we observed that different reagents yielded a wide range of TEs, and with an antiproliferative effect at different time points and at different reagent concentration (Fig. 4), all of which were within the range recommended by the manufacturers (Table 1). This result highlights the importance of optimizing transfection conditions on a cell line by cell line basis, and our approach allows to screen different transfection conditions in parallel in a single experiment to quickly identify optimal conditions. DharmaFECT 1 and FuGENE HD yielded the higher percentage of EGFP-expressing cells, corresponding to 40 to 50% TE (Fig. 4B). However, we found that this readout is misleading if cell count is not taken into account. While up to 40% of HeLa cells expressed EGFP at 72h post-transfection using 0.05 μL DharmaFECT 1 per well, the number of cells was dramatically reduced compared to untreated control (Fig. 4B&5A). In addition, DharmaFECT 1 at this concentration combined with EGFP DNA plasmid induced cell stress as measured by the induction of Hsp10 (Fig. 6) and Hsp70 (Fig. 7). The toxicity of these transfection conditions may have been completely overlooked if only a measure of EGFP intensity had been performed and if viability had been measured using conditions where a small number of cells lead to a saturated absorbance or fluorescence intensity signal. This result highlights the importance of multiplexing readouts to assess toxicity and validates our approach. In combination with the EGFP DNA plasmid, we found that the optimal transfection conditions were achieved using FuGENE HD at 0.05 μL per well 72 hours post transfection. In those conditions, up to 50% HeLa cells were transfected and expressed EGFP (Fig. 4B&5C), in absence of any measurable antiproliferative effect (Fig. 4A) and of any cell stress as measured by induction of Hsp10 or Hsp70 (Figs. 6&7). This result is in agreement with several comparative studies previously published identifying FuGENE HD as the optimal reagent for transfection of human dental follicle cell s[10], of MCF7 human breast cancer cells [12] and of a panel of nine cancer cell lines including HeLa cells [1].
Different transfection reagents are known to cause different levels of toxicity in different cell lines [12] and our study has uncovered a trend according to which cationic lipids such as LTX, RNAiMAX and DharmaFECT1 seemed to be more toxic than other formulations when transfecting DNA-based plasmids (Fig. 4A). In addition to this toxic effect, RNAi is plagued with off-target effects resulting from multiple sources such as seed sequences and miRNA mimics that must be taken into account for hit nomination [3]. For siRNA screens, an additional source of off-target effects has been shown to be the transfection reagent, as a comparative study demonstrated that different reagents used to transfect the same DNA-based plasmid resulted in greater than 10-fold difference in the number of differentially expressed transcripts as measured by gene expression profiling [12], This study strongly suggests that transfection reagents themselves can constitute a source of off-target effects when combined with a DNA-based plasmid. Our results are in agreement with these findings, since we found that transfection of our EFGP DNA plasmid reduced the proliferation of HeLa cells when using DharmaFECT 1, RNAiMAX and LTX, but not with the other tested reagents (Fig. 4A). In addition, differential induction of Hsp10 and Hsp70 was observed among the tested reagents, with again DharmaFECT1, RNAiMAX, and LTX inducing Hsp70 (Fig. 7) but not any of the other reagents, and DharmaFECT 1 being the only reagent inducing Hsp10 (Fig. 6). Cell stress was therefore differentially induced by the transfection reagent, since the DNA plasmid sequence was identical for all transfections. Hence, for the first time, we demonstrated that a chemical transfection reagent can induce cell stress as measured by Hsp induction. Hsp induction may constitute a good reporter of off-target effects observed in experiments relying on chemical transfection and should be taken into account when optimizing assay conditions. In addition, a previous study demonstrated the contribution of the DNA sequence to off-target effects, as transfection of a vector including a reporter gene resulted in differentially expressed transcripts compared to transfection of the empty vector [12]. Similarly, our study points to the nature of the transfected nucleic acid as a contributing factor to off-target effects, as we observed differential induction of cell stress and differential antiproliferative effect with DharmaFECT 1, depending on whether an EGFPDNA plasmid or a scrambled siRNA duplex was transfected (Figs. 4A, 6& 7).
Altogether, our study highlights the importance of testing different reagents and optimizing transfection conditions to minimize toxicity and cell stress induced by the process of chemical transfection. We describe here a profiling approach allowing to directly compare multiple reagents and transfection parameters in a single experiment to quickly and accurately identify optimal conditions. Such optimizationsare of tremendous importance, as we showed that chemical transfection, regardless of the cargo may be a source of off-target effects, especially if the resulting cells are to be used for chemical or RNAi screening. Therefore, taking the time to identify optimal conditions for each cell line are critical to ensure off-target effects minimization inexperiments relying on chemical transfection.
Acknowledgments
The authors would like to thank members of the HTS Core Facility for their help during the course of this study and Dr. Andrea Ventura (Cancer Biology & Genetics Program, Memorial Sloan-Kettering Cancer Center) for the generous gift of EGFPDNA plasmid pEF6-EGFP. The HTS Core Facility is partially funded by Mr. William H. Goodwin and Mrs. Alice Goodwin and the Commonwealth Foundation for Cancer Research, the Experimental Therapeutics Center of MSKCC, the William Randolph Hearst Fund in Experimental Therapeutics, the Lillian S. Wells Foundation, and by a NIH/NCI Cancer Center Support Grant 5 P30CA008748-44.
References
- 1.Yamano S, Dai J, Moursi AM. Comparison of transfection efficiency of nonviral gene transfer reagents. Mol Biotechnol. 2010;46(3):287–300. doi: 10.1007/s12033-010-9302-5. [DOI] [PubMed] [Google Scholar]
- 2.Bhinder B, Antczak C, Ramirez CN, Shum D, Liu-Sullivan N, Radu C, Frattini MG, Djaballah H. An Arrayed Genome-Scale Lentiviral-Enabled Short Hairpin RNA Screen Identifies Lethal and Rescuer Gene Candidates. Assay Drug Dev Technol. 2012;11(3):173–190. doi: 10.1089/adt.2012.475. [DOI] [PMC free article] [PubMed] [Google Scholar]
- 3.Bhinder B, Djaballah H. A simple method for analyzing actives in random RNAi screens: introducing the “H Score” for hit nomination & gene prioritization. Comb Chem High Throughput Screen. 2012;15(9):686–704. doi: 10.2174/138620712803519671. [DOI] [PMC free article] [PubMed] [Google Scholar]
- 4.Carralot JP, Kim TK, Lenseigne B, Boese AS, Sommer P, Genovesio A, Brodin P. Automated high-throughput siRNA transfection in raw 264.7 macrophages: a case study for optimization procedure. J Biomol Screen. 2009;14(2):151–160. doi: 10.1177/1087057108328762. [DOI] [PubMed] [Google Scholar]
- 5.Kiefer K, Clement J, Garidel P, Peschka-Suss R. Transfection efficiency and cytotoxicity of nonviral gene transfer reagents in human smooth muscle and endothelial cells. Pharm Res. 2004;21 (6):1009–1017. doi: 10.1023/b:pham.0000029291.62615.ec. [DOI] [PubMed] [Google Scholar]
- 6.Hunt MA, Currie MJ, Robinson BA, Dachs GU. Optimizing transfection of primary human umbilical vein endothelial cells using commercially available chemical transfection reagents. J Biomol Tech. 2010;21(2):66–72. [PMC free article] [PubMed] [Google Scholar]
- 7.Ramirez CN, Antczak C, Djaballah H. Cell viability assessment: toward content-rich platforms. Expert Opin Drug Discov. 2010;5(3):223–233. doi: 10.1517/17460441003596685. [DOI] [PMC free article] [PubMed] [Google Scholar]
- 8.King MA. Detection of dead cells and measurement of cell killing by flow cytometry. J Immunol Methods. 2000;243(1–2):155–166. doi: 10.1016/s0022-1759(00)00232-5. [DOI] [PubMed] [Google Scholar]
- 9.Slater K. Cytotoxicity tests for high-throughput drug discovery. Curr Opin Biotechnol. 2001;12(1):70–74. doi: 10.1016/s0958-1669(00)00177-4. [DOI] [PubMed] [Google Scholar]
- 10.Yalvac ME, Ramazanoglu M, Gumru OZ, Sahin F, Palotas A, Rizvanov AA. Comparison and optimisation of transfection of human dental follicle cells, a novel source of stem cells, with different chemical methods and electro-poration. Neurochem Res. 2009;34(7):1272–1277. doi: 10.1007/s11064-008-9905-4. [DOI] [PubMed] [Google Scholar]
- 11.Borawski J, Lindeman A, Buxton F, Labow M, Gaither LA. Optimization procedure for small interfering RNA transfection in a 384-well format. J Biomol Screen. 2007;12(4):546–559. doi: 10.1177/1087057107300172. [DOI] [PubMed] [Google Scholar]
- 12.Jacobsen L, Calvin S, Lobenhofer E. Transcriptional effects of transfection: the potential for misinterpretation of gene expression data generated from transiently transfected cells. Biotechniques. 2009;47(1):617–624. doi: 10.2144/000113132. [DOI] [PubMed] [Google Scholar]
- 13.Antczak C, Takagi T, Ramirez CN, Radu C, Djaballah H. Live-cell imaging of caspase activation for high-content screening. J Biomol Screen. 2009;14(8):956–969. doi: 10.1177/1087057109343207. [DOI] [PMC free article] [PubMed] [Google Scholar]
- 14.Akerfelt M, Morimoto RI, Sistonen L. Heat shock factors: integrators of cell stress, development and lifespan. Nat Rev Mol Cell Biol. 2010;11(8):545–555. doi: 10.1038/nrm2938. [DOI] [PMC free article] [PubMed] [Google Scholar]
- 15.Kourtis N, Tavernarakis N. Cellular stress response pathways and ageing: intricate molecular relationships. The EMBO journal. 2011;30(13):2520–2531. doi: 10.1038/emboj.2011.162. [DOI] [PMC free article] [PubMed] [Google Scholar]
- 16.Tyedmers J, Mogk A, Bukau B. Cellular strategies for controlling protein aggregation. Nat Rev Mol Cell Biol. 2010;11(11):777–788. doi: 10.1038/nrm2993. [DOI] [PubMed] [Google Scholar]
- 17.Kregel KC. Heat shock proteins: modifying factors in physiological stress responses and acquired thermotolerance. J Appl Physiol. 2002;92(5):2177–2186. doi: 10.1152/japplphysiol.01267.2001. [DOI] [PubMed] [Google Scholar]
- 18.Srivastava P. Roles of heat-shock proteins in innate and adaptive immunity. Nat Rev Immunol. 2002;2(3):185–194. doi: 10.1038/nri749. [DOI] [PubMed] [Google Scholar]
- 19.David S, Bucchieri F, Corrao S, Czarnecka AM, Campanella C, Farina F, Peri G, Tomasello G, Sciume C, Modica G, La Rocca G, Anzalone R, Giuffre M, Conway De Macario E, Macario AJ, Cappello F, Zummo G. Hsp10: anatomic distribution, functions, and involvement in human disease. Front Biosci (Elite Ed) 2013;5:768–778. doi: 10.2741/e657. [DOI] [PubMed] [Google Scholar]
- 20.Kotoglou P, Kalaitzakis A, Vezyraki P, Tzavaras T, Michalis LK, Dantzer F, Jung JU, Angelidis C. Hsp70 translocates to the nuclei and nucleoli, binds to XRCC1 and PARP-1, and protects HeLa cells from single-strand DNA breaks. Cell Stress Chaperones. 2009;14(4):391–406. doi: 10.1007/s12192-008-0093-6. [DOI] [PMC free article] [PubMed] [Google Scholar]
- 21.Shum D, Bhinder B, Djaballah H. Modulators of the microRNA biogenesis pathway via arrayed lentiviral enabled RNAi screening for drug and biomarker discovery. Comb Chem High Through Screen. doi: 10.2174/1386207311301010004. (in press) [DOI] [PMC free article] [PubMed] [Google Scholar]
- 22.Shum D, Bhinder B, Radu C, Calder P, Ramirez CN, Djaballah H. An Image-Based Biosensor Assay Strategy to Screen for Modulators of the microRNA 21 Biogenesis Pathway. Comb Chem High Through Screen. 2012;15(7):529–541. doi: 10.2174/138620712801619131. [DOI] [PMC free article] [PubMed] [Google Scholar]
- 23.Shum D, Radu C, Kim E, Cajuste M, Shao Y, Seshan VE, Djaballah H. A high density assay format for the detection of novel cytotoxic agents in large chemical libraries. J Enzyme Inhib Med Chem. 2008;23(6):931–45. doi: 10.1080/14756360701810082. [DOI] [PMC free article] [PubMed] [Google Scholar]


