

Abstract
We propose that the bulk viscoelasticity of soft tissues results from two length-scale-dependent mechanisms: the time-dependent response of extracellular matrix proteins (ECM) at the nanometer scale and the biophysical interactions between the ECM solid structure and interstitial fluid at the micrometer scale. The latter was modeled using the poroelasticity theory with an assumption of free motion of the interstitial fluid within the porous ECM structure. Following a recent study (Heris, H.K., Miri, A.K., Tripathy, U., Barthelat, F., Mongeau, L., 2013. Journal of the Mechanical Behavior of Biomedical Materials), atomic force microscopy was used to perform creep loading and 50-nm sinusoidal oscillations on porcine vocal folds. The proposed model was calibrated by a finite element model to accurately predict the nanoscale viscoelastic moduli of ECM. A linear correlation was observed between the in-depth distribution of the viscoelastic moduli and that of hyaluronic acids in the vocal fold tissue. We conclude that hyaluronic acids may regulate the vocal fold viscoelasticity at nanoscale. The proposed methodology offers a characterization tool for biomaterials used in vocal fold augmentations.
Keywords: Extracellular matrix proteins, Poroelasticity, Viscoelasticity, Indentation, Vocal folds
1. Introduction
Extracellular matrix proteins (ECM) control the bulk (i.e., macroscopic) viscoelastic properties of soft tissues. Biophysical interactions among ECM molecules occur in micro- and nanometer scales; however, the tissue response is characterized over a much larger scale. Having structural information of ECM, proper structural models can determine the bulk viscoelastic properties of the subject tissue. Such models may allow prediction of the viscoelasticity of the target tissue before and after any treatment for an assessment of the effectiveness of the treatment. This article presents a multiscale approach to study the contribution of interstitial fluid flow to the viscoelastic properties of soft tissues.
Vocal folds, which are the subject of this study, undergo quasi-static large deformations and high-frequency small deformations during phonation (Gray et al., 1999). The viscoelastic moduli of dissected vocal folds have been measured in both deformation regimes, using conventional testing methods, such as uniaxial traction testing (Alipour et al., 2011) and shear rheometry (Chan and Rodriguez, 2008). The viscoelastic properties were found to depend on the specimen configuration, due to presumably significant inhomogeneity and anisotropy of the tissue (Miri et al., 2012b). The problems associated with tissue inhomogeneity are reduced when measuring local properties using indentation testing (Chhetri et al., 2011). It is also easier to impose high-frequency loading in indentation testing than in other testing methods. This is important because phonation, the primary physiological function of vocal folds, involves deformations at frequencies up to 1 kHz (Chan and Rodriguez, 2008).
Atomic force microscopy (AFM) allows probe scanning and force spectroscopy in biological soft tissues and biomaterials (Oyen, 2013; Tripathy and Berger, 2009). Compared to conventional indenters, AFM offers a greater sensitivity, which varies with the total mass of the cantilever, the system damping, and the cantilever stiffness (McConney et al., 2010). AFM-based indentation has been used for soft engineering materials (McConney et al., 2010), soft tissues (Nia et al., 2011), and cells (Mahaffy et al., 2004). In a recent study (Nia et al., 2013), a commercial AFM was equipped with a spherical probe and a well-controlled piezoelectric substrate to perform nanoindentation on articular cartilage within a frequency range of 0.1–10 kHz. Spherical probes allow imposing relatively large forces with minimal damage to the surface; hence, they are ideal for compliant materials, such as vocal folds. AFM-based indentation with a spherical probe, known as colloidal force spectroscopy (McConney et al., 2010), allows the use of the Hertz contact theory, as demonstrated in a previous study (Heris et al., 2013) of micro-indentation of vocal folds. The efficiency of AFM-based indentation testing in the prediction of the viscoelastic properties of vocal folds was discussed by Heris et al. (2013).
Mammalian vocal folds are multilayered structures, including the epithelium, the lamina propria and the muscle. The lamina propria is a hypocellular connecting tissue composed of fibrous proteins such as collagen and elastin entangled within interstitial molecules such as proteoglycan, glycoprotein and glycosaminoglycan (GAG). Viscoelasticity of the lamina propria is crucial to maintain proper phonatory functions of vocal folds. Biomechanical arguments have suggested a dominant contribution of collagen fibrils and elastin fibers to the viscoelasticity of the ECM structure (e.g., (Gray et al., 2000)). These fibrous proteins occupy a large fraction of the ECM volume in human vocal folds, with significant variations with depth within the lamina propria (Miri et al., 2012c). On the other hand, negatively-charged aggrecans and GAG chains are believed to control the mass transport of the interstitial fluid, due to their great swelling capacity (Gray et al., 1999). The vocal fold swelling-contraction characteristics imply a poroelastic behavior. The pores in the vocal fold tissue were shown to be on the submicron scale (Heris et al., 2013), indicating that the interactions between the interstitial fluid and the ECM structure occur at the micrometer scale. The ECM poroelasticity regulates the bulk viscoelasticity of the vocal fold tissue because the percolation of fluid volumes through the pores dissipates mechanical energy (Miri et al., 2012a). Linear poroelasticity has been already applied to simulate the dynamic mechanical response of vocal folds (Tao et al., 2009).
We hypothesize that mechanical energy dissipation in vocal folds results from two decoupled mechanisms: I) the intrinsic viscoelasticity of the ECM solid framework at the nanometer scale and II) the biophysical interactions between solid and the interstitial fluid at the micrometer scale. The length scale of the ECM components such as collagen, protoglycans and GAGs (Gray et al., 1999) substantiates our hypothesis. A linear poroelastic model (Galli and Oyen, 2009) that isolates the contribution of solid-fluid interactions to tissue response from those of the ECM viscoelasticity was developed for indentation testing. Continuous microscale creep loading and nanoscale sinusoidal displacement were imposed by programming an AFM, following the testing procedure used by Nia et al. (2011). In creep tests, the AFM cantilever approaches the surface gradually, indents the sample, and remains at a constant force level for a specified time. A finite element analysis (FEA) was used to calibrate our formulation through estimation of the drainage length, a parameter describing fluid entrainment. The viscoelastic moduli of the ECM structure in porcine vocal folds were determined from the oscillation tests. The proposed multiscale approach can be used to measure the nanoscale viscoelasticity of any other soft tissues.
2. Methods and Materials
2.1. Sample preparation
Porcine vocal fold samples (n = 3) were prepared following the protocol used in Heris et al (2013). A rectangular area of about 2 mm × 2 mm was excised with sharp blades from the central region of the vocal fold lamina propria along the sagittal plane. The tissue was flash frozen in OCT (Optimal Cutting Temperature Compound, Sakura Finetek, Dublin, OH) medium with no labeling or dehydration. The tissue samples were sectioned using a cryostat (Leica CM-3505-S). Starting from the superficial layer, 50 μm thick layers were removed at intervals of 100 μm. Three slices from each sample, down to a depth of about ~ 350 μm, were used for this study (nine slices in total). The general orientation of each slice was therefore in the sagittal plane, with the abscissa oriented along the anterior-posterior direction. The samples were mounted on microscopy glass slides. A very thin layer of nail polish was added to glue the tissue to the glass substrate.
2.2. Atomic force microscopy
A commercially available AFM (Multimode Nanoscope IIIa, Veeco, Santa Barbara, CA), equipped with a NanoScope V controller, was used to perform the indentation tests. Silicon nitride micro-cantilevers, with a nominal stiffness of 0.35 N/m, and colloidal probes (25 μm diameter; Novascan Tech Inc, Ames, IA) were used. Using nonlinear laser scanning microscopy data, Heris et al. (2013) showed that a 3–5 μm indentation of the vocal fold tissue with a 25 μm diameter probe (Fig. 1b) characterizes a representative volume for the bulk distribution of fibrous proteins. Although such a large probe might suffer from significant adhesion forces, the force history of the vocal fold tissue presented by Heris et al. (2013) confirmed negligible adhesive effects.
Fig. 1.

a) 1D consolidation test adopted from Galli and Oyen (2009). The parameter L denotes the sample thickness and x-axis represents a local coordinate. b) Indentation of one tissue sample using AFM and the deformation field around a spherical probe. d(t) denotes the motion of the cantilever, F the contact force on the probe tip, R the probe radius, A the contact area, h(t) the indentation depth, and X–Y axes represent the global coordinate.
The samples were submerged in a buffer solution with a pH of 7.6 to mimic physiological conditions. The deflection sensitivity of the piezoelectric cantilever was measured by probing the hard surface of the glass substrate. The probe spring constant was measured using the thermal tuning method (Heris et al., 2013). An area of approximately 100 μm × 100 μm was indented by the probe. The force-displacement curves that displayed insignificant noise and adhesion effects were selected for post-processing. Ideal force-displacement curves (McConney et al., 2010) may be decomposed into: 1) a straight no-load line, corresponding to the path of the probe as it approaches the surface, 2) a “snap-to” region, where the probe contacts the surface, and 3) the loading region, where actual indentation occurs.
The loading consists of two consecutive steps: creep and oscillation, as illustrated in Fig. 2. Creep tests include a rapid ramp force function, followed by a constant force. For creep tests, scripts were written in the Nanoscope software to control the motion of the AFM cantilever. A set point of 5–10 V, corresponding to a 50–200 nN force, was used. It was kept constant over the indentation period, longer than 30 seconds (Heris et al., 2013), during which the cantilever remained at a constant force. The cantilever subsequently imposed a frequency-dependent sinusoidal displacement of 50 nm amplitude, over a range of 1–50 Hz (instrument’s nominal limit). The experimental data for loading frequencies of higher than ~ 20 Hz were very noisy; thus, they were excluded from the analysis.
Fig. 2.
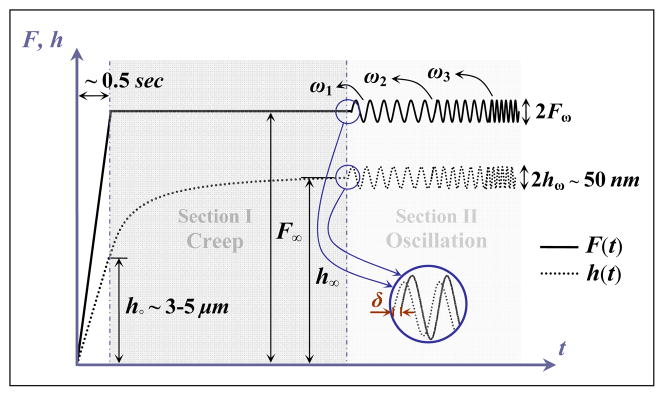
Indenter force (F) and deformation (h) versus time (t). F∞ denotes the constant force imposed by indenter, h∘ the initial creep displacement, h∞ the steady-state creep displacement, Fω the oscillatory force response, hω the oscillatory displacement input, ω1< ω2< ω3 the loading frequencies, δ the phase lag between the force and displacement.
3. Theoretical Modeling
3.1. Creep testing
Galli and Oyen (2009) suggested use of the 1D consolidation problem, along with master curves generated from a computational model of indentation tests, for simulating the creep response, as shown in Fig. 1. In addition to the assumption of the 1D consolidation problem, we propose use of an experiment-specific FEA to calibrate the formulation. This may eliminate potential errors imposed by the geometric nonlinearity of large deformations for an indentation depth of ~ 4 μm, particularly for the lower range of elastic moduli used in our simulation (in which local strains exceed 30–40%).
The cross-section, indentation area is , where R and h∞ denote the probe radius (Fig. 1b) and the steady-state indentation depth (Fig. 2), respectively. The characteristic length, L (> 2Rcos−1(1 − h∞/R)), equals twice the drainage length that is the longest distance the interstitial fluid has to travel to escape the medium. The parameter L was obtained using numerical simulations, as explained in the next section. The governing equations of the 1D consolidation problem are presented in Appendix.
An auxiliary coordinate, ζ(0 ≤ ζ ≤ Lζ), attached to the solid structure was used to facilitate the creep analysis, where Lζ denotes the thickness of the dried tissue sample, i.e., L(1 − φ∘). The coordinate transformation is defined as (Chin et al., 2011)
| (1) |
Using Eq. (1), the governing diffusion equation in Eq. (23) is rewritten as
| (2) |
Because fluid is free to flow at both ends and considering Eq. (15), the pore pressure vanishes at ζ = 0, Lζ and, along with Eqs. (19) and (21), it yields constant strains and stresses. The appropriate boundary condition is εx = ε∞, at ζ = 0, Lζ, where ε∞ denotes the steady-state strain below the probe. The initial condition is εx = ε∘, at t = 0, where ε∘ represents the initial, sudden strain imposed by the probe. Using the separation-of-variables method, the exact solution of Eq. (2) is
| (3) |
with
| (4) |
Eqs. (1) and (3) were manipulated to obtain the displacement function, h(0, t) = h(t), below the probe tip. Integration of the length increment yields the displacement function, i.e.,
| (5) |
The strain parameters ε∘ = h∘/L and ε∞ = h∞/L are defined based on the consolidation problem (Fig. 1a and Fig. 2) and then were used in Eq. (5) to yield
| (6) |
From the Hertz contact theory (Johnson, 1987), the indentation force function F(t) is related to the displacement function h(t) as follows (Heris et al., 2013)
| (7) |
where ν is the Poisson ratio of the fully-drained tissue. The substitution of initial and steady-state responses in Eq. (7), along with the incompressibility assumption, yields (Galli and Oyen, 2009)
| (8) |
Three material constants, including the bulk elastic modulus, E, permeability constant, κ, and the fluid volume fraction, φ, were indentified using trial and error. From the steady-state response of the creep problem and Eq. (7), an estimation of the bulk tissue modulus was obtained. The result was then used in Eq. (2) and Eqs. (6) to (8) to obtain an optimum set of the permeability constant and the fluid volume fraction. The iteration was started with φ∘ as the initial guess. This procedure was iterated and resulted in a regression of Eq. (6) to the experimental data.
3.2. Oscillation testing
Following the steady-state response, the tissue sample was subjected to small-amplitude, frequency-dependent displacements, i.e.,
| (9) |
where ω is the frequency and the complex constant hω denotes the amplitude of oscillations. The tissue resistance measured below the probe tip should have the form
| (10) |
where F∞ denotes the steady-state force, which can be calculated from Eq. (7); the constant Fω represents the amplitude of oscillations; and δ denotes the phase-lag parameter as shown in Fig. 2. Because Eq. (23) governs the oscillation problem, the transformation in Eq. (1) and the governing equation in Eq. (2) were applied here, with the fully-drained Poisson ratio ν. The associated boundary condition is εx = ε∞ + εω exp(iωt), at ζ = 0, Lζ, where εω = hω/L, and the initial condition is εx = ε∞ + εω, at t = 0. Solution of Eq. (2), along with these conditions, based on the separation-of-variables method and after some mathematical manipulations, yields
| (11) |
where and the generally complex constants are defined by
| (12) |
Transformation back to the original coordinate (see Eq. (5)) leads to a closed-form expression for the displacement function,
| (13) |
The displacement function, h(t), can be expanded using Taylor series around the steady-state displacement, h∞, as proposed by Mahaffy et al. (2004). The steady-state displacement occurred at microscale represents the tissue poroelastic response, while the displacement perturbations are controlled by the viscoelastic response of the ECM structure. Using this expansion and Eq. (7), the force function is written as
| (14) |
where h̃(t) represents the oscillatory displacement (i.e., h(t) − h∞ in Eq. (13)) and the complex constant Ẽ(ω) denotes the viscoelastic modulus of the solid phase, the ECM structure in the present case. The modulus can be decomposed as Ẽ(ω) = Ẽ′(ω) + iẼ″(ω) (Mahaffy et al., 2004). The real part, Ẽ′(ω), is the elastic modulus and the imaginary part, Ẽ″(ω), denotes the loss modulus. Their ratio, Ẽ″(ω)/Ẽ′(ω), is an indicator of the loss factor or structural damping. To identify these frequency-dependent moduli, the experimental data were fit to Eqs. (13) and (14), while the constant Dζ was already calculated from the regression of the creep results, for a presumed characteristic length. The oscillatory response, Eq. (14), can be broken up into the sum of contributions from the tissue poroelasticity and the viscoelasticity of the ECM structure. The former is represented by h(t), obtained from the poroelastic model, and the latter by Ẽ(ω), obtained by the viscoelastic model.
4. Finite Element Model
To calibrate our poroviscoelastic model, the characteristic length parameter, L, was determined using numerical simulations. Both creep and oscillation tests were modeled using the soil mechanics module of the commercially available ABAQUS software (Version 6.11, Simulia, Providence, RI). As shown in Fig. 3, a 2D angular cross-section of the tissue and the indenter was considered for the simulations. To minimize the boundary effects, the sample’s radius, B, and depth, H, were assumed much larger than the probe diameter, R. The axisymmetric section of the tissue had a radius of 100 μm and was 50 μm high and the probe diameter is 25 μm. The tissue medium was modeled as a poroelastic material with the properties shown in Table 1. Because the probe was much stiffer than the tissue, it was modeled as a rigid surface. The computational domain was built of 4-node axisymmetric quadrilateral poroelastic elements (CAX4P). The tissue cross-section seeded to 200 elements along the radial direction and 100 elements along the axial direction. The element density was 100 times higher under the tip of the probe.
Fig. 3.

Computational domain of the finite element analysis (FEA) built for a solid indenter and an isotropic, incompressible, poroelastic material slice placed on a rigid substrate. H denotes the thickness, and B the radius of the axisymmetric model
Table 1.
Material properties of the tissue
| E (Pa) | ν | κ (m2/Pa.s) | ρ (kg/m3) |
|---|---|---|---|
| 500–4500 | 0.45 | 1×10⁻¹³−1 ×10⁻⁹ | 1200 |
The lower edge of the tissue sample, i.e., Y = 0, was fixed in both radial and depth directions. A zero radial displacement was imposed on the centerline to satisfy the axisymmetric boundary condition (i.e., X = 0). Both the lower edge and the centerline were assumed to be impermeable. A zero pore pressure was imposed to the sample upper and right end boundaries (i.e., Y = H and X = B). The contact region between the tissue and the probe was assumed to be frictionless and impermeable.
The creep tests were modeled using a force-control simulation. The force required to induce a 4-μm indentation in the tissue sample was first obtained by a displacement-control simulation. The force which varies in a range of 25–250 nN among the models was then applied to the probe in 0.1 second and kept constant for 20 seconds, longer than the time required to reach the steady-state response for all simulations (< 10 seconds), in a force-control simulation. For dynamic oscillations, a displacement control analysis was performed by applying a 4 μm vertical indentation to the probe and then allowing tissue relaxation for 20 seconds. The FEA did not show any significant dependency to the frequency range of interest; thus, a sinusoidal oscillation of 3 Hz, with 50 nm amplitude, was then applied to the probe to study the dynamic response of the tissue.
5. Results and Discussion
5.1. FEA results
The pore pressure distribution at the beginning of the creep and after 20 seconds are shown in Fig. 4. The pore pressure reaches a maximum value underneath the probe tip (~1 kPa) and reduces rapidly by the depth of the tissue. The percolation of the pore-fluid governs the transient response of the tissue. The pore pressure values decrease by a time scale proportional to (L(1 − φ∘))2/Dζ in Eq. (6), because the pore-fluid escapes from the upper boundary. The fluid diffuses to lower depths while the pressure vanishes far from the probe tip.
Fig. 4.
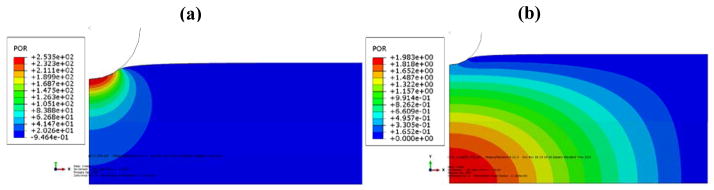
The distribution of pore pressure for two time points of creep loading for a poroelastic material with E = 1.5 kPa and κ = 9.81×10⁻¹¹ m2/Pa.s: a) at the beginning of the creep, and b) after 20 seconds (Please note that the contours are shown at a portion of the model).
Similar to the creep response (Fig. 4), the pore pressure distribution for frequency-dependent probe oscillations follows a diffusion pattern. At the beginning of each cycle, the pressure far from the probe is large and the pressure near the probe is insignificant. When the probe reaches its maximum depth, the near-field pressure is large with a negative sign. Then, the probe moves back toward the median depth. For the lowest indentation depth, a positive pressure is observed under the probe while the far-field pressure vanishes.
The FEA was used to calibrate the poroelastic material constants defined for the 1D consolidation problem (Fig. 1a), where the characteristic length is coupled with the diffusivity coefficient. Some studies (e.g., (Nia et al., 2011)) used a constant value for the length parameter in their poroelastic models for the prediction of material properties. Finite element models (e.g., (Galli and Oyen, 2009)) have been used to provide master curves or baseline data to improve poroelastic parameter identification. Our approach has the advantage of including the intrinsic coupling between the problem geometry (Fig. 3) and the poroelastic response of tissue samples throughout the length parameter (see the details in Supplementary Material).
5.2. Parameter identification
Our poroviscoelastic model includes three independent materials constants, including the viscoelastic modulus, Ẽ(ω), the permeability constant, κ, and the fluid volume fraction, φ, and one geometrical constant, i.e., L. It is assumed that the bulk elastic modulus, E, was calculated using the steady-state creep response (see Eq. (7)). A script was written in MATLAB to calculate constants and plot the results. A trial and error algorithm was used to obtain the material constants (see also Supplementary Material). The iterative process starts with an initial guess for the material constants and the characteristic length, L, to calculate the response functions in Eqs. (6) and (13). The results were then compared to the data set calculated from the FEA and the characteristic length was modified if the difference between FEA and analytical models was greater than a threshold. The force and displacement functions below the probe tip from the analytical model were then compared with the measured experimental data. If they were greater than the threshold value, the material constants were revised and the process was repeated. Iterations were performed until the difference between measured data and model predictions was less than the chosen threshold.
The results of the indentation tests are reported to study the viscoelasticity of porcine vocal fold tissue. The bulk elastic moduli for layers I, II, and III of the porcine vocal fold lamina propria, found at depths of approximately 50–150 μm, 150–250 μm, and 250–350 μm, respectively, are shown in Fig. 5. Similarity of the results in different layers confirms the homogeneity of the viscoelastic properties within the depth. This is in agreement with in-depth distributions of collagen fibrils and elastin fibers within the porcine lamina propria (Miri et al., 2013). The average bulk elastic modulus was around 4 kPa for the nine slices (two randomly selected indentation points within each slice). The value is one order-of-magnitude less than that obtained by uniaxial traction testing of porcine vocal fold tissue (Miri et al., 2012a). A similar ratio between the indentation modulus and the traction-testing modulus was observed for human vocal folds (Chhetri et al., 2011). This may indicate a lower contribution of collagen fibrils to tissue resistance for indentation testing because collagen fibrils are mostly oriented along the longitudinal direction (Miri et al., 2013).
Fig. 5.

Mean bulk elastic modulus and its standard deviation for porcine vocal fold lamina propria (n = 3) at three different depths: layer I (50–150 μm depth), layer II (150–250 μm depth), layer III (250–350 μm depth).
The variations of elastic and viscous moduli with loading frequency are shown in Fig. 6. The dynamic moduli of the first and second layers are greater than those of the third layer, by 50–100%. Collagen fibrils, elastin fibers, and hyaluranic acids (HAs) are believed to regulate the bulk viscoelastic properties of vocal folds (Gray et al., 2000; Gray et al., 1999). Among these molecules, the depth distribution of the volume fractions of HAs in the porcine lamina propria (Hahn et al., 2006a, b) was found to be similar to the depth distributions of the viscoelastic moduli (Fig. 6). The HAs and GAGs, which are cross-linked within the ECM structure, are highly hydrophilic with a high degree of swelling-contraction. This may suggest the role of GAGs in controlling the frequency-dependent viscoelasticity of vocal fold tissue at the nanometer scale.
Fig. 6.

Distributions of: a) dynamic elastic modulus and b) dynamic viscous modulus versus frequency for porcine vocal fold lamina propria at three different depths. An AFM image of the lamina propria, selected Miri et al. (2013), is presented to show the pore size.
The predictions of the proposed formulation, from regression of Eqs. (13) and (14) with time histories of AFM force and displacement readouts, were compared in Fig. 7 with those of the standard solid viscoelastic model (2004), from regression of only Eq. (14) with the AFM readouts. Both models yield viscoelastic moduli from small-amplitude oscillations of a spherical probe in soft tissues (the second term in Eq. (14)), although our model includes the biphasic properties of the tissue sample from the creep response (Eqs. (6) and (7)). Surprisingly, the poroviscoelastic model yields significantly greater values for the viscous modulus, an indicator of the phase lag between the force and displacement histories, while the standard viscoelastic model predicts a negligible dependency of the moduli on the loading frequency (up to 20 Hz). The poroviscoelastic model isolates the contribution of fluid-structure interactions to the tissue response from that of the ECM solid structure, when calculating the perturbation term h̃(t) in Eq. (14) from Eq. (13). The model predicted greater values for the ECM viscosity than the ECM elasticity (i.e., high damping ratios). The GAG molecules may therefore predominate high damping in the tissue. The vocal folds undergo high frequency self-sustained oscillations in the physiological conditions, showing an over-damped oscillatory response. Their GAGs content is considerably greater than that in similar tissues such as skin (Gray et al., 2000). Hence, the GAG molecules regulate the nanoscale viscoelasticity of vocal folds at high-frequency oscillations.
Fig. 7.

Distributions of dynamic moduli versus frequency for porcine vocal fold lamina propria based on two models (the lines are used to show trends).
5.3. Validation study
The accuracy of the proposed methodology was assessed using a polymer model (Dragon Skin, Smooth-On Inc., Easton, PA). The silicone material was subjected to the experimental procedure described in Section 2.2. The viscoelastic properties for the silicone material can be found in the literature (Miri et al., 2012b), measured using a shear rheometry. A viscoelastic approximation was applied by setting φ∘ → 0 in our script. The bulk elastic modulus calculated by Eq. (8) was found to be in a range of ~ 55 to ~ 65 kPa, in agreement with the baseline data (Miri et al., 2012b). The viscoelastic moduli, determined by Eq. (14), ranges from ~ 11 to ~ 38 kPa with significant variations over the frequency range of interest.
The frequency-dependent viscoelastic moduli of the silicone were dissimilar to the bulk elastic modulus. The lower stiffness values can be due to the effect of size-dependent forces (e.g., adhesion forces) acting between the silicone surface and the probe tip. The mechanical characterization of engineering materials should yield identical results at the micrometer and nanometer scales; however, biological soft tissues exhibit different properties. The ECM molecules in soft tissues display diverse properties at different length scales because of their structural hierarchy. This supports our multiscale methodology for the characterization of soft tissue viscoelasticity.
5.4. Model limitations
The model provides a preliminary estimation of the viscoelastic properties of the vocal fold tissue in its natural configuration, at the nanometer scale. The model assumes small deformations for the ECM structure under indentation loading. The FEA of the creep loading gives strain values larger than 20%, for the material points under the probe, which necessitates a nonlinear model. The small-deformation approximation applies in the nanoscale displacements because the tissue has had enough time to relieve stress concentrations. Another model limitation can be due to the 2D simulation made in the FEA, which was used to estimate the characteristic length, L.
The vocal fold tissue has a high degree of anisotropy along its longitudinal axis during phonation (Miri et al., 2013). Our previous study (Heris et al., 2013) reported distinct data from AFM-based indentation of porcine vocal folds along two perpendicular planes. However, the present study neglects the intrinsic anisotropy in the tissue microstructure. The structural anisotropy yields an anisotropic diffusivity constant as the pore shapes are not isotropic. This is of great importance regarding the physiological functions of the vocal folds. Anisotropic poroelasticity will be investigated in future studies.
6. Conclusions
Frequency-dependent viscoelastic moduli of vocal fold ECM at nanoscale were estimated using a systematic approach that included indentation testing and poroviscoelastic modeling. Creep tests followed by sinusoidal displacement oscillations were imposed on thin slices of porcine vocal fold. Closed-form solutions were derived to simulate the creep response, at the micrometer scale, and the oscillation response, at the nanometer scale. The sinusoidal displacement data were used to obtain nanoscale viscoelastic response of the ECM structure. The predictions of the present model were considerably greater than those of the standard solid model. The proposed model separates the contribution of fluid-solid interactions to the tissue response from that of the ECM viscoelasticity.
A linear correlation between the spatial distributions of the viscoelastic moduli and those of the volume fractions of the GAGs was found in the porcine vocal fold. Regarding the similar structures between human and porcine vocal folds, we concluded that GAGs control the nanoscale viscoelasticity of vocal folds. The results support the use of HA-based implants for the restoration of vocal fold viscoelasticity. For that purpose, the present study offers an accurate tool to characterize the relevant biomaterials.
Supplementary Material
Highlights.
Nanoindentation of porcine vocal fold tissue using atomic force microscopy
Separation of flow-dependent poroelasticity from nanoscale viscoelasticity of the tissue
Determination of viscoelastic moduli of extracellular matrix proteins
Acknowledgments
This work was supported by National Institute of Health, grant R01-DC005788 (Principal Investigator: Luc Mongeau). The authors thank Prof. François Barthelat (Department of Mechanical Engineering, McGill University) for sharing his atomic force microscope. The first author specially thanks Mr. Hadi T. Nia (Department of Mechanical Engineering, Massachusetts Institute of Technology) for his valuable comments.
Appendix
The flow velocity of the interstitial fluid, u̇f, is defined in terms of a volume flux passing throughout an effective cross-section. This representative cross-section should include the overall features of the ECM structure and its length scale must be larger than the pore size (i.e., micrometer scale, Fig. 6a). The hydrodynamic pore pressure, p, is related to the flow velocity via Darcy’s law (Biot, 1941)
| (15) |
where κ(m2/Pa.s) is the hydraulic permeability (Chin et al., 2011), an scalar quantity which depends upon the pore geometry (Fig. 6a). In the context of soft tissues, the pores are the interstices between the ECM macromolecules. The solid displacement vector, us, is added to the interstitial fluid displacement to yield the total displacement field (i.e., u = us +uf). The tissue strain along the local coordinate defined in Fig. 1a, i.e., x-direction, is then defined as
| (16) |
The compressive strain was assumed to be positive (εx ≥ 0), which for the problem geometry in Fig. 1 yields the volume change (εx ≪ 1)
| (17) |
where V (= A×L) is the sample volume, and the subscript ∘ indicates the associated quantity in the reference configuration. Because volume changes are mostly associated with fluid mass variation, a useful relation is obtained
| (18) |
where φ denotes the fluid volume fraction (0 <φ< 1). The averaged force over the effective cross-section area yields the stress tensor, σ. The elastic modulus of the solid phase is defined as the tangent of the stress-strain curve, at instantaneous mechanical equilibrium,
| (19) |
The total stress is obtained from the linear summation of the mechanical stresses in both solid and fluid components (Biot, 1941), i.e.,
| (20) |
The variations of the fluid volume versus volumetric changes are neglected here. Another governing equation is obtained by imposition of mechanical equilibrium within an arbitrary material element. Neglecting inertial forces, the equation of conservation of linear momentum is
| (21) |
Because the changes in fluid volume with mechanical loading are much smaller than pressure changes (Miri et al., 2012a), the differentiation of φ with respect to x is neglected in Eq. (21). Furthermore, the equation of continuity is (Biot, 1941)
| (22) |
Eqs. (15) to (22) constitute the fundamental equations of poroelasticity. Manipulation of the above coupled equations yields the evolution of strain over time (Chin et al., 2011),
| (23) |
Eq. (23) is a diffusion equation with a nonlinear component. To simplify Eq. (23), a diffusion constant, D =Eκ(1 − εx)/φ, is assumed at each mechanical equilibrium state (Chin et al., 2011). The present formulation defines the classical diffusion problem (Galli and Oyen, 2009).
Footnotes
Publisher's Disclaimer: This is a PDF file of an unedited manuscript that has been accepted for publication. As a service to our customers we are providing this early version of the manuscript. The manuscript will undergo copyediting, typesetting, and review of the resulting proof before it is published in its final citable form. Please note that during the production process errors may be discovered which could affect the content, and all legal disclaimers that apply to the journal pertain.
References
- Alipour F, Jaiswal S, Vigmostad S. Vocal fold elasticity in the pig, sheep, and cow larynges. Journal of Voice. 2011;25:130–136. doi: 10.1016/j.jvoice.2009.09.002. [DOI] [PMC free article] [PubMed] [Google Scholar]
- Biot MA. General theory of three-dimensional consolidation. Journal of Applied Physics. 1941;12:155–164. [Google Scholar]
- Chan RW, Rodriguez ML. A simple-shear rheometer for linear viscoelastic characterization of vocal fold tissues at phonatory frequencies. Journal of the Acoustical Society of America. 2008;124:1207–1219. doi: 10.1121/1.2946715. [DOI] [PMC free article] [PubMed] [Google Scholar]
- Chhetri DK, Zhang Z, Neubauer J. Measurement of Young’s modulus of vocal folds by indentation. Journal of Voice. 2011;25:1–7. doi: 10.1016/j.jvoice.2009.09.005. [DOI] [PMC free article] [PubMed] [Google Scholar]
- Chin HC, Khayat G, Quinn TM. Improved characterization of cartilage mechanical properties using a combination of stress relaxation and creep. Journal of Biomechanics. 2011;44:198–201. doi: 10.1016/j.jbiomech.2010.09.006. [DOI] [PubMed] [Google Scholar]
- Galli M, Oyen ML. Fast identification of poroelastic parameters from indentation tests. Computer Modeling in Engineering and Sciences. 2009;48:241–270. [Google Scholar]
- Gray SD, Titze IR, Alipour F, Hammond TH. Biomechanical and histologic observations of vocal fold fibrous proteins. Ann Otol Rhinol Laryngol. 2000;109:77–85. doi: 10.1177/000348940010900115. [DOI] [PubMed] [Google Scholar]
- Gray SD, Titze IR, Chan RW, Hammond TH. Vocal fold proteoglycans and their influence on biomechanics. Laryngoscope. 1999;109:845–854. doi: 10.1097/00005537-199906000-00001. [DOI] [PubMed] [Google Scholar]
- Hahn MS, Kobler JB, Zeitels SM, Langer R. Quantitative and comparative studies of the vocal fold extracellular matrix I: Elastic fibers and hyaluronic acid. Ann Otol Rhinol Laryngol. 2006a;115:156–164. doi: 10.1177/000348940611500213. [DOI] [PubMed] [Google Scholar]
- Hahn MS, Kobler JB, Zeitels SM, Langer R. Quantitative and comparative studies of the vocal fold extracellular matrix II: collagen. Ann Otol Rhinol Laryngol. 2006b;115:225–232. doi: 10.1177/000348940611500311. [DOI] [PubMed] [Google Scholar]
- Heris HK, Miri AK, Tripathy U, Barthelat F, Mongeau L. Indentation of poroviscoelastic vocal fold tissue using an atomic force microscope. Journal of the Mechanical Behavior of Biomedical Materials. 2013 doi: 10.1016/j.jmbbm.2013.05.026. http://dx.doi.org/10.1016/j.jmbbm.2013.1005.1026. [DOI] [PMC free article] [PubMed]
- Heris HK, Rahmat M, Mongeau L. Characterization of a hierarchical network of hyaluronic acid–gelatin composite for use as a smart injectable biomaterial. Macromolecular Bioscience. 2011 doi: 10.1002/mabi.201100335. [DOI] [PMC free article] [PubMed] [Google Scholar]
- Johnson KL. Contact mechanics. Cambridge University Press; 1987. [Google Scholar]
- Mahaffy RE, Park S, Gerde E, Käs J, Shih CK. Quantitative analysis of the viscoelastic properties of thin regions of fibroblasts using atomic force microscopy. Biophysical Journal. 2004;86:1777–1793. doi: 10.1016/S0006-3495(04)74245-9. [DOI] [PMC free article] [PubMed] [Google Scholar]
- McConney ME, Singamaneni S, Tsukruk VV. Probing Soft Matter with the Atomic Force Microscopies: Imaging and Force Spectroscopy. Polymer Reviews. 2010;50:235–286. [Google Scholar]
- Miri AK, Barthelat F, Mongeau L. Effects of dehydration on the viscoelastic properties of vocal folds in large deformations. Journal of Voice. 2012a;26:688–697. doi: 10.1016/j.jvoice.2011.09.003. [DOI] [PMC free article] [PubMed] [Google Scholar]
- Miri AK, Heris HK, Tripathy U, Wiseman PW, Mongeau L. Microstructural characterization of vocal folds toward a strain-energy model of collagen remodeling. Acta Biomaterialia. 2013;9:7957–7967. doi: 10.1016/j.actbio.2013.04.044. [DOI] [PMC free article] [PubMed] [Google Scholar]
- Miri AK, Mongrain R, Chen LX, Mongeau L. Quantitative assessment of the anisotropy of vocal fold tissue using shear rheometry and traction testing. Journal of Biomechanics. 2012b;45:2943–2946. doi: 10.1016/j.jbiomech.2012.08.030. [DOI] [PMC free article] [PubMed] [Google Scholar]
- Miri AK, Tripathy U, Mongeau L, Wiseman PW. Nonlinear laser scanning microscopy of human vocal folds. The Laryngoscope. 2012c;122:356–363. doi: 10.1002/lary.22460. [DOI] [PMC free article] [PubMed] [Google Scholar]
- Nia Hadi T, Bozchalooi Iman S, Li Y, Han L, Hung HH, Frank E, Youcef-Toumi K, Ortiz C, Grodzinsky A. High-Bandwidth AFM-Based Rheology Reveals that Cartilage is Most Sensitive to High Loading Rates at Early Stages of Impairment. Biophysical Journal. 2013;104:1529–1537. doi: 10.1016/j.bpj.2013.02.048. [DOI] [PMC free article] [PubMed] [Google Scholar]
- Nia Hadi T, Han L, Li Y, Ortiz C, Grodzinsky A. Poroelasticity of cartilage at the nanoscale. Biophysical Journal. 2011;101:2304–2313. doi: 10.1016/j.bpj.2011.09.011. [DOI] [PMC free article] [PubMed] [Google Scholar]
- Oyen ML. Nanoindentation of Biological and Biomimetic Materials. Experimental Techniques. 2013;37:73–87. [Google Scholar]
- Tao C, Jiang JJ, Zhang Y. A fluid-saturated poroelastic model of the vocal folds with hydrated tissue. Journal of Biomechanics. 2009;42:774–780. doi: 10.1016/j.jbiomech.2008.12.006. [DOI] [PMC free article] [PubMed] [Google Scholar]
- Tripathy S, Berger EJ. Measuring Viscoelasticity of Soft Samples Using Atomic Force Microscopy. Journal of Biomechanical Engineering. 2009;131:094507. doi: 10.1115/1.3194752. [DOI] [PubMed] [Google Scholar]
Associated Data
This section collects any data citations, data availability statements, or supplementary materials included in this article.