

Abstract
Normal physiology relies on the organization of transmembrane proteins by molecular scaffolds, such as tetraspanins. Oncogenesis frequently involves changes in their organization or expression. The tetraspanin CD151 is thought to contribute to cancer progression through direct interaction with the laminin-binding integrins α3β1 and α6β1. However, this interaction cannot explain the ability of CD151 to control migration in the absence of these integrins or on non-laminin substrates. We demonstrate that CD151 can regulate tumor cell migration without direct integrin binding and that integrin-free CD151 (CD151free) correlates clinically with tumor progression and metastasis. Clustering CD151free through its integrin-binding domain promotes accumulation in areas of cell-cell contact leading to enhanced adhesion and inhibition of tumor cell motility in vitro and in vivo. CD151free clustering is a strong regulator of motility even in the absence of α3 expression but requires PKCα, suggesting that CD151 can control migration independent of its integrin associations. The histological detection of CD151free in prostate cancer correlates with poor patient outcome. When CD151free is present, patients are more likely to recur after radical prostatectomy and progression to metastatic disease is accelerated. Multivariable analysis identifies CD151free as an independent predictor of survival. Moreover, the detection of CD151free can stratify survival among patients with elevated PSA. Cumulatively these studies demonstrate that a subpopulation of CD151 exists on the surface of tumor cells that can regulate migration independent of its integrin partner. The clinical correlation of CD151free with prostate cancer progression suggests that it may contribute to the disease and predict cancer progression.
Keywords: cell migration, metastasis, prostate cancer, tumor markers and detection of metastasis, molecular diagnosis and prognosis
INTRODUCTION
Cancer metastasis typically involves the migration and invasion of disseminating tumor cells. The activity of cytokine receptors, adhesion receptors and proteases responsible for this migration, is frequently controlled through their organization within the cell membrane. Tetraspanins are key membrane scaffolding proteins responsible for this organization. Although the tetraspanins lack enzymatic activity and canonical signal-transducing capacity, their ability to organize macromolecular structures is their primary mechanism of action (1). Of the 33 tetraspanin family members, 6 have been implicated in cancer (2,3) and CD151 has been shown to be a particularly important regulator of tumor cell motility (4) and metastasis (5,6). CD151 interacts with several partners including MMP14, cadherins, immunoglobulin proteins, and integrin subunits α3 and α6, as well as other members of the tetraspanin family (1,7,8). Consequently, further elucidation of tetraspanin function requires investigation of its molecular organization and the role of specific partners. The interaction between CD151 and the laminin binding integrins α3β1 and α6β1 has been investigated in detail (reviewed in (1) and (9)). Loss of CD151(10) diminished migration on laminin while disruption of the integrin-binding domain limits spreading on laminin and tubule morphogenesis as well as tumor growth in 3D laminin-containing matrixes (11,12). Recently the CD151-integrin-laminin axis has been shown to facilitate EGF signaling (13,14). However, a number of biological activities have been associated with CD151 that are likely to involve different molecular mechanisms. These include migration on non-laminin substrates, platelet function and cell-cell adhesion. Effective approaches to investigating these functions have included genomic ablation (14–16), mutational analysis (11,17,18) and CD151-specific antibodies (6,19,20). These studies suggest that both integrin-dependent and integrin-independent roles exist for CD151 in tumor progression.
CD151 can be targeted to inhibit tumor cell motility and metastasis using the antibody mAB 1A5 (6). Treatment with mAB 1A5 prevents de-adhesion at the rear of migrating cells resulting in their immobilization and subsequent inhibition of metastatic dissemination (6). MAB 1A5, like most anti-CD151 antibodies, was generated in mice against a human antigen (20). Consequently these antibodies primarily recognize antigenic differences between human and mouse CD151. Some CD151 antibodies exhibit differential staining patterns in human tissues most likely because certain epitopes are masked by protein-protein interactions of the CD151 complex (11,21–24). Epitope mapping allows these antibodies to identify the composition of a CD151 complex. Yamada et al. (2008, (19)) used flow cytometry to map epitope binding of CD151 antibodies on CD151 mutants with substitutions at amino acid residues that are not conserved between human and mouse CD151. These studies demonstrated that several antibodies recognize an epitope on CD151 required for binding integrins including α3β1 (11). Interestingly the knockdown of α3 reduced to the overall level of CD151 but did not diminish the level of CD151 recognized by antibodies to the integrin-binding domain. This observation suggests that distinct populations of CD151 are maintained on the cell surface. One of those populations is associated with integrins wile the other is not. We will refer to these populations as CD151ITGA and CD151free respectively.
Considering the epitope-specificity of antibodies, it is likely that antibodies which recognize distinct CD151-partner complexes can provide insight into the function and clinical relevance of that CD151 subpopulation. We hypothesized that the inhibition of motility in response to mAB 1A5 was due to its ability to target a specific subpopulation of CD151 and affects its activity. Since a monovalent fragment of mAB 1A5 was unable to inhibit tumor cell motility, we predicted that this antibody mediated clustering of all, or a specific sub-population of CD151. Live-cell imaging was implemented to investigate clustering in response to antibody binding. Using the flow cytometry approach developed by Yamada et. al. we determined that mAB 1A5 recognized the integrin-binding domain on CD151 and is therefore unable to interact with integrin-bound CD151. The analysis of tumor cell migration in vivo was used to investigate the ability of mAB 1A5 to control cell motility independent of integrin α3. These investigations were extended to other antibodies that recognize the same integrin-binding domain (8C3 and 14A2.H1) or bind an unrelated site (11G5A). Finally, we determined if the presence CD151 not bound by integrins was relevant in prostate cancer progression by histological analysis of CD151free in tissue from two cohorts of prostate cancer patients.
MATERIALS AND METHODS
Cell culture, reagents and antibodies
HEp3 cells are perpetually maintained on the chick chorioallantoic membrane to retain metastatic and migratory potential (25,26). All cell lines were grown in media supplemented with pen/strep, sodium pyruvate, non-essential amino acids and 10% fetal bovine serum and cultured at 37°C in 5% CO2 incubator and passaged every 2–4 days. HEp3, NIH3T3 and HT1080 cells were maintained in DMEM. A549 cells were maintained in RPMI. The CD151 plasmids in the eGFP-N1 vector (Clontech) were received from received from Dr. Kiyo Sekiguchi (University of Osaka, Japan). Transfections of all cells were performed using Extreme Gene HD (Roche). The mAB 1A5 and the control antibody 29-7 was generated as described previously (27). The anti-CD151 antibodies 11G5A and 14H2.1 were purchased from Abcam. Anti-C151 antibody 8C3 was generously provided by Dr. Sekiguchi. Anti-α3 antibodies were purchased from Santa Cruz Biotechnology (P1B5) and Millipore. The smart pool RNAi specific to α3, PKCα, and the control siRNA was obtained from Dharmacon.
Tumor cell motility
In vitro cell migration
HEp3 and HT1080 cells were seeded in 6-well plates and allowed to attach overnight in DMEM containing 10% FBS on the following day the cells were switched to serum free/insulin free media for an additional 24 hrs. On the day of the assay the confluent monolayers were scratched with a pipet tip in order to create a uniform wound after which the cells were washed with PBS to remove any floating cells. Cultures were returned to full medium and the wound was documented at 0 hrs and 16 hrs post-scratch using a light microscope TMS-F (Nikon) equipped with a D90 SLR camera (Nikon). Wound closure (% surface area) was determined using T-scratch image analysis software (28).
In vivo cell motility
Assays were performed as previously described (6). Briefly, cells to be injected were washed 2 times with PBS and detached with 2mM EDTA. The cells were resuspended in PBS and injected IV into Day 12 chick embryos. Four days post-injection the disseminated colonies were photographed using a Lumar V12 stereomicroscope (Zeiss) equipped with a Retiga Exi camera and controlled with Volocity image acquisition software (PerkinElmer). Antibody treatments were introduced by intravenous injection one day after tumor cell injection. For visualization of the vasculature rhodamine-conjugated dextran was injected intravenously and allowed to circulate for 15 minutes prior to tissue collection. “Non-motile” colonies were defined as colonies comprised of 5 or more cells where individual cells remained in direct contact. Such non-motile colonies are compact while “motile” colonies contained a migratory cell populations dispersed in the CAM. Assays were performed with 5 animals/treatment and ≥ 5 fields/animal analyzed for colony formation. Data is represented as the % of colonies within a single animal that demonstrated a motile phenotype.
Flow cytometry
Standard flow procedure
Cells to be used in flow cytometry experiments were trypsinized with 0.25% Trypsin-EDTA and resuspended in cold Milytenyl FACs buffer (2mM EDTA, 0.5%BSA, PBS). For the analysis of cell surface expression of specific antigens the cells were washed 2 times with FACs buffer and then stained with the specific primary antibodies for 1hr on ice. Following incubation with the primary antibody the cells were washed 2 times with cold FACs buffer and then incubated with species-specific, fluorophore-conjugated secondary antibody.
Epitope mapping using flow cytometry
NIH 3T3 were transfected with the CD151 human/mouse GFP substitution mutants (19) using Fugene HD (Roche). Transfected cells were prepared for flow cytometry as described above 24 hr after transfection. Cells were stained with anti-CD151 antibodies (mAB 1A5, 8C3, 14A2H.1 and 11G5A) on ice for 1 hr followed two washes and incubation with Alexa 647-conjugated secondary antibody (1 hr on ice). The stained cells were washed twice with cold FACs buffer resuspended and analyzed by two-color flow cytometry. Untransfected controls and empty vector (pEGFP N1) transfections were used as a no color and GFP only positive controls respectively. An isotype IgG was used for as a control for gating purposes. In order to analyze the GFP-positive and Alexa 647 double-positive populations, the cells were gated for GFP expression to identify GFP expressing cells which were subsequently analyzed for their binding of Alexa 647-conjugated antibody (which represents binding of the respective anti-CD151 antibody). The data is presented as dot plots with the detection of GFP graphed on the X-axis and the detection of Alexa 647 plotted on the Y-axis.
Immunoprecipitation, immunoblotting, and immunodepletion
Immunopreciptation
HEp3 cells and A549 cells were lysed in either 1% (vol/vol) Triton X-100 lysis buffer or 1% (vol/vol) Brij-99 lysis buffer on ice for 30 minutes. The samples were cleared by centrifugation (14,000 rpm, 15 min) and cleared lysates were transferred to new tubes and stored at 4°. Protein concentrations were determined by BCA (Pierce). Immunoprecipitations were performed by incubating 2 μg of the antibody with 1 mg total cell lysate over night at 4° with end-to-end rotation. The following day the protein/antibody complexes were bound to Protein A/G sepharose beads (Fisher Scientific) for 4 hours at 4° with end-to-end rotation. Beads were collected by centrifugation (8000 rpm, 30 secs) washed with lysis buffer and stored together with unbound material for further analysis. Immunoprecipitated complexes were eluted in 100 μl Lamelli sample buffer and evaluated by immunoblotting. For each sample equal amounts of protein were loaded into SDS-PAGE and blotted onto polyvinylidene fluoride membranes (PVDF, Millipore). Protein detection was performed with enhanced chemiluminescence (ECL, Pierce) after blocking (5% non-fat milk from powder in PBS, 0.05% Tween-20) and incubation (O/N 4°C) with antibodies prepared in blocking buffer.
Immunodepletion of mAB 1A5-bound CD151
1) HEp3 or A549 cells were lysed in 1% Triton X-100 lysis buffer and incubated with 2 μg of antibody for two hr at 4° with end-to-end rotation. The immunecomplexes were then captured with Protein-G sepharose beads for 1hr at 4°. This process was repeated 3 times using the unbound lysate. Each immunodepletion was evaluated by immunoblotting as described above. 2) For immunodepletion of mAB 1A5 bound to live cells HEp3 and A549 cells were treated overnight with mAB 1A5 or control antibody at a concentration of 2 μg/ml. Antibody-bound cells were lysed 24 hr later and antibody-bound CD151 was immunodepleted with protein-G sepahrose beads. The unbound material was depleted 2 additional times with protein-G beads and bound as well as unbound material was evaluated by immunoblotting.
Cell Surface Biotinylation
For cell surface labeling confluent HEp3 cells were treated with antibody for 1 hr on ice and then washed 3 times with cold PBS. Cultures were subsequently biotinylated with sulfosuccinimidyl-6-[biotin-amido]hexanoate using the EZ-Link Sulfo-NHS-Biotinylation Kit (Thermo Scientific) according to manufacturer’s instructions. Cells were lysed in either 1% Brij 99 followed by extraction of the insoluble material with RIPA buffer Immunoprecipitation was performed as described above. Biotinylated proteins were detected with peroxidase-conjugated strepavidin.
Live cell imaging and immunofluorescent staining
In order to visualize CD151 localization HEp3 cells expressing GFP-tagged CD151 were imaged with a fully automated microscope (BX61, Olympus) equipped with a digital camera (Orca ER, Hammamatsu) every 5 minutes for 1hr. Cells were subsequently treated with Alexa 647-conjugated mAB 1A5 and imaging continued for an additional 3 hours. Movies were analyzed and complied using Volocity Image Acquisition and Analysis Software (PerkinElmer).
Immunofluorescent detection of anti-CD151 antibodies bound to cultured cells was accomplished by staining paraformaldehyde fixed cells with Alexa 546-conjugated secondary antibody. Fibronectin fibrilogenesis was detected on paraformaldehyde fixed cells by immunofluorescent staining with rabbit anti-fibronectin antibody in conjunction with Alexa 546-conjugated anti-rabbit secondary antibodies. Images were captured with a fluorescent microscope using Volocity Image Acquisition and Analysis Software (PerkinElmer).
Platelet aggregation assay
Platelet aggregation assays were performed as previously described (29). Blood to be used from donors was collected and mixed 1:10 with 3.8% Sodium Citrate Buffer and spun at 160 × g for 30 minutes. The platelet rich plasma (PRP) was counted and resuspended at a concentration of 2–4 ×10⁸ cells/mL. Aggregation of PRP was performed on a BIO/DATA Corporation PAP-4 aggregometer at 37°C with stirring (1200rpm). Individual treatments were added as outlined in the text and turbidity analyzed compared to the aggregation of platelet poor plasma (PPP).
Cell clustering assay
Suspension cultures of Jurkat and U937 cells were treated with control antibody or mAB 1A5 overnight using serum free culture medium. Clustering formation was documented at 100X magnification with a digital camera (Nikon D90) mounted to a phase-contrast microscope.
Collagen contraction assays
HEp3 cells and their treatments were mixed with neutralized collagen solution (1 mg/ml in 1X cell culture medium) at a concentration of 0.4 million cells/ml. The collagen/cell mixture was placed in the wells of a 24-well plate, allowed to solidify at 37°C and cultured for 48 hrs before analysis. The collagen was subsequently released from the wall of the culture well using a metal spatula and contraction of the collagen plug was documented 1 hr after release. The collagen plugs were documented at 100X magnification with a digital camera (Nikon D90) mounted to a phase-contract microscope.
Patients and samples
Two retrospective cohorts of patients with PCa were utilized in this study. The first cohort (cohort #1) of 99 cases underwent radical retropubic prostatectomy (RRP) between 1994–1998 at the London Health Sciences Centre with pathological stage pT2 – pT3 PCa (Supplemental Tables 1 and 2). A second cohort (cohort #2) of 38 cases was comprised of diagnostic biopsy specimens from PCa patients at the same center who did not undergo RRP and developed metastatic disease during follow-up (Supplemental Table 3). Pathological staging was re-evaluated according to TNM criteria (AJCC 2002). Patient characteristics and disease-related outcomes were obtained from a review of the medical records (Supplemental Tables 1–3). This study obtained approval from an independent local Ethics Committee (UWO REB #15084E) and obtained the informed consent from all patients for the research use of their tissues.
Immunohistochemistry
Formalin-fixed, paraffin-embedded tissue blocks were cut into 4 μm sections and mounted onto positively charged glass slides. The tissue was deparaffinized and rehydrated using the xylene, graded ethanol, and water method. A two-step epitope retrieval was performed whereby tissue sections were boiled in the microwave in 10 mM Sodium Citrate, 0.05% Tween 20 pH 6.0. The slides were then allowed to cool down, washed with PBS 0.2% Triton-X (PBST), and incubated with pre-warmed pepsin (digest-all™ 3, Invitrogen) for 3 minutes. After washing with PBST, the specimens were stained using the UltraVision Detection System (Thermo-Scientific). CD151 mAb 1A5 was diluted 1:800 in 1% BSA in PBS, CD151 mAb 11G5a (Abcam) was diluted 1:100 in 1% BSA in PBS and α3β1 antibody P1B5 was diluted 1:250 in 1% BSA in PBS. Samples were then counterstained with Hematoxylin and mounted with Cytoseal (Thermo-Scientific). Negative controls were prepared using the identical treatment with omission of the primary antibody. Non-immune mouse IgG was used as an additional negative control.
CD151 expression analysis
CD151 expression in the RRP and biopsy cohorts detected by immunohistochemistry was categorized as negative (score=0), weakly positive (score=1), moderately positive (score=2) or strongly positive (score=3) independently by two pathologists who had no knowledge of the patient’s clinical status. A consensus was reached where any discrepancy was identified. To determine the statistical significance of mAb 1A5 immunoreactivity, specimens were divided into negative (score=0) and positive (score=1–3). CD151 protein expression analysis was performed in cancerous areas as well as, benign tissue adjacent and distant from areas of tumour. Biochemical recurrence after RRP was defined as two consecutive PSA measurements greater than 0.2 ng/mL. Bone metastasis was defined as presence of metastatic lesions on a bone scan.
Profiling of CD151 mRNA expression in normal and prostate cancer tissue was accomplished using publicly available data obtained from the NCBI Gene Expression Omnibus (GEO) as well as The Cancer Genome Atlas (TCGA) via The cBio Cancer Genomics Portal (30). These included GDS2545 (n=171) (31), GDS1439 (n=19) (32), GSE6099 (n=102) (33) and the prostate adenocarcinoma dataset from TCGA (34). Datasets were categorized according to their clinical diagnosis and analyzed by SHANNA ANOVA with post-test analysis for linear trend. CD151 expression levels were extracted from publicly available expression dataset GDS3113 (n=3/tissue) (35) to demonstrate relative levels of CD151 expression in prostate compared to other tissues.
Statistical Analysis
Statistical analyses were performed using SAS version 9.2 (SAS Institute Inc., Cary, NC), SPSS 20 (IBM), and Graphpad Prism (Graphpad software, La Jolla, CA). Experimental groups in migrations assays were compared to the control groups using a non-parametric Mann-Whitney test. The primary endpoint for cohort #1 is biochemical recurrence-free survival and the primary endpoint for cohort #2 is metastasis-free survival. Correlations between mAB 1A5 immunoreactivity and biochemical recurrence-free survival in malignant areas compared to benign areas were analyzed by McNemar’s chi-square test. Kaplan–Meier plots were used to assess biochemical recurrence-free and metastasis-free survival. Group comparisons were made using the log-rank test. The Cox proportional hazard model was applied for multivariable analysis. In all statistical analyses, a two-sided, p<0.05 was considered statistically significant. Graphical representation of statistical significance included * (p< 0.05), ** (p< 0.01) and *** (p<0.001).
Image Processing and Analysis
Included images are representative of at least three replicate experiments. Fluorescent images are false-colored to represent specific labels. The brightness of images captured of in vivo experiments was uniformly adjusted for purposes of clarity. Where indicated the images were cropped and scaled without change in resolution. Quantitation of signal was performed on raw image files in Volocity Image Acquisition and Analysis Software (PerkinElmer) prior to creating the figures.
RESULTS
CD151 clusters and accumulates at areas of cell-cell contact in response to mAB 1A5 binding
Given that tetraspanins facilitate macromolecular organization within cellular membranes, we hypothesized that the ability of anti-CD151 antibodies to influence migration involved changes in CD151 localization. This possibility was evaluated by analyzing changes in CD151 surface distribution in response to antibody binding (Fig. 1). NIH3T3 cells transfected with human CD151-GFP exhibited a uniform surface distribution of CD151 when cultured at subconfluent densities (Fig. 1A and Bi/i′). Upon antibody binding CD151-GFP re-organized into punctate structures on the cell surface (Fig 1A and Bii) and accumulated at areas of cell-cell contact (Fig. 1A and Biii). To confirm that antibody-bound CD151-GFP complexes were on the cell surface, a TRITC-conjugated secondary antibody was used to detect mAB 1A5 on the cell surface of intact cells fixed 2 hr after antibody treatment. Similar observations were made with HELA, HEp3, HT1080 and A549 cells. This data suggests that mAB 1A5 ligation of CD151 promotes the formation of macromolecular complexes (clustering) on the cell surface. Clustering of tetraspanins is known to cause a change in detergent solubility (1). To determine if antibody-mediated clustering induced a change in solubility we performed cell surface biotinylation and differential detergent extraction of HEp3 cells treated with mAB 1A5 (Fig. 1C). Indeed, cell surface CD151 (biotinylated-CD151, arrow) became resistant to extraction by Brij99 and was solubilized by subsequent RIPA extraction. The increase in relative abundance of biotinylated CD151 in the RIPA re-extraction confirms that the clustered tetraspanin accumulated in detergent-resistant complexes on the cell surface.
Figure 1. Cell surface clustering of CD151 in response to mAB 1A5.

The cell surface distribution of CD151 was visualized by fluorescent microscopy in NIH3T3 cells after transfection with CD151-GFP and culture in the absence or presence of mAB 1A5 (2μg/ml) for 2hr. (A) CD151-GFP visualized in the absence (left panel) or presence of mAB 1A5 (right panels, 2μg/ml for 2hr). Surface bound antibody was detected using TRIC-conjugated anti-mouse IgG post fixation. Insets in A emphasizing general cell surface (i and ii) v.s. areas of cell-cell contact (i′ and iii) are magnified in (B). (C) Surface CD151 was detected in sequential Brij99 and RIPA extractions with avidin-HRP after biotinylation of surface proteins and immunoprecipitating the tetraspanin from HEp3 cells cultured in the presence of a control IgG or mAB 1A5 for 24hr. (D) Live cell imaging was used to evaluate changes in CD151 distribution in response to mAB 1A5 binding. A549 cells transfected with CD151-GFP (green) were imaged every 5 min for 2 hr with the addition of Alexa 546-conjugated mAB 1A5 (red) added at t=60 min and flushed from the system at t=80 min.
When cell densities were sufficient to allow for cell-cell contact, antibody-binding induced clustering of CD151 at areas of cell-cell contact (Fig. 1Biii) rather than at randomly distributed surface aggregates. To further assess the recruitment of CD151 to areas of cell contact, live-cell microscopy of densely cultured A549 cells expressing CD151-GFP was performed during the addition of Alexa 546-conjugated mAB 1A5 (Fig. 1D). A549 cells have intact cell-cell contacts where CD151 is readily visible. Addition of mAB 1A5 caused rapid accumulation of both labeled antibody and CD151-GFP in areas of cell-cell contact (Fig. 1D “0 min” v.s. “120 min”). The accumulation of CD151 at areas of cell-cell contact was quantified by mapping pixel intensity from time 0 to 120 min. in the GFP channel (CD151-GFP) and the Alexa 546 channel across a reference line. Although A549 cells have well established cell-cell contacts, similar observations were made for epithelial-derived cancer lines that lack stable cell-cell contacts such as the HNSCC HEp3 during in vitro culture (Suppl. Movie 1) and in vivo tumor growth (Suppl. Fig. 1). Thus clustered CD151 accumulated at areas of cell-cell contact in all models and experimental settings.
Antibody-induced clustering promotes an adhesive phenotype
We previously observed that mAB 1A5 prevents detachment at the rear of migrating cells thereby inhibiting tumor cell migration and metastasis in vivo (6). Evaluation of HEp3 migration at increasing concentrations of mAB 1A5 demonstrated a dose-dependent inhibition of migration in vitro (Fig. 2A) and in vivo (Fig. 2B). In the presence of control antibody, GFP-expressing HEp3 form metastatic colonies comprised of widely spaced individual cells that are disseminating freely into the surrounding tissue. In contrast, treatment with mAB 1A5 limited cell motility resulting in compact colonies at concentrations as low as 0.5μg antibody/animal (Fig. 2B, upper right panel). The ability to immobilize tumor cells in vivo as such low antibody concentrations together with previous observed inhibition of detachment (6) suggests that the tetraspanin clustering mediates a gain of adhesive function.
Figure 2. Antibody-mediated clustering promotes an adhesive phenotype.

(A) Dose-dependent inhibition of HEp3 cell migration in response to mAB 1A5 using an in vitro wound healing assay. (B) Dose-dependent inhibition of HEp3 cell migration in the CAM of chick embryos in response to mAB 1A5 treatment. (C) Collagen contraction by HT1080 cells in response to mAB 1A5 when compared to control IgG, inhibition of MMP activity (GM6001) and blocking of collagen binding (α2β1). (D) Fibronectin fibrilogenesis in response to mAB 1A5 or control IgG treatment as detected by immunofluorescent staining of fibronectin fibrils. (E) Platelet aggregation in response to mAB 1A5 treatment in the presence or absence of RGDS peptides to block integrin-mediated adhesions.
To confirm that CD151 clustering in response to mAB 1A5 induces adhesion, we evaluated a range of cellular behaviors dependent upon adhesion including collagen contraction, fibronectin fibrilogenesis, platelet aggregation and clustering of non-adherent cells. Collagen contraction assays performed in the presence of mAB 1A5 demonstrated that CD151 clustering promotes collagen contraction when compared to cells treated with the control antibody (Fig. 2C). This contrasts with the inhibition of collagen contraction by agents that inhibit matrix remodeling by MMPs (GM6001) or block integrin-mediated adhesion to collagen (anti-α2β1 integrin). Fibronectin fibrilogenesis, an integrin-dependent process (36), was evaluated in HT1080 cells. These cells exhibit very limited fibril assembly during routine culture but treatment with mAB 1A5 resulted in the formation of visible fibrils compared to the control IgG treated cells (Fig. 2D). Platelet aggregation is an integrin-dependent process stimulated by collagen binding or thrombin-mediated protease activated receptors (PARs) (37). Platelets express an abundance of CD151 where it contributes functionally to platelet aggregation via αIIbβ3 (15). Treatment with mAB 1A5 stimulated dose-dependent platelet aggregation which could be prevented with integrin-blocking cyclic RGDS peptide suggesting ligand-specific adhesion through integrins (Fig. 2E). Lastly, antibody-binding promoted clustering of lymphoma (U937) and leukemia (Jurkat) cells (Suppl. Fig. 2A and B). Staining of suspended cells with mAB 1A5 after fixation demonstrates uniform surface distribution of CD151 (post-fixation, Suppl. Fig. 2B). In contrast, treatment of the cells with mAB 1A5 prior to fixation induced clustering of the cells and resulted in accumulation of the antibody-CD151 complex at areas of cell-cell contact similar to what was observed for adherent cells (Fig. 1). These observations consistently demonstrate the clustering of CD151 to promote cell adhesion.
MAB1A5 binds CD151 not associated with integrin α3 (CD151free)
The ability of CD151 to contribute to adhesion and motility on laminin through direct interaction with the laminin-binding integrins α3β1 and α6β1 is well established (10,11). However, much of the adhesive behavior described above did not involve laminin and adhesion to collagen, assembly of fibronectin, and the aggregation of platelets (Fig. 2C–E) does not involve integrins that contain the α3 or α6 subunits. These observations suggest that CD151 clustering and biological activity in response to mAB 1A5 was independent of its association with laminin-binding integrins. Yamada et. al. (19) demonstrated that several CD151 antibodies recognize the integrin-binding domain of CD151 and only bind CD151 that is dissociated from its integrin partners (CD151free). Together, these observations suggest that an integrin-independent mechanism might be involved in the regulation of adhesion by CD151.
To determine if mAB 1A5 selectively recognizes CD151free vs CD151ITGA, its ability to co-immunoprecipitate an integrin partner was evaluated. A comparison was made with an antibody specific for the integrin binding domain which cannot precipitate the integrins (8C3) and an antibody that binds outside this domain and readily precipitates the integrin partners (11G5A) (19). Since our principle tumor model (HEp3) is nearly devoid of α6, we evaluated integrin interactions primarily by monitoring α3. Immunoprecipitates of CD151 from TX-100 lysates of A549 (Fig. 3A) and HEp3 cells (Suppl. Fig. 3) were evaluated for the presence of α3 by immunoblotting. The integrin subunit α3 co-immunoprecipitated with CD151 bound by mAB 11G5A but not 1A5 or 8C3 (Fig. 3A). Similar observations were made in immunoprecipitations from HEp3 cells (Suppl. Fig. 3). To determine if mAB 1A5 bound the CD151/α3β1 complex in intact cells, we treated A549 cells overnight with mAB 1A5 (2μg/ml) and lysed the cultures in Triton X-100 lysis buffer after removing all unbound antibody. The cell lysate was immuno-depleted with protein-G sepharose beads in three sequential incubations and the presence of α3 and CD151 was subsequently evaluated in both the bound and unbound fractions. Antibody-bound CD151 was removed in the first round of immuno-depletion while α3 remained in the unbound fraction. To confirm that the CD151 which remained in the unbound fraction remained associated with α3, we immunoprecipitated the integrin with mAB P1B5 and evaluated both bound and unbound fractions for α3 and CD151 (Fig. 3C). The majority of CD151 in the lysate co-immunoprecipitated with α3. Since mAB 1A5 failed to co-precipitate α3 and the integrin remained associated with CD151 not bound by the antibody we conclude that mAB 1A5 only binds CD151 that is not engaged with α3.
Figure 3. MAB 1A5 binds to CD151 not engaged with integrin α3.

(A) Immunoblot of α3 and CD151 after immunoprecipitation of the tetraspanin from A549 cell lysates (Triton X-100) using non-specific mouse antibody (cIgG) and three distinct antibodies against CD151 (1A5, 8C3, and 11G5a). (B) A549 cells were culture in the presence of mAB 1A5 for 24 hr. Cell lysates were generated with Triton X-100 and antibody bound CD151 was depleted from the lysate in three sequential incubations with immobilized Protein-G. Bound and unbound fractions were analyzed for α3 and CD151 by immunoblotting. (C) The integrin subunit α3 was immunoprecipitated from the unbound fraction of the 3rd depletion from (B) with anti-α3 (P1B5) and this sample was evaluated for the presence of α3 and co-precipitated CD151 by immunoblotting. “TCL” refers to Total Cell Lysate while IgG refers to normal mouse included as a reference for the IgG band (*).
Monoclonal antibody 1A5 specifically recognizes the integrin-binding domain of CD151
The integrin-binding domain of CD151 includes the 194QRD196 sequence of its large extracellular loop (11). Anti-CD151 antibodies that are unable to precipitate the CD151/α3β1 complex frequently bind this domain (38). Yamada and colleagues used 2-color flow cytometry to map epitope-binding of human-specific anti-CD151 antibodies according to their reactivity with CD151 mutants in which twelve residues across the large extracellular loop (LEL) of the human protein were substituted with their mouse counterpart (19)(Suppl. Fig. 4A and B). We implemented a similar approach to determine which residues of CD151 are involved in antigen recognition by mAB 1A5. GFP-fusions of the human-mouse CD151 substitution mutants were transiently expressed in NIH3T3 cells and subsequently stained with anti-CD151 antibody. Flow cytometry was used to detect cells positive for both GFP and Alexa 647 (Fig. 4). This analysis was performed for all substitution mutants (Suppl. Fig. 4D). mAB 1A5 bound every substitution mutant except the 194QRD196 mutant in which the glutamine at position 194 is mutated to a lysine. This analysis was done in parallel with two antibodies previously shown to interact with this domain (8C3 and 14A2.H1) and contrasted to an antibody known not to bind to this region (11G5A, Fig. 4). These observations confirm that mAB 1A5 binds CD151 through the integrin-binding domain containing the 194QRD196 sequence.
Figure 4. MAb 1A5 recognizes the integrin-binding domain of CD151.
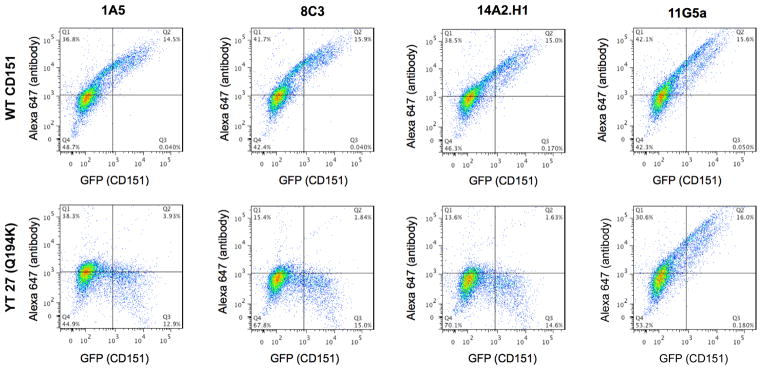
Two-color flow cytometry of the CD151 human/mouse substitution mutants was used to evaluate what epitope on CD151 is required for mAB 1A5 binding. NIH3T3 cells were transiently transfected with WT or mutant CD151-GFP constructs. Transgene expression was detected using GFP while antibody binding was detected using an Alexa 647-conjugate anti-mouse IgG. A comparison is made between WT CD151 and the YT 27 (Q194K) mutant which disrupts binding with the α3 integrin subunit. MAB 1A5 is compared to two antibodies known for their inability to bind this mutant (8C3 and 14A2.H1) and one antibody whose binding is unaffected by this mutation (11G5A). A loss of antibody binding is represented by a decrease in the percentage of GFP and Alexa 647 double positive cells in quadrant (Q2). The full panel of human/mouse substitution mutants is shown in supplemental figure 4.
Antibodies that recognize the integrin-binding domain of CD151 can inhibit tumor cell motility in vivo
Yamada et. al. (19) stratified anti-CD151 antibodies according their epitope specificity. MAB 1A5 belongs to “group I” which contains antibodies that specifically recognize CD151free because they bind the integrin binding domain and fail to immunoprecipitate α3. Since mAB 8C3 and 1A5 share epitope specificity we hypothesized that they might also share the ability to cluster the tetraspanin at areas of cell-cell contact. Live-cell imaging of A549 cells expressing CD151-GFP confirmed that mAB 8C3 but not 11G5A can cluster the tetraspanin (Suppl. Fig. 5). Since antibodies in “Group I” share both domain-specificity and the ability to cluster CD151, we explored the possibility that these antibodies specific for CD151free can control tumor cell migration. To achieve this, HEp3-GFP cells injected I.V. into chick embryos were treated with antibodies specific for CD151free (8C3, 14A2.H1 and 1A5) and an antibody that binds outside this domain (11G5A) or a control antibody (Fig. 5A). Metastatic colonies were allowed to form for 3 days before their morphology was documented and the number of colonies with a motile phenotype was quantified (Fig. 5B). At 0.5–5 μg/animal only mAB 1A5 inhibited tumor cell motility in vivo. However, at 20 μg/animal tumor cell motility was inhibited by 8C3 and 14A2.H1 but not 11G5A or the control antibody. These data demonstrate that antibodies specific for CD151free are capable of inhibiting tumor cell migration by clustering CD151 not associated with integrins.
Figure 5. Clustering of CD151 through antibodies specific for the integrin-binding domain inhibits tumor cell motility in vivo.

Changes in tumor cell motility in response to anti-CD151 antibodies were determined by analyzing the formation of metastatic colonies in the chorioallantic membrane. (A) The inhibition of tumor cell dissemination in the presence or absence of anti-CD151 antibodies (1A5, 8C3, 14A2.H1, and 11G5A) was compared to the dissemination in the absence of tumor targeting antibodies (untreated) or a control IgG. Images were taken after 4 days of treatment with 0.5, 5, or 20μg or antibody (A) and the number of colonies with motile tumor cells were quantified (B). N ≥ 5 with experiments performed in duplicate.
Tumor cell immobilization in response to CD151 clustering requires PKCα but not integrin α3
To determine if α3 is required for the immobilization mediated by CD151, in vivo migration assays were performed following α3 knockdown. HEp3 cells were transfected with control or α3-specific siRNA and a ≥90% reduction in α3 expression after siRNA delivery was confirmed by immunoblotting (Fig. 6A). HEp3 cells bearing control or α3-specific siRNA were subsequently injected into chick embryos and allowed to form metastatic colonies in the presence of mAB 1A5 or a control antibody (29-7). Knockdown of α3 did not impair the migration of tumor cells as evidenced by the absence of colonies with an immobilized phenotype (Fig. 6B and C). Moreover, in the presence of mAB 1A5 both HEp3 control- and α3-siRNA transfected cells form compact colonies demonstrating that the absence of α3 does not alter the ability of CD151-clustering to inhibit motility and colonization in vivo. PKCα is a known signaling partner of CD151. To determine if PKCα is required for the inhibition of tumor cell motility upon CD151 clustering, in vivo migration assays were performed following PKCα knockdown (Fig. 6). The knockdown of PKCα did not affect tumor cell motility but did prevent immobilization in response to mAB 1A5 induced clustering of CD151.
Figure 6. PKCα but not integrin α3 is required for the regulation of motility through CD151free.

(A) Immunoblotting of Triton-X 100 lysates from HEp3 cells transfected with the control, integrin α3-specific or PKCα-specific siRNA to evaluate the efficacy of target gene knockdown. GAPDH is included as a loading control. (B) The analysis of tumor cell motility in vivo after delivery of control, integrin α3 or PKCα siRNA. Tumor-bearing embryos were treated with control IgG or mAB 1A5 (5μg) 1 day after tumor cell injection. Images of metastatic colonies were taken 2 days after antibody injection. The immobilization of tumor cells in response to mAB 1A5 was quantified in (C). N ≥ 5 with experiments performed in triplicate.
The integrin-binding domain of CD151 is detectable in prostate cancer and corresponds with poor patient outcome
Antibodies specific for integrin-binding domain of CD151 define a subpopulation of this tetraspanin (CD151free) that is distinct from the tetraspanin bound to its integrin partner (CD151ITGA). The immobilization of tumor cells through clustering of CD151free (Fig. 5 and 6) and the subsequent inhibition of metastasis (6) demonstrates that CD151free may be relevant in the malignant progression of cancer. Recent work demonstrated a specific role for CD151 in the progression of prostate cancer (39). We hypothesized that detection of CD151free is altered during tumor progression and correlates with patient outcome. This relationship was evaluated in prostate cancer by comparing the detection of CD151free to biochemical recurrence (for patients who underwent radical retropubic prostatectomy (RRP): cohort #1, N=99) or metastasis (for patients who did not undergo RRP: cohort #2, N=38). See supplemental tables 1–3 for patient information.
Histological detection with the mAB 11G5A (which binds both CD151ITGA and CD151free) demonstrates abundant expression of CD151 in both normal and malignant prostate tissues. Conversely, mAB 1A5 (which binds only CD151free) exhibited weak staining of normal prostate glands but elevated detection of CD151free in tissue from prostate cancers (Fig. 7A). CD151 gene expression is relatively abundant in normal adult prostate tissue (Suppl. Fig. 6A). An analysis of CD151 mRNA expression in prostate cancer studies available through The Cancer Genome Atlas (TCGA; CD151, Fig. 6B) and NCBI GEO (Suppl. Fig. 6B–D) revealed no significant changes in CD151 gene expression. This observation is in accordance with our histological assessment of CD151 protein detection with 11G5A (Fig. 7A). In contrast, 55% of the 216 prostate adenocarcinoma patients analyzed in the TCGA exhibited reduced expression of integrin α3 (ITGA3, Fig. 6B). This observation suggested that the appearance of CD151free might coincide with reduced expression of integrin α3. Indeed, paired histological analysis of advanced prostate cancer tumors reveals that CD151 is readily detected in the tumor tissue, adjacent normal and distant normal tissue. In contrast, integrin α3 expression is reduced in the tumor relative to normal tissue and CD151free is detectable only in the tumor (Fig. 7C). Independent histological evaluation of integrin α3 and CD151 available through the Human Protein Atlas (40) confirms reduced expression of the integrin in tumor tissue compared to normal tissue not only in prostate cancer (Fig. 7D quantified in E) but also in cancers of the breast, colon and kidney (Fig. 7D).
Figure 7. Detection of CD151free in prostate cancer corresponds with poor patient outcome.

Immunohistochemical detection of CD151 was performed on two cohorts of prostate cancer patients (see methods). General expression of CD151 was detected with mAB 11G5A which recognizes all CD151 complexes while mAB 1A5 was used to detect CD151 not engaged with α3 (CD151free). (A) Micrographs of CD151 immunohistochemistry with mAB 11GA or 1A5 on adjacent benign, adjacent normal and tumor tissue. human prostate cancer tissue while 1A5 does not. In the primary tumor however, similar to 11G5A, 1A5 positively stains the primary tumor. (B) Evaluation of gene expression in a TCGA data set of 216 patients with prostate adenocarcinoma. Arrows indicate integrin α3 (ITGA3) and CD151. (C) Immunohistochemical detection of CD151 (11G5A, left), CD151free (1A5, middle) and integrin α3 (P1B5, right) in normal (top) and tumor tissue (bottom). (D) Immunohistochemical detection using polyclonal antibodies for CD151 (top row) and integrin α3 (bottom row) in normal and tumor tissue of the prostate, breast, colon and kidney obtained through ProteinAtlas.org. Each image is representative from a collection of 10–12 patients. (E) quantitation of staining intensity of prostate cancer patients in D. (F) Kaplan-Meier curves of recurrence-free survival were generated using the CD151free immunoreactivity in tissue sections of prostate tissue obtained from patients that received a RRP after diagnosis whom were monitored for biochemical recurrence (cohort #1, N=99). Log-Rank test p=0.023. (G) Kaplan-Meier curves of CD151free further stratified patients from cohort #1 that were already stratified by high (≥8) and low (<8) baseline PSA levels in regards to biochemical recurrence (H) Kaplan-Meier curves generated of metastasis-free survival were generated using the CD151free immunoreactivity in biopsy specimens from patients that did not receive RRP after diagnosis (cohort #2, N=38). These patients were monitored longitudinally after non-surgical intervention for disease progression (metastasis). Log-Rank test p=0.001.
To evaluate the correlation of CD151free with patient outcome in prostate cancer, we compared the levels of CD151free to biochemical recurrence (for patients who underwent radical retropubic prostatectomy (RRP): cohort #1, N=99) or metastasis (for patients who did not undergo RRP: cohort #2, N=38). See supplemental tables 1–3 for cohort descriptions. First, we dichotomized patients that underwent RRP (cohort #1) based on mAB 1A5 staining (positive vs. negative). CD151free staining on benign tissue adjacent to the tumor (Suppl. Fig. 8A) and normal tissue distant from the tumor (Suppl. Fig. 8B) failed to demonstrate an association with biochemical recurrence. In contrast, detection of CD151free (mAB 1A5 positive) in tumor tissue corresponded to a significantly reduced time-to-biochemical recurrence compared to tumor tissue with no detectable levels of CD151free (mAB 1A5 negative, Fig. 7F; mean survival = 10.3 vs. 13.5; Log-Rank, p=0.023). Moreover, the detection of CD151free further stratified patients that were already stratified by high (≥8) and low (<8) baseline PSA levels in regards to biochemical recurrence (Fig. 7G). Biochemical recurrence-free survival is reduced in patients that are singly positive for either CD151free or high PSA compared to those negative for both (mean survival = 11.6 and 12.3 years vs. no recurrence; Log-Rank, p=0.068) Furthermore, singly positive patients have significantly greater biochemical recurrence-free survival compared to patients that are double positive (mean survival = 11.6 and 12.3 years vs. 9.1 years; Log-Rank, p=0.017). Most importantly, in patients with high PSA, CD151free (positive vs. negative) is an independent predictor of biochemical recurrence-free survival after adjusting for tumor stage (adjusted hazards ratio = 13.5; 95%CI 1.2–148.1; p=0.033). To determine if the presence of CD151free in the primary tumor could be indicative of future metastasis, we evaluated biopsy specimens from prostate cancer patients that did not undergo RRP and eventually developed metastasis (cohort #2). Patients were dichotomized according to absence/presence of mAB 1A5 staining and its relation to metastasis-free survival was visualized using Kaplan-Meier analysis (Fig. 7H). Patients with mAB 1A5 positive biopsies at time of diagnosis exhibited a greatly reduced metastasis-free survival (mean survival = 3.7 vs. 12.7; Log rank p=0.001).
These observations indicate that CD151free is evident only in tumor tissues where its appearance coincides with reduced integrin α3 expression and its detection is an independent negative predictor of biochemical-free as well as metastasis-free survival.
DISCUSSION
The tetraspanin CD151 is an established regulator of cell adhesion, migration and tumor cell metastasis (5,20,39,41). Its interactions with the integrin subunits α3 and α6 have been shown to be important for adhesion, migration and morphogenesis on laminin (11–13,18,42). However, using immunoprecipitation and flow cytometry we demonstrate that there is a subpopulation of CD151 on the surface of tumor cells that is not associated with its integrin partner (CD151free). This population of CD151free can be detected with antibodies specific for the integrin-binding domain of CD151, including mAB 1A5, 8C3 and 14A2.H1.
We previously demonstrated that anti-CD151 mAB 1A5 potently inhibits tumor cell migration and metastasis (6) by preventing de-adhesion at the rear of the cell. The inhibition of motility required a bivalent antibody suggesting that mAB 1A5 could mediate its activity by clustering the tetraspanin. Indeed, mAB 1A5, along with other antibodies specific for the integrin-binding domain of CD151 cluster the tetraspanin. Clustering of CD151free promotes cell adhesion and results in tumor cell immobilization, enhanced collagen contraction, greater fibronectin fibrilogenesis, improved platelet aggregation and elevated cell-cell adhesion. Although many of these activities are integrin-dependent, they do not involve adhesion to laminin nor association with the laminin-binding integrins that are established integrin partners of CD151. Indeed, the immobilization of tumor cells in response to the clustering of CD151free does not require α3 expression (Fig. 6). We have previously demonstrated that the loss of CD151 does not lead to tumor cell immobilization (6), thus the inhibition of tumor cell motility associated with the clustering of CD151free is likely a distinct mechanism for the control of cellular adhesion and migration.
These observations raise a number of questions including: a) what mechanism creates CD151free? b) does CD151free occur in normal tissue? c) is the mechanism by which CD151free controls motility distinct from the mechanism of integrin-associated CD151? and d) is CD151free a tumor promoter? While fully answering these questions will require further investigation, significant insight is available from these and published studies. CD151free could become available when the stoichiometric balance with its integrin partners is altered. This alteration is evident when the expression of integrin α3 is significantly reduced in tumor relative to normal tissue (Fig. 7) but could also occur when CD151 expression is upregulated as reported for hepatic carcinomas (43). However, CD151free is also likely to occur in normal tissues when expression of the laminin-binding integrins is reduced or absent. This is evident in cardiac tissue which exhibits little α3 and α6 expression but an abundance of CD151 that is detectable by antibodies specific to the integrin-binding epitope (11B1, 14A2.H1 (22)). Even more evident is the presence of CD151free in the bone marrow, circulating hematopoietic cells and platelets where the laminin-binding integrins have low expression and the surface expression of CD151free is readily detectable with any of the antibodies specific for integrin-binding epitope. The ability of mAB 1A5 to promote adhesion in platelets and suspended hematopoietic cell lines (Fig. 1) is perhaps the first and most obvious evidence that CD151free can control an adhesive mechanism distinct from the laminin-binding integrins. The universality of CD151 clustering via the integrin-binding epitope is confirmed with additional antibodies with epitope specificity similar to mAB 1A5 (Fig. 5). The extent to which individual CD151 antibodies inhibited migration varied. These differences are likely due to variations in their individual affinity and ability to cluster CD151. There are additional anti-CD151 antibodies not tested here. TS151r has been reported to displace integrin partners from CD151 (24) and subsequently promote migration of epithelial cells (HaCaT). Although we only observed inhibition of migration in response to anti-CD151 antibodies, Chometon et al. evaluated the migration of a relatively benign cell line on laminin. Reducing the laminin binding would likely accelerate migration. Future studies will determine evaluate the ability of the antibodies TS151r and TS151 to promote CD151 and alter migration of metastatic cells lines on non-laminin substrates.
The ability of CD151free clustering to inhibit tumor cell migration after the knockdown of α3 (Fig. 6) suggests that CD151free can also regulate adhesion and migration of epithelial-derived tumor cells through a mechanism independent of laminin-binding integrins. A preliminary evaluation of the CD151 signaling mechanisms revealed that neither Rac nor Rho activity was altered upon CD151free clustering. However, the canonical signaling partner of CD151, PKCα, was required for CD151free clustering to inhibit tumor cell motility. Although PKCα is generally thought of as a promoter of migration, PKCα was identified as an inhibitor of cell migration by the Brugge laboratory during an in vitro screening assay of normal epithelial migration (44).
We hypothesize that the distinct mechanisms by which CD151 can regulate cell adhesion and migration are determined primarily by the nature of the associated partner and the cellular context in which they function. In the context of a transformed cancer cell the CD151-integrin-laminin axis (“CD151ITGA”, (13,14)) participates in promoting tumor cell invasion and metastasis (10,11,41,42,45) while in normal, quiescent epithelia the association of CD151 with the laminin binding integrins is required for cohesion and (non-motile) epithelial integrity (16,46). Clearly the loss of CD151 diminishes both normal epithelial integrity and cancer metastasis suggesting that both phenomena, which are on opposing ends of the motility spectrum, utilize the adhesion facilitated by CD151. Conversely, CD151free present on migratory/metastatic cells as well as non-adherent cells (hemopoietic cells & platelets) can initiate/promote adhesion resulting in aggregation (platelets, Fig. 1; non-adherent cells, Suppl. Fig. 2) or inhibition of migration (tumor cells, Fig. 1 and (6)) when clustered.
Cell motility is directly linked to dynamic cycling of adhesion/de-adhesion (47). Firm adhesion as seen in normal epithelial cells on laminin-containing basement membranes limits cell motility but promotes epithelial integrity (47,48). Although the detection of CD151free correlates with metastasis, it is not clear that CD151free contributes directly to metastatic progression. CD151free appears to be created upon the loss of α3 and this coincides with increased metastatic behavior. The genetic ablation of CD151 clearly diminishes metastasis (5, 14, 39) demonstrating that CD151 supports metastasis. In the instance of CD151free, it remains to be determined if metastasis is promoted by the loss of α3 or the gain of integrin-free CD151. However, it is clear that clustering of CD151free promotes adhesion and inhibits migration. Although the molecular mechanism by CD151free might control motility is currently unknown, uncoupling CD151 from the laminin binding integrins is likely to promote a less adhesive, more motile phenotype. This is not only supported by the reduction of integrin α3 in tumor cells but also the loss of the integrin during in vitro selection for matrix invasion (49) and an increase in metastasis after targeted knockdown of integrin α3 (50). Considering the immobility of firmly anchored cells in normal epithelia, the creation of CD151free during tumorigenesis is a simple mechanism to promote motility. Furthermore, CD151free can be engaged (clustered) to stimulate adhesion (Fig. 2, Suppl. Fig. 2 and (6)) suggesting that the creation of CD151free would bias tumor cells towards a more dynamic cycling of adhesion in favor of migration and thereby promote tumor metastasis. What remains to be determined is the identity of partners that control the switch of CD151free to its adhesion-promoting state.
In conclusion, our findings demonstrate that a subpopulation of CD151 exists on the surface of tumor cells that is not associated with integrin partners (CD151free) that regulate tumor cell migration. Clinical correlation of CD151free with prostate cancer progression demonstrates that it has independent prognostic value and suggests that this tetraspanin subpopulation may contribute to the disease and could be used to predict cancer progression.
Supplementary Material
Acknowledgments
Financial Support. This study was supported by CA143081 and CA120711 from the National Institutes of Health to AZ and Motorcycle Ride for Dad as well as Canadian Cancer Society Research Institute Grant #700537 to JDL. TDP and KH were supported by CA136228 and CA009592 respectively from the National Institutes of Health.
We thank Amber Ablack and Carl Postenka for their valuable technical support, Kristin Kain for editorial input, and Larry Stitt for the statistical analysis. Fertilized eggs were kindly provided by Tyson Food Inc. This study was supported by CA143081 and CA120711 from the National Institutes of Health to AZ and Motorcycle Ride for Dad as well as Canadian Cancer Society Research Institute Grant #700537 to JDL. SAA, TDP and KH were supported by K12 CA 9060625, CA136228 and CA009592 respectively from the National Institutes of Health.
Footnotes
Disclosure of Potential Conflicts of Interest
The authors have no potential conflicts of interest to disclose.
COMPETING INTERESTS
The authors have no competing interests.
References
- 1.Hemler ME. Tetraspanin functions and associated microdomains. Nat Rev Mol Cell Biol. 2005;6:801–11. doi: 10.1038/nrm1736. [DOI] [PubMed] [Google Scholar]
- 2.Zijlstra A. Cell-Extracellular Matrix Interactions in Cancer. 2010. Tetraspanins in Cancer. [Google Scholar]
- 3.Wang HX, Li Q, Sharma C, Knoblich K, Hemler ME. Tetraspanin protein contributions to cancer. Biochem Soc Trans. 2011;39:547–52. doi: 10.1042/BST0390547. [DOI] [PubMed] [Google Scholar]
- 4.Hong I-K, Jin Y-J, Byun H-J, Jeoung D-I, Kim Y-M, Lee H. Homophilic interactions of Tetraspanin CD151 up-regulate motility and matrix metalloproteinase-9 expression of human melanoma cells through adhesion-dependent c-Jun activation signaling pathways. J Biol Chem. 2006;281:24279–92. doi: 10.1074/jbc.M601209200. [DOI] [PubMed] [Google Scholar]
- 5.Takeda Y, Li Q, Kazarov AR, Epardaud M, Elpek K, Turley SJ, et al. Diminished metastasis in tetraspanin CD151-knockout mice. Blood. 2011;118:464–72. doi: 10.1182/blood-2010-08-302240. [DOI] [PMC free article] [PubMed] [Google Scholar]
- 6.Zijlstra A, Lewis J, Degryse B, Stuhlmann H, Quigley JP. The inhibition of tumor cell intravasation and subsequent metastasis via regulation of in vivo tumor cell motility by the tetraspanin CD151. Cancer Cell. 2008;13:221–34. doi: 10.1016/j.ccr.2008.01.031. [DOI] [PMC free article] [PubMed] [Google Scholar]
- 7.Stipp CS, Kolesnikova TV, Hemler ME. EWI-2 is a major CD9 and CD81 partner and member of a novel Ig protein subfamily. J Biol Chem. 2001;276:40545–54. doi: 10.1074/jbc.M107338200. [DOI] [PubMed] [Google Scholar]
- 8.Yáñez-Mó M, Barreiro O, Gonzalo P, Batista A, Megias D, Genis L, et al. MT1-MMP collagenolytic activity is regulated through association with tetraspanin CD151 in primary endothelial cells. Blood. 2008;112:3217–26. doi: 10.1182/blood-2008-02-139394. [DOI] [PubMed] [Google Scholar]
- 9.Palmer DT, Zijlstra A. UCSD-Nature Molecule Pages. 2011. CD151. [DOI] [PMC free article] [PubMed] [Google Scholar]
- 10.Winterwood NE, Varzavand A, Meland MN, Ashman LK, Stipp CS. A critical role for tetraspanin CD151 in alpha3beta1 and alpha6beta4 integrin-dependent tumor cell functions on laminin-5. Mol Biol Cell. 2006;17:2707–21. doi: 10.1091/mbc.E05-11-1042. [DOI] [PMC free article] [PubMed] [Google Scholar]
- 11.Kazarov AR, Yang X, Stipp CS, Sehgal B, Hemler ME. An extracellular site on tetraspanin CD151 determines alpha 3 and alpha 6 integrin-dependent cellular morphology. J Cell Biol. 2002;158:1299–309. doi: 10.1083/jcb.200204056. [DOI] [PMC free article] [PubMed] [Google Scholar]
- 12.Novitskaya V, Romanska H, Dawoud M, Jones JL, Berditchevski F. Tetraspanin CD151 regulates growth of mammary epithelial cells in three-dimensional extracellular matrix: implication for mammary ductal carcinoma in situ. Cancer Res. 2010;70:4698–708. doi: 10.1158/0008-5472.CAN-09-4330. [DOI] [PMC free article] [PubMed] [Google Scholar]
- 13.Yang XH, Flores LM, Li Q, Zhou P, Xu F, Krop IE, et al. Disruption of laminin-integrin-CD151-focal adhesion kinase axis sensitizes breast cancer cells to ErbB2 antagonists. Cancer Res. 2010;70:2256–63. doi: 10.1158/0008-5472.CAN-09-4032. [DOI] [PMC free article] [PubMed] [Google Scholar]
- 14.Deng X, Li Q, Hoff J, Novak M, Yang H, Jin H, et al. Integrin-associated CD151 drives ErbB2-evoked mammary tumor onset and metastasis. Neoplasia. 2012;14:678–89. doi: 10.1593/neo.12922. [DOI] [PMC free article] [PubMed] [Google Scholar]
- 15.Lau L-M, Wee JL, Wright MD, Moseley GW, Hogarth PM, Ashman LK, et al. The tetraspanin superfamily member CD151 regulates outside-in integrin alphaIIbbeta3 signaling and platelet function. Blood. 2004;104:2368–75. doi: 10.1182/blood-2003-12-4430. [DOI] [PubMed] [Google Scholar]
- 16.Sachs N, Kreft M, van den Bergh Weerman MA, Beynon AJ, Peters TA, Weening JJ, et al. Kidney failure in mice lacking the tetraspanin CD151. J Cell Biol. 2006;175:33–9. doi: 10.1083/jcb.200603073. [DOI] [PMC free article] [PubMed] [Google Scholar]
- 17.Berditchevski F, Gilbert E, Griffiths MR, Fitter S, Ashman L, Jenner SJ. Analysis of the CD151-alpha3beta1 integrin and CD151-tetraspanin interactions by mutagenesis. J Biol Chem. 2001;276:41165–74. doi: 10.1074/jbc.M104041200. [DOI] [PubMed] [Google Scholar]
- 18.Zhang XA, Kazarov AR, Yang X, Bontrager AL, Stipp CS, Hemler ME. Function of the tetraspanin CD151-alpha6beta1 integrin complex during cellular morphogenesis. Mol Biol Cell. 2002;13:1–11. doi: 10.1091/mbc.01-10-0481. [DOI] [PMC free article] [PubMed] [Google Scholar]
- 19.Yamada M, Tamura Y, Sanzen N, Sato-Nishiuchi R, Hasegawa H, Ashman LK, et al. Probing the interaction of tetraspanin CD151 with integrin alpha 3 beta 1 using a panel of monoclonal antibodies with distinct reactivities toward the CD151-integrin alpha 3 beta 1 complex. Biochem J. 2008;415:417–27. doi: 10.1042/BJ20071625. [DOI] [PubMed] [Google Scholar]
- 20.Haeuw JF, Goetsch L, Bailly C, Corvaia N. Tetraspanin CD151 as a target for antibody-based cancer immunotherapy. Biochem Soc Trans. 2011;39:553–8. doi: 10.1042/BST0390553. [DOI] [PubMed] [Google Scholar]
- 21.Serru V, Le Naour F, Billard M, Azorsa DO, Lanza F, Boucheix C, et al. Selective tetraspan-integrin complexes (CD81/alpha4beta1, CD151/alpha3beta1, CD151/alpha6beta1) under conditions disrupting tetraspan interactions. Biochem J [Internet] 1999;340 (Pt 1):103–11. [PMC free article] [PubMed] [Google Scholar]
- 22.Geary SM, Cambareri AC, Sincock PM, Fitter S, Ashman LK. Differential tissue expression of epitopes of the tetraspanin CD151 recognised by monoclonal antibodies. Tissue Antigens. 2001;58:141–53. doi: 10.1034/j.1399-0039.2001.580301.x. [DOI] [PubMed] [Google Scholar]
- 23.Sterk LMT, Geuijen CAW, van den Berg JG, Claessen N, Weening JJ, Sonnenberg A. Association of the tetraspanin CD151 with the laminin-binding integrins alpha3beta1, alpha6beta1, alpha6beta4 and alpha7beta1 in cells in culture and in vivo. 2002;115:1161–73. doi: 10.1242/jcs.115.6.1161. [DOI] [PubMed] [Google Scholar]
- 24.Chometon G, Zhang Z-G, Rubinstein E, Boucheix C, Mauch C, Aumailley M. Dissociation of the complex between CD151 and laminin-binding integrins permits migration of epithelial cells. Exp Cell Res. 2006;312:983–95. doi: 10.1016/j.yexcr.2005.12.034. [DOI] [PubMed] [Google Scholar]
- 25.Palmer TD, Lewis J, Zijlstra A. Quantitative analysis of cancer metastasis using an avian embryo model. J Vis Exp. 2011 doi: 10.3791/2815. [DOI] [PMC free article] [PubMed] [Google Scholar]
- 26.Ossowski L, Reich E. Changes in malignant phenotype of a human carcinoma conditioned by growth environment. Cell. 1983;33:323–33. doi: 10.1016/0092-8674(83)90414-2. [DOI] [PubMed] [Google Scholar]
- 27.Testa JE, Brooks PC, Lin JM, Quigley JP. Eukaryotic expression cloning with an antimetastatic monoclonal antibody identifies a tetraspanin (PETA-3/CD151) as an effector of human tumor cell migration and metastasis. Cancer Res. 1999;59:3812–20. [PubMed] [Google Scholar]
- 28.Ashby WJ, Wikswo JP, Zijlstra A. Magnetically attachable stencils and the non-destructive analysis of the contribution made by the underlying matrix to cell migration. Biomaterials. 2012;33:8189–203. doi: 10.1016/j.biomaterials.2012.07.018. [DOI] [PMC free article] [PubMed] [Google Scholar]
- 29.Marjoram RJ, Voss B, Pan Y, Dickeson SK, Zutter MM, et al. Suboptimal activation of protease-activated receptors enhances alpha2beta1 integrin-mediated platelet adhesion to collagen. J Biol Chem. 2009;284:34640–7. doi: 10.1074/jbc.M109.020990. [DOI] [PMC free article] [PubMed] [Google Scholar]
- 30.Cerami E, Gao J, Dogrusoz U, Gross BE, Sumer SO, Aksoy BA, et al. The cBio Cancer Genomics Portal: An Open Platform for Exploring Multidimensional Cancer Genomics Data. Cancer Discovery. 2012;2:401–4. doi: 10.1158/2159-8290.CD-12-0095. [DOI] [PMC free article] [PubMed] [Google Scholar]
- 31.Chandran UR, Ma C, Dhir R, Bisceglia M, Lyons-Weiler M, Liang W, et al. Gene expression profiles of prostate cancer reveal involvement of multiple molecular pathways in the metastatic process. 2007;7:21. doi: 10.1186/1471-2407-7-64. [DOI] [PMC free article] [PubMed] [Google Scholar]
- 32.Varambally S, Yu J, Laxman B, Rhodes DR, Mehra R, Tomlins SA, et al. Integrative genomic and proteomic analysis of prostate cancer reveals signatures of metastatic progression. Cancer Cell. 2005;8:393–406. doi: 10.1016/j.ccr.2005.10.001. [DOI] [PubMed] [Google Scholar]
- 33.Tomlins SA, Mehra R, Rhodes DR, Cao X, Wang L, Dhanasekaran SM, et al. Integrative molecular concept modeling of prostate cancer progression. Nat Genet. 2007;39:41–51. doi: 10.1038/ng1935. [DOI] [PubMed] [Google Scholar]
- 34.Taylor BS, Schultz N, Hieronymus H, Gopalan A, Xiao Y, Carver BS, et al. Integrative genomic profiling of human prostate cancer. Cancer Cell. 2010;18:11–22. doi: 10.1016/j.ccr.2010.05.026. [DOI] [PMC free article] [PubMed] [Google Scholar]
- 35.Dezso Z, Nikolsky Y, Sviridov E, Shi W, Serebriyskaya T, Dosymbekov D, et al. A comprehensive functional analysis of tissue specificity of human gene expression. BMC Biol. 2008;6:49. doi: 10.1186/1741-7007-6-49. [DOI] [PMC free article] [PubMed] [Google Scholar]
- 36.Fogerty FJ, Akiyama SK, Yamada KM, Mosher DF. Inhibition of binding of fibronectin to matrix assembly sites by anti-integrin (alpha 5 beta 1) antibodies. J Cell Biol. 1990;111:699–708. doi: 10.1083/jcb.111.2.699. [DOI] [PMC free article] [PubMed] [Google Scholar]
- 37.Offermanns S. Activation of platelet function through G protein-coupled receptors. Circ Res. 2006;99:1293–304. doi: 10.1161/01.RES.0000251742.71301.16. [DOI] [PubMed] [Google Scholar]
- 38.Nishiuchi R, Murayama O, Fujiwara H, Gu J, Kawakami T, Aimoto S, et al. Characterization of the ligand-binding specificities of integrin alpha3beta1 and alpha6beta1 using a panel of purified laminin isoforms containing distinct alpha chains. J Biochem. 2003;134:497–504. doi: 10.1093/jb/mvg185. [DOI] [PubMed] [Google Scholar]
- 39.Copeland BT, Bowman MJ, Ashman LK. Genetic Ablation of the Tetraspanin Cd151 Reduces Spontaneous Metastatic Spread of Prostate Cancer in the TRAMP Model. Mol Cancer Res. 2012;11:95–105. doi: 10.1158/1541-7786.MCR-12-0468. [DOI] [PubMed] [Google Scholar]
- 40.Uhlen M, Oksvold P, Fagerberg L, Lundberg E, Jonasson K, Forsberg M, et al. Nat Biotechnol. Vol. 28. Nature Publishing Group; 2010. Towards a knowledge-based Human Protein Atlas; pp. 1248–50. [DOI] [PubMed] [Google Scholar]
- 41.Yang XH, Richardson AL, Torres-Arzayus MI, Zhou P, Sharma C, Kazarov AR, et al. CD151 accelerates breast cancer by regulating alpha 6 integrin function, signaling, and molecular organization. Cancer Res. 2008;68:3204–13. doi: 10.1158/0008-5472.CAN-07-2949. [DOI] [PMC free article] [PubMed] [Google Scholar]
- 42.Liu L, He B, Liu WM, Zhou D, Cox JV, Zhang XA. Tetraspanin CD151 promotes cell migration by regulating integrin trafficking. J Biol Chem. 2007;282:31631–42. doi: 10.1074/jbc.M701165200. [DOI] [PubMed] [Google Scholar]
- 43.Ke H, Wang P, Yu W, Liu X, Liu C, Yang F, et al. Derivation, characterization and gene modification of cynomolgus monkey mesenchymal stem cells. Differentiation. 2009;77:256–62. doi: 10.1016/j.diff.2008.09.021. [DOI] [PubMed] [Google Scholar]
- 44.Simpson KJ, Selfors LM, Bui J, Reynolds A, Leake D, Khvorova A, et al. Identification of genes that regulate epithelial cell migration using an siRNA screening approach. Nat Cell Biol. 2008;10:1027–38. doi: 10.1038/ncb1762. [DOI] [PubMed] [Google Scholar]
- 45.Lammerding J, Kazarov AR, Huang H, Lee RT, Hemler ME. Tetraspanin CD151 regulates alpha6beta1 integrin adhesion strengthening. Proc Natl Acad Sci USA. 2003;100:7616–21. doi: 10.1073/pnas.1337546100. [DOI] [PMC free article] [PubMed] [Google Scholar]
- 46.Tsujino K, Takeda Y, Arai T, Shintani Y, Inagaki R, Saiga H, et al. Tetraspanin CD151 protects against pulmonary fibrosis by maintaining epithelial integrity. Am J Respir Crit Care Med. 2012;186:170–80. doi: 10.1164/rccm.201201-0117OC. [DOI] [PMC free article] [PubMed] [Google Scholar]
- 47.Palecek SP, Loftus JC, Ginsberg MH, Lauffenburger DA, Horwitz AF. Integrin-ligand binding properties govern cell migration speed through cell-substratum adhesiveness. Nature. 1997;385:537–40. doi: 10.1038/385537a0. [DOI] [PubMed] [Google Scholar]
- 48.Sachs N, Sonnenberg A. Nat Rev Nephrol. Vol. 9. Nature Publishing Group; 2013. Cell–matrix adhesion of podocytes in physiology and disease; pp. 200–10. [DOI] [PubMed] [Google Scholar]
- 49.Dedhar S, Saulnier R, Nagle R, Overall CM. Specific alterations in the expression of alpha 3 beta 1 and alpha 6 beta 4 integrins in highly invasive and metastatic variants of human prostate carcinoma cells selected by in vitro invasion through reconstituted basement membrane. Clin Exp Metastasis. 1993;11:391–400. doi: 10.1007/BF00132982. [DOI] [PubMed] [Google Scholar]
- 50.Varzavand A, Drake JM, Svensson RU, Herndon ME, Zhou B, Henry MD, et al. Integrin α3β1 regulates tumor cell responses to stromal cells and can function to suppress prostate cancer metastatic colonization. Clin Exp Metastasis. 2013;30:541–52. doi: 10.1007/s10585-012-9558-1. [DOI] [PMC free article] [PubMed] [Google Scholar]
Associated Data
This section collects any data citations, data availability statements, or supplementary materials included in this article.