

Abstract
Purpose
Marked reactive stroma formation is associated with poor outcome in clinically localized prostate cancer. We have previously identified genes with diverse functions that are upregulated in reactive stroma. This study tests the hypothesis that expression of these genes in stromal cells enhances prostate cancer growth in vivo.
Experimental Design
The expression of reactive stroma genes in prostate stromal cell lines was evaluated by RT-PCR and Q-RT-PCR. Genes were knocked down using stable expression of shRNAs and the impact on tumorigenesis assessed using the differential reactive stroma (DRS) system, in which prostate stromal cell lines are mixed with LNCaP prostate cancer cells and growth as subcutaneous xenografts assessed.
Results
Nine of 10 reactive stroma genes tested were expressed in one or more prostate stromal cell lines. Gene knockdown of c-Kit, Wnt10B, Bmi1, Gli2 or COMP all resulted in decreased tumorigenesis in the DRS model. In all tumors analyzed, angiogenesis was decreased and there were variable effects on proliferation and apoptosis in the LNCaP cells. Wnt10B has been associated with stem/progenitor cell phenotype in other tissue types. Using a RT-PCR array, we detected downregulation of multiple genes involved in stem/progenitor cell biology such as OCT4 and LIF as well as cytokines such as VEGFA, BDNF and CSF2 in cells with Wnt10B knockdown.
Conclusions
These findings show that genes upregulated in prostate cancer reactive stroma promote progression when expressed in prostate stromal cells. Moreover, these data indicate that the DRS model recapitulates key aspects of cancer cell/reactive stroma interactions in prostate cancer.
Keywords: prostate cancer, microenvironment, reactive stroma, Wnt10B
INTRODUCTION
Prostate cancer remains the most common malignancy affecting men and the second leading cause of cancer-related death of men in the United States. It has been appreciated for many years that the tumor microenvironment plays an important role in the initiation and progression of prostate and other cancers (1, 2). The tissues surrounding the cancer cells in prostate cancer are distinct from the normal mesenchymal tissues of the prostate and consist of a mixture of fibroblasts, myofibroblasts, nerves, endothelial cells, immune cells, other cells and altered extracellular matrix. Men with tumors having the most profound histological alterations of reactive stroma, which is termed reactive stroma grade 3 (RSG3), have reduced biochemical recurrence-free survival and/or increased prostate cancer specific death in studies of tissue microarrays (3), biopsies (4) and radical prostatectomy specimens (5) which was independent of other clinical and pathologic parameters. This finding indicates that reactive stroma plays a critical role in prostate cancer progression and thus is an important therapeutic target. Of note, reactive stroma is relatively genetically stable compared to cancer cells so that it cannot respond as readily to selective pressures induced by therapies via mutation or other genomic alterations and thus represents an excellent therapeutic target.
To understand the mechanisms by which reactive stroma can influence tumor behavior, we have previously examined global changes in gene expression in prostate cancer reactive stroma grade 3 relative to paired benign prostatic stroma using expression microarray analysis of laser captured RNAs from these two tissue types (6). By focusing on grade 3 reactive stroma, which is associated with prostate cancer progression, we sought to indentify key changes in prostate reactive stroma that are associated with aggressive prostate cancer. A total of 544 unique genes were higher in the reactive stroma and 606 unique genes were lower based on microarray analysis compared to benign stroma. The upregulated genes were associated with a variety of biological processes including stem cell maintenance, axonogenesis/neurogenesis, angiogenesis and alterations of extracellular matrix.
To examine the biological activity of the genes upregulated in reactive stroma in promoting prostate cancer progression we have used the differential reactive stroma model system (7). In this system, one of multiple different human prostate stromal cell lines with variable tumor promoting activities (DRS stromal cells) are mixed with LNCaP prostate cancer cells with or without Matrigel, injected subcutaneously in nude mice and tumor formation and/or growth monitored over time. We report here that a key set of genes that are upregulated in reactive stroma are also expressed in DRS stromal cells and that knockdown using stable shRNA inhibits tumor formation and growth in the DRS model. These findings further implicate these gene sets in reactive stroma biology and in the promotion of prostate cancer progression. Moreover, these data indicate that the DRS model recapitulates key tumor-regulatory aspects of the interaction of prostate cancer cells and reactive stroma in prostate cancer.
MATERIALS and METHODS
Human prostate stromal cell lines
Prostate stromal cell lines (19I, 19B and 33B) were provided by the Rowley laboratory and established as described previously from the prostates of organ donors (7, 8).
Tissue culture
LNCaP prostate cancer cells were maintained in RPMI 1640 (Life Technologies, Inc., Rockville, MD) supplemented with 10% fetal bovine serum (Hyclone, Logan, UT), 100 units/ml penicillin, and 100 μg/ml streptomycin (Sigma Chemical Co., St. Louis, MO). Cell identity was validated by STR analysis at the MD Anderson STR Core. Human prostate stromal cell lines 19I, 19B and 33B were maintained in Bfs media: DMEM (Life Technologies, Inc., Rockville, MD) supplemented with 5% fetal bovine serum, 5% Nu Serum (Collaborative Research, Bedford, MA), 0.5 μg/ml testosterone, 5 μg/ml insulin, 100 units/ml penicillin, and 100 μg/ml streptomycin (Sigma, St. Louis, MO).
RT-PCR and Quantitative RT-PCR (Q-RT-PCR)
Quantitation of mRNA using Q-RT-PCR was carried out as described in Dakhova et al (6). The relative copy number of transcript for each gene was normalized by transcript level of β-actin in each sample (9). Each PCR experiment was carried out in triplicate. RT-PCR was carried out using the same primers and conditions and analyzed on 1.5% agarose gels. Primers and PCR conditions used are shown in Supplementary Table 1 or in Dakhova et al (6). Note Gli2 primers are from Supplementary Table 1, not from Dakhova et al (6).
Knockdown of reactive stroma genes with lentiviral shRNAs
Human GIPZ lentiviral shRNAmirs targeting Wnt10B (RHS4430-98481580), c-Kit (RHS4430-98481428), COMP (RHS4430-200217395), Gli2 ( RHS4430-200280814) and Bmi1 (RHS4430-200171042) were obtained from Open Biosystems. HPS-19I stromal cells were infected with virus and stably selected with puromycin. Knockdown was confirmed using quantitative RT-PCR of RNAs extracted after stable selection. Control vector was non-silencing GIPZ Lentiviral shRNAmir control from Open Biosystems (RHS4346).
Differential reactive stroma tumor studies
Stromal cells with knockdown or vector controls were used to subcutaneously inoculate nude mice as described previously(7). Briefly, each injection consisted of 2X10⁶ LNCaP prostate cancer cells and/or 2 X 10⁶ stromal cells and/or 100ul of Matrigel. Mice were injected over each flank to yield two tumors per mouse. Mice were euthanized 10 or 28 days after injection and tumors excised, weighed and sections prepared for histological examination and other studies. In the two-way DRS model cells were injected without Matrigel and the presence and size of tumors scored at 10 days. For the three-way DRS model Matrigel was used in addition to cells. Tumors were scored at either 10 days (to examine early events) or at 28 days (to stringently compare tumorigenesis). It should be noted that DRS stromal cells can both partially replace Matrigel and when injected in the presence of Matrigel further enhance tumor growth (7).
Immunohistochemistry and TUNEL
Immunohistochemistry for Bmi1 was performed as follows. After blocking endogenous peroxidase with hydrogen peroxide in methanol, antigen retrieval was performed in citrate buffer, pH 6.0 (Diagnostic BioSystems, Pleasanton, CA) for 20 minutes in a steamer. Non-specific staining was blocked for 20 minutes with Background Blocker (Biocare Medica, Concord, CA). Slides were incubated in primary antibody (Bmi1 rabbit Mab, Abcam, cat #ab126783) at 1:150 overnight at 4°C. Detection was performed using Rabbit on Rodent Hrp-Polymer (Biocare Medical) for 30 minutes at room temperature followed by stable DAB Plus (Diagnostic BioSystems) for 5 minutes at room temperature. Slides were then counterstained using CAT Hematoxylin (Biocare Medical) for 15 – 30 seconds. All rinses made using Tris-Tween Buffer, pH 7.4. Immunohistochemical staining for Ki67 and CD31 and TUNEL were carried out as described previously (10).
Western blot analysis
Whole cell protein lysates (10–15ug) were separated in 7.5% SDS/PAGE and transferred on nitrocellulose membrane as described previously (11). Immunoblotting was performed with mouse monoclonal anti-human ErbB2 antibodies (ab8054, Abcam) used at 1:2000 dilution in 5% non-fat milk in PBS with 0.05% Tween-20 overnight at 4° C. Goat anti-mouse HRP-conjugated antibodies were used as secondary at 1:5000 in the same buffer for 1 hour at room temperature. Signal was detected using ECL reagent (GE Healthcare, Pittsburgh, PA).
Image analysis
Tumors from the 10 day DRS experiment were analyzed using InForm image analysis software (10). InForm allows to perform learning-example automated image processing. 8–10 images were taken at x100 magnification with Nuance camera to cover all tissue area. Training was performed on 10–15 representative images. First tissue segmentation was performed using three categories (LNCaP, stroma, matrigel) with training at fine segmentation resolution level and small pattern scale. It was followed by nuclear cell segmentation in a chosen tissue category, and scoring with Double Positivity mode. After that batch analysis was performed on all available images using training algorithm, and data were merged in one file to analyze. Image analysis of anti-CD31 immunohistochemistry was performed as above except that anti-CD-31 stained area divided by the total area of the stromal compartment was calculated.
PCR arrays
RNAs from 19I cells with knockdown of Wnt10B or controls were used to analyze gene expression using an RT-profiler PCR array for human mesenchymal stem cells related genes from SABiosciences (SuperArray PAHS-082A) according to the manufacturer’s instructions. Confirmatory Q-RT-PCR of individual genes was carried out using primers and conditions shown in Supplementary Table 1
RESULTS
Tumorigenic potential of human prostate stromal cell lines
To evaluate the tumorigenic potential of three human stromal cell lines established from prostates from human organ donors (19I, 19B and 33B), we examined their ability to support LNCaP tumorigenesis in the differential reactive stroma model (7) using two-way DRS injections. In the two-way DRS model LNCaP prostate cancer cells and a prostate stromal cell line (DRS stromal cells) are mixed and injected subcutaneously into nude mice without Matrigel. As is well known, LNCaP cells alone are poorly tumorigenic and do not readily generate tumors subcutaneously in nude mice, as shown in Figure 1. In contrast, addition of Matrigel supports tumorigenesis by LNCaP cells in the subcutaneous environment. The three human prostate stromal cell lines supported tumorigenesis to variable extents, with 33B being the most poorly pro-tumorigenic (Fig 1). Of note, tumorigenesis was evaluated 10 days after injection, which is a more stringent test of tumorigenic potential in this model than a 28 day test since more weakly tumorigenic cell lines can result in detectable tumors over a longer time span (12).
Figure 1. Differential reactive stroma cell lines variably enhance LNCaP tumorigenesis in a 10-day DRS model.
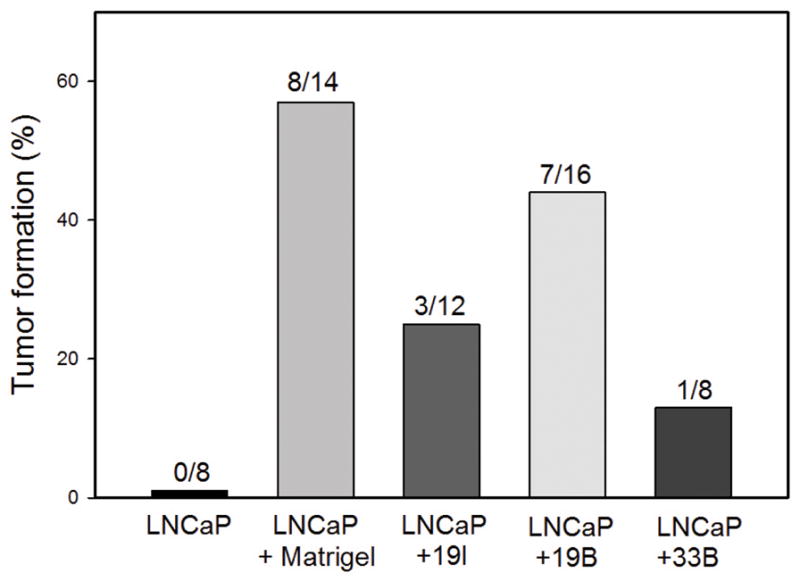
LNCaP cells were injected subcutaneously in nude mice alone, with Matrigel or with the indicated prostate stromal cell line. After 10 days the number of palpable tumors was scored. The percent tumor formation is shown and the number of injections evaluated is indicated over each bar.
Expression of reactive stromal genes by human prostate stromal cell lines
We next examined the expression of 10 different genes which we had previously demonstrated to be upregulated in human prostate cancer reactive stroma compared to benign stroma, based on both expression microarray’s and quantitative RT-PCR of laser captured stroma. We chose a variety of different types of genes to evaluate based on their potential pro-tumorigenic activity including growth factor receptors (c-Kit, ErbB2, TGFBR2), transcription factors (Gli2, FoxA1, Bmi1), axon guidance genes (Robo3), secreted growth factors (Wnt10b, FGF19) and genes encoding extracellular matrix (COMP). Expression was evaluated using semi-quantitative and/or quantitative RT-PCR (Q-RT-PCR) as shown in Figure 2A. In some cases, there was relatively invariant expression of mRNAs between cell lines, for example ErB2 and Bmi1 (Fig 2A and 2B). However, for most genes there was variable expression between different cell lines that in many cases was statistically significant when evaluated by quantitative RT-PCR (Fig 2B). Most of the RSG3 induced genes were expressed at easily detectable levels with the exception of FoxA1, which was only weakly detected in a single cell line (19I) and FGF19, which was not expressed (data not shown). Given that ErbB2 is potentially targetable in prostate cancer, we sought to confirm expression of this protein in DRS stromal cells by Western blotting. As can be seen in Supplementary Figure 1, ErbB2 protein is expressed in all three DRS stromal cell lines. Thus, all of the human stromal cell lines expressed multiple reactive stroma genes at variable but easily detectable levels.
Figure 2. Expression of reactive stroma genes in DRS cell lines.

A. RT-PCR of reactive stroma genes upregulated in human prostate cancer reactive stroma in DRS cell lines 19I, 19B and 33B. LNCaP was included as a positive control for FoxA1 since this gene was only weakly expressed in a single DRS cell line. The “X” indicates a skipped well in this gel. GAPDH was used as a positive control for mRNA amount and reverse transcription. B. Quantitative RT-PCR of selected reactive sroma genes in DRS cell lines. β-actin was used for copy number normalization. Expression is shown relative to 19I cells (100%). Mean +/− standard deviation of triplicate determinations of biological triplicates are shown. Significant differences in expression relative to 19I cells by t-test are indicated by asterisks (p=.04 Gli2 33B; p<.02 COMP; all others p<.001)
Functional analysis of reactive stroma genes
In order to evaluate the functional significance of the reactive stroma genes expressed in the human prostate stromal cell lines, we carried out stable knockdowns of five of these genes using lentiviral shRNAs followed by the evaluation of tumor formation in the DRS model. Our initial studies used a 28 day 3-way DRS model in 19I cells to evaluate the biological activities of c-Kit and Wnt10B. As can be seen in Figure 3, an ~ 80% decrease in Wnt10B mRNA led to a 50% decrease in tumor incidence and a greater than 80% decrease in tumor weight in tumors that were measurable. Similarly, a 60% knockdown of c-Kit resulted in a ~40% decrease in tumor incidence and, in the measurable tumors there was an 80% decrease in tumor weight. Thus knockdown of either of these genes resulted in significant inhibition of tumorigenesis.
Figure 3. Tumorigenesis in a 28-day DRS model is inhibited by knockdown of Wnt10B or c-Kit.

LNCaP cells were injected subcutaneously in nude mice with Matrigel and 19I DRS prostate stromal cells with shRNAs targeting Wnt10B (A) or c-Kit (B) or vector controls. Gene knockdown was confirmed by Q-RT-PCR prior to injection. After 28 days the number of palpable tumors was scored and palpable tumors were excised and weighed. All values are relative to vector controls and are expressed as mean +/− SEM, n=18 injections in a single experiment. Significant differences relative to 19I vector control cells are indicated by asterisks. For gene expression: p<.01, t-test. For tumor weight: p<.003, t-test. For tumor incidence: p=.01, Fisher exact test.
We then extended these studies to a 10 day 3-way DRS model using 19I cells after knockdown of gene expression using lentiviral shRNAs. Use of the 10 day model allows evaluation of earlier events involved in tumorigenesis. In these studies we evaluated cells with knockdown of Wnt10B, COMP, Gli2 or Bmi1 mRNA. We evaluated target gene expression by Q-RT-PCR prior to injection, which showed ~70–80% knockdown in all cases (Fig 4A). Tumorigenesis in a 10 day 3-way DRS model showed a significant decrease in tumor size in all the knockdown cell lines versus control 19I cells (Fig 4B). It should be noted that at the 10 day time point there is still a significant amount of Matrigel in the tumors (Fig 4C) since the cellular elements have not had as much time to grow and the matrigel has not been resorbed to the same degree as in 28 day tumors. Thus the absolute decrease in tumor weight is constrained by the presence of this injected material. To confirm continued knockdown of the targeted gene we performed immunohistochemistry to detect Bmi1 protein expression in tumors with knockdown of Bmi1 in the 19I cells and control tumors. As can be seen in Figure 4D, Bmi1 is expressed in a subset of spindle-shaped cells in the stroma. It should be noted that much of the stroma, even at this early time point consists of mouse stromal cells, including endothelial cells, as demonstrated previously by Alu in situ hybridization (7). In the tumors from mice with Bmi1 knockdown 19I cells there was a visible decrease in spindle-shaped cells in the stroma expressing Bmi1. The LNCaP cell also express Bmi1, as has been demonstrated previously (13), which acts as an internal positive control. We then carried out Inform image analysis to quantitate Bmi1 staining in the stroma. Using multispectral imaging the stromal and cancer cell compartments were identified by image analysis. All cell nuclei and Bmi1 stained nuclei were then quantiated in the stromal compartment. In control tumors 13.6 +/− 0.2% of stromal nuclei were positive versus 2.1+/− 0.1% in the knockdown tumors (mean +/− SEM). This difference was highly statistically significant (p<.005, t-test) thus confirming continued knockdown of Bmi1 in the stromal compartment in the tumors with Bmi1 knockdown in 19I cells. Thus we consistently found decreases in tumor promoting phenotypes in prostate stromal cells with decreased expression of genes induced in reactive stroma.
Figure 4. Inhibition of tumorigenesis by reactive stroma gene knockdown in a 10-day DRS model.

LNCaP cells were injected subcutaneously in nude mice with Matrigel and 19I DRS prostate stromal cells with shRNAs targeting Wnt10B, COMP, Gli2, Bmi1 or vector controls. A. Gene expression prior to injection by quantitative-RT-PCR. B. Tumor weight after 10 days. All values are relative to controls and are expressed as mean +/− SEM. Results represent two separate experiments with 12 injections in each experiment. Significant differences relative to control cells are indicated by asterisks. For gene expression: p<.001, t-test. For tumor weight: p<.001, t-test. C. Histology of 10 day DRS tumors from control and shBmi1 tumors. Residual matrigel is present (arrowheads) as are islands of LNCaP cells (arrows) and stromal cells and blood vessels (double arrows). Note the smaller and more sparse clusters LNCaP cells and decreased blood vessels in the shBmi1 tumors. D. Immunohistochemistry with anti-Bmi1 antibody. LNCaP cells (arrows) are positive as are a subset of stromal cells (half shaded arrows). Staining of stromal cells was visibly decreased in tumors with shBmi1 stromal cells and this was confirmed by image analysis. All images 200X magnification.
To determine the reason for the observed decrease tumor size when the reactive stroma genes were knocked down we carried out image analysis of tumors using Inform image analysis software. In all cases the number LNCaP cells, as determined by image analysis of random fields in the tumors with Inform software, was significantly decreased in tumors with target gene knockdown compared to controls (Fig 5A), with Bmi1 knockdown cells showing the most significant decrease in cancer cells per tumor. It should be noted that the decrease in LNCaP tumors cells is greater than the decrease in tumor weight (Fig 4B) since, particularly at this earlier time point, Matrigel accounts for a significant fraction of the tumor (Fig 4C) as described above. We then carried out image analysis to determine the percentage of proliferating LNCaP cells by Ki67 immunohistochemistry (Fig 5B) as well as the percentage of apoptotic cells by TUNEL analysis (Fig 5C). In tumors with Wnt10B knockdown stromal cells there was a significant increase in apoptosis without change in proliferation of LNCaP cells. The tumors from the COMP knockdown stromal cells showed a similar pattern, although the increase in apoptosis was not statistically significant (p=.06, t-test). Tumors using stromal cells with knockdown of Gli2 showed a significant decrease in proliferation and a marginal increase in apoptosis (p=.09, t-test). Tumors using stromal cells with knockdown of Bmi1 showed a significant decrease in the proliferative fraction of LNCaP cells as well as a marked increase in apoptotic LNCaP cells. These observations are consistent with decreased overall number of LNCaP cells in all cases, but the exact cause of the decrease in LNCaP cells is variable based on the target gene that is knocked down. In contrast, in all cases decreased angiogenesis was observed, as determined by quantitative analysis of anti-CD31 immunohistochemistry (Fig 5D).
Figure 5. Biological impact of stromal gene knockdown in DRS tumors.

Tumors from the 10-day DRS experiment with gene knockdown of the indicated stromal gene (or vector controls) were analyzed for: (A) number of LNCaP cells; (B) proliferation of LNCaP cells, by Ki67 IHC; (C) apoptosis in LNCaP cells, by TUNEL and (D) angiogenesis, by anti-CD-31 IHC. Values were determined using image analysis as described in Materials and Methods. All values are expressed as mean +/− SEM. Significant differences relative to tumors with control cells are indicated by asterisks and is all cases p<.005 by t-test.
Wnt family members have been implicated in mesenchymal stem cell and/or progenitor cell maintenance and function. Wnt10B is a relatively poorly characterized member of the Wnt family but recent studies have implicated it in human mesenchymal stem cell/progenitor cell function in adipose tissue and bone (14, 15). As described above, Wnt10B is upregulated in prostate cancer reactive stroma, is expressed in the prostate stromal cell lines and knockdown decreases tumorigenesis by increasing apoptosis in LNCaP cells and decreasing angiogenesis. We therefore sought to determine if knockdown of Wnt10B can impact expression of genes associated with mesenchymal stem/progenitor cell function. RNAs from 19I cells with knockdown of Wnt10B or controls were used to analyze gene expression of using an RT-profiler PCR array for 85 human mesenchymal stem cells related genes from SABiosciences. All of these genes are known to be involved in mesenchymal stem cell biology including genes involved in the maintenance of stemness, stem cell markers, differentiation markers and other stem cell related genes. A total of 74 genes showed detectable expression. Genes with low expression (Ct > 32) were excluded from further analysis, A total of 10 genes showed decreased expression (1.5 fold or greater) upon Wnt10B knockdown. These genes are shown in Table 1. No genes showed an increase of 1.5 fold or greater. Four of these genes (ABCB1, OCT4, BDNF, THY1) were analyzed by individual Q-RT-PCR and all showed 54–84% decrease in expression compared to controls (Fig 6), confirming the accuracy of the larger Q-RT-PCR array. Of particular note is the decrease in OCT4 expression, which is known to play a critical role in stem cell maintenance. LIF, which is also a critical regulator of stem cell function, was downregulated, as was THY1 (CD90), which is expressed on mesenchymal stem cells (as well as a variety of other cell types). These findings argue that Wnt10B plays a role in regulating expression of genes associated with mesenchymal stem cell biology in prostate stroma as it does in bone and adipose tissue. Several cytokines that are relevant to prostate cancer progression including VEGFA, BDNF and CSF2 were also down-regulated by Wnt10B knockdown as well.
Table 1.
RNAs from 19I stromal cells with knockdown of Wnt10B or vector controls were analyzed using a Q-RT-PCR array containing primers for 85 human mesenchymal stem cell related genes. A total of 10 genes showed decreased expression of 1.5-fold or more; none showed increased expression of a similar magnitude.
| Symbol | Fold change | Unigene ID | NCBI Ref Seq | Description |
|---|---|---|---|---|
| ABCB1 | 0.4234 | Hs.489033 | NM_000927 | ATP-binding cassette, sub-family B1 (MDR/TAP) |
| CSF2 | 0.4698 | Hs.1349 | NM_000758 | Colony stimulating factor 2 (granulocyte-macrophage) |
| OCT4 | 0.4863 | Hs.249184 | NM_002701 | POU class 5 homeobox 1 |
| BDNF | 0.5586 | Hs.502182 | NM_001709 | Brain-derived neurotrophic factor |
| VEGFA | 0.5586 | Hs.73793 | NM_003376 | Vascular endothelial growth factor A |
| KAT2B | 0.6199 | Hs.533055 | NM_003884 | K(lysine) acetyltransferase 2B |
| THY1 | 0.6199 | Hs.644697 | NM_006288 | Thy-1 cell surface antigen |
| ANPEP | 0.6417 | Hs.1239 | NM_001150 | Alanyl (membrane) aminopeptidase |
| LIF | 0.6417 | Hs.2250 | NM_002309 | Leukemia inhibitory factor |
| RUNX2 | 0.6643 | Hs.535845 | NM_004348 | Runt-related transcription factor 2 |
Figure 6. Decreased expression of mesenchymal stem cell associated genes in prostate stromal cells with knockdown of Wnt10B.

Individual Q-RT-PCR reactions were carried out for four mesenchymal stem cell related genes to confirm the results of the Q-RT-PCR array. Expression relative to vector controls is shown. All values are means of triplicates. Standard deviations were less than 2% and thus are not shown since they are not visible on the graph. Significant differences relative to control cells by t-test are indicated by asterisks (ABCB1, p<.001; OCT4, p=.024; BDNF, p<.001; THY1, p=.01).
DISCUSSION
Formation of prostate cancer reactive stroma is a complex, dynamic process that is characterized by activation of multiple cellular processes. Our current studies show that many genes upregulated in grade 3 reactive stroma can enhance prostate cancer tumor progression in vivo in the DRS xenograft model system. This is a crucial validation of their in vivo significance that strongly supports the relevance of our prior observational studies showing their upregulation in human prostate cancer stroma tissues. Conversely, our studies also indicate that the DRS model accurately mimics tumor–stromal interaction in human prostate cancer and can exploited for understanding the complex interactions of prostate cancer cells and the microenvironment.
Bmi1 is a transcription factor which is involved in maintenance of stem cells (16) and it is expressed in all three DRS stromal cell lines studied. When Bmi1 mRNA is knocked down, tumorigenesis is decreased significantly, indicating that Bmi1 can modulate key properties of stromal cells that promote tumorigenesis. The stromal cell lines used in the DRS model have a myofibroblastic phenotype but the expression of Bmi1 indicates they express some genes that are also expressed in mesenchymal stem/progenitor cells. This conclusion is reinforced by our finding that knockdown of Wnt10B, which plays an important role in mesenchymal progenitor function in bone and adipose tissue, decreases expression of stem/progenitor genes such as OCT4, LIF and CD90 (THY1). It should be noted that immunohistochemistry studies have identified Bmi1 expressing stromal cells in both normal prostate and prostate cancers, although there was no quantitation of the expression in normal versus cancer (17).
Wnt10B is a canonical Wnt and promotes prostate cancer tumorigenesis in the DRS modeI by decreasing apoptosis in LNCaP cells and increasing angiogenesis. In part, this may be due to the autocrine promotion of expression of stem cell associated genes as described above. This autocrine stimulation also increases expression of several cytokines. BDNF is a nerve growth factor which can promote axongenesis/neurogenesis, which has been linked to prostate cancer progression by recent clinical and biological studies (18–20). It also enhances VEGFA expression in an autocrine manner, which may explain in part the observed decrease in angiogenesis when Wnt10B is knocked down given that VEGFA is a potent angiogenic factor. In addition, it is likely that Wnts act in a paracrine manner to directly promote the growth of LNCaP cells by the activation of canonical Wnt signaling, since it has been shown that LNCaP cells can respond to paracrine Wnts (21).
Cartilage oligomeric matrix protein (COMP) is an extracellular matrix protein that is overexpressed in prostate cancer reactive stroma based on our prior studies (6) and those of other groups (22). Our prior bioinformatics analysis showed that COMP is also overexpressed in breast cancer reactive stroma (6) which has been confirmed in an independent analysis (23). A recently published study confirmed the expression of COMP at the protein level in prostate cancer tissues and also showed that COMP was increased in the serum of patients with advanced prostate cancer(24). Our functional studies reveal for the first time that COMP can promote prostate cancer tumor growth. Further studies are needed to determine the mechanism by which COMP enhances tumor growth. Of note, COMP is induced by TGF-β in prostate stromal cells (25). Previous studies from our group have identified connective tissue growth factor (CTGF) as another TGF-β induced gene that can promote tumor progression in the DRS model system (26). The finding that COMP also promotes tumor progression argues for an important role for TGF-β induced proteins expressed in stroma in promoting tumor progression in prostate cancer.
c-Kit is a transmembrane tyrosine kinase receptor that is activated by binding to Kit ligand (KL). Our studies indicate that c-Kit is expressed in 2 of 3 DRS stromal cell lines studied and when knocked down tumor growth is decreased. Previous studies by Simak et al (27) have shown that c-Kit is expressed in cultured prostate stromal cells. The same group showed that KL protein was expressed in normal prostate stromal cells as well as approximately 40% of prostate cancers. Thus there is abundant KL present in prostate cancers from stromal cells or from cancer cells which can activate c-Kit. Our group(6) and others (28) have shown expression of c-Kit is prostate cancer stroma by immunohistochemistry. Of note, some stem/progenitor cells, such as cardiac stem/progenitor cells, express c-Kit (29) but it seems unlikely that c-KIT is linked to expression of stem cell/progenitor genes in the DRS cell lines since it is not expressed in one of the cell lines which expresses Bmi1.
Gli2 is a nuclear transcription factor which is a key downstream target of canonical hedgehog signaling. The Bushman group has shown that hedgehog signaling promotes prostate cancer tumor growth via the activation of hedgehog pathway in myofibroblasts, with no evidence of autocrine stimulation of prostate cancer cells by hedgehog ligands (30, 31). Of note, they show that activation of hedgehog signaling only occurs in prostate cancer tumors with a reactive stroma phenotype (31). Our current studies show directly that Gli2 enhances tumor progression in a tissue recombination model when expressed in the myofibroblastic cells. It should be noted Gli2 transcription can be driven both by hedgehog ligands or noncanonical pathways such as TGF-β (32) and both of these pathways may be potentially active Gli2 transcription in prostate cancer in vivo in different contexts.
An interesting aspect of the DRS stromal cells is their heterogeneous expression of various genes in the different cell lines, even in cell lines isolated from the same organ donor (19I and 19B). Bmi1 is the strongly expressed in all 3 cell lines and knockdown of this gene has the most profound effect on tumorigenesis so it is highly likely that this gene has an important role in promoting tumorigenesis by stromal cells. However, other genes (c-Kit, Wnt10B, COMP etc) are expressed at variable levels and these genes also impact tumorigenesis. Thus the pro-tumorigenic factors are variable between different cell lines and multiple factors contribute to the overall tumorigenic activity. Ultimately it will be useful to examine the impact of gene knockdowns, singly and in combination, in multiple DRS stromal lines other than 19I to define the relative importance of various genes in tumorigenesis.
The reason the various reactive stroma genes are expressed at variable levels in various cell lines is unclear and requires further investigation. However, such heterogeneity of gene expression, in particular TGFBR2, has been documented in carcinoma associated fibroblasts and to a lesser extent in benign stromal tissues by Li et al (21), so the variable expression in cell lines reflects actual in vivo heterogeneity. Work from the Hayward and Bhowmick groups has shown that stromal cell heterogeneity itself may induce paracrine interactions that can promote tumor progression (33). It will be of interest to examine whether mixing various DRS cell lines can promote tumorigenesis in a similar manner.
Our current studies reveal that a key set of genes expressed in reactive stroma can promote tumor progression in vivo. Such activities are potential cancer therapy targets. Targeting the tumor microenvironment is attractive as a therapeutic strategy since the reactive stromal cells are more genomically stable than cancer cells. In addition, when using therapies targeting activation of similar pathways in cancer cells, a portion of therapeutic benefits seen may be due to stromal effects in the tumor microenvironment, which must be accounted for when interpreting results of trials with such agents.
Supplementary Material
STATEMENT OF TRANSLATIONAL RELEVANCE.
The presence of reactive stroma has been shown to be associated with adverse outcome in prostate cancer. Previous expression microarray studies comparing laser captured reactive stroma and benign stroma identified numerous upregulated genes in cancer reactive stroma associated with a variety of biological processes including stem cell maintenance, axonogenesis/neurogenesis, angiogenesis and alterations of extracellular matrix. We now show that most of the reactive stroma genes tested are expressed in prostate stromal cell lines, and when knocked down in the stromal cells, tumorigenesis is decreased in a tissue recombination model of prostate cancer. These studies validate the role of these upregulated genes in enhancing cancer progression in vivo and identify novel stromal targets for therapy of prostate cancer.
Acknowledgments
The technical assistance of Billie Smith of the Human Tissue Acquisition and Pathology Core of the Dan L. Duncan Cancer Center is gratefully acknowledged.
GRANT SUPPORT. This work was supported by grants from National Cancer Institute to the Tumor Microenvironment Network (1U54CA126568, DR), the P30 Cancer Center support grant (P30 CA125123) to support the Human Tissue Acquisition and Pathology Core, the Dept of Veterans Affairs Merit Review program (MI) and by the use of the facilities of the Michael E. DeBakey VAMC.
Footnotes
Conflicts of Interest: The authors have no conflicts of interest to declare.
References
- 1.Tuxhorn JA, Ayala GE, Rowley DR. Reactive stroma in prostate cancer progression. J Urol. 2001;166:2472–83. [PubMed] [Google Scholar]
- 2.Chung LW, Baseman A, Assikis V, Zhau HE. Molecular insights into prostate cancer progression: the missing link of tumor microenvironment. J Urol. 2005;173:10–20. doi: 10.1097/01.ju.0000141582.15218.10. [DOI] [PubMed] [Google Scholar]
- 3.Ayala G, Tuxhorn JA, Wheeler TM, Frolov A, Scardino PT, Ohori M, et al. Reactive stroma as a predictor of biochemical-free recurrence in prostate cancer. Clin Cancer Res. 2003;9:4792–801. [PubMed] [Google Scholar]
- 4.Yanagisawa N, Li R, Rowley D, Liu H, Kadmon D, Miles BJ, et al. Reprint of: Stromogenic prostatic carcinoma pattern (carcinomas with reactive stromal grade 3) in needle biopsies predicts biochemical recurrence-free survival in patients after radical prostatectomy. Hum Pathol. 2008;39:282–91. doi: 10.1016/j.humpath.2007.04.025. [DOI] [PubMed] [Google Scholar]
- 5.Ayala GE, Muezzinoglu B, Hammerich KH, Frolov A, Liu H, Scardino PT, et al. Determining prostate cancer-specific death through quantification of stromogenic carcinoma area in prostatectomy specimens. Am J Pathol. 2011;178:79–87. doi: 10.1016/j.ajpath.2010.09.042. [DOI] [PMC free article] [PubMed] [Google Scholar]
- 6.Dakhova O, Ozen M, Creighton CJ, Li R, Ayala G, Rowley D, et al. Global gene expression analysis of reactive stroma in prostate cancer. Clin Cancer Res. 2009;15:3979–89. doi: 10.1158/1078-0432.CCR-08-1899. [DOI] [PMC free article] [PubMed] [Google Scholar]
- 7.Tuxhorn JA, McAlhany SJ, Dang TD, Ayala GE, Rowley DR. Stromal cells promote angiogenesis and growth of human prostate tumors in a differential reactive stroma (DRS) xenograft model. Cancer Res. 2002;62:3298–307. [PubMed] [Google Scholar]
- 8.Schauer IG, Ressler SJ, Tuxhorn JA, Dang TD, Rowley DR. Elevated epithelial expression of interleukin-8 correlates with myofibroblast reactive stroma in benign prostatic hyperplasia. Urology. 2008;72:205–13. doi: 10.1016/j.urology.2007.11.083. [DOI] [PMC free article] [PubMed] [Google Scholar]
- 9.Yu W, Feng S, Dakhova O, Creighton CJ, Cai Y, Wang J, et al. FGFR-4 Arg(3)(8)(8) enhances prostate cancer progression via extracellular signal-related kinase and serum response factor signaling. Clin Cancer Res. 2011;17:4355–66. doi: 10.1158/1078-0432.CCR-10-2858. [DOI] [PMC free article] [PubMed] [Google Scholar]
- 10.Shao L, Tekedereli I, Wang J, Yuca E, Tsang S, Sood A, et al. Highly specific targeting of the TMPRSS2/ERG fusion gene using liposomal nanovectors. Clinical cancer research : an official journal of the American Association for Cancer Research. 2012;18:6648–57. doi: 10.1158/1078-0432.CCR-12-2715. [DOI] [PMC free article] [PubMed] [Google Scholar]
- 11.Feng S, Shao L, Yu W, Gavine P, Ittmann M. Targeting fibroblast growth factor receptor signaling inhibits prostate cancer progression. Clinical cancer research : an official journal of the American Association for Cancer Research. 2012;18:3880–8. doi: 10.1158/1078-0432.CCR-11-3214. [DOI] [PMC free article] [PubMed] [Google Scholar]
- 12.Tuxhorn JA, Ayala GE, Smith MJ, Smith VC, Dang TD, Rowley DR. Reactive stroma in human prostate cancer: induction of myofibroblast phenotype and extracellular matrix remodeling. Clin Cancer Res. 2002;8:2912–23. [PubMed] [Google Scholar]
- 13.Crea F, Duhagon Serrat MA, Hurt EM, Thomas SB, Danesi R, Farrar WL. BMI1 silencing enhances docetaxel activity and impairs antioxidant response in prostate cancer. International journal of cancer Journal international du cancer. 2011;128:1946–54. doi: 10.1002/ijc.25522. [DOI] [PMC free article] [PubMed] [Google Scholar]
- 14.Stevens JR, Miranda-Carboni GA, Singer MA, Brugger SM, Lyons KM, Lane TF. Wnt10b deficiency results in age-dependent loss of bone mass and progressive reduction of mesenchymal progenitor cells. J Bone Miner Res. 2010;25:2138–47. doi: 10.1002/jbmr.118. [DOI] [PMC free article] [PubMed] [Google Scholar]
- 15.Cawthorn WP, Bree AJ, Yao Y, Du B, Hemati N, Martinez-Santibanez G, et al. Wnt6, Wnt10a and Wnt10b inhibit adipogenesis and stimulate osteoblastogenesis through a beta-catenin-dependent mechanism. Bone. 2012;50:477–89. doi: 10.1016/j.bone.2011.08.010. [DOI] [PMC free article] [PubMed] [Google Scholar]
- 16.Siddique HR, Saleem M. Role of BMI1, a stem cell factor, in cancer recurrence and chemoresistance: preclinical and clinical evidences. Stem Cells. 2012;30:372–8. doi: 10.1002/stem.1035. [DOI] [PubMed] [Google Scholar]
- 17.van Leenders GJ, Dukers D, Hessels D, van den Kieboom SW, Hulsbergen CA, Witjes JA, et al. Polycomb-group oncogenes EZH2, BMI1, and RING1 are overexpressed in prostate cancer with adverse pathologic and clinical features. European urology. 2007;52:455–63. doi: 10.1016/j.eururo.2006.11.020. [DOI] [PubMed] [Google Scholar]
- 18.Ayala GE, Dai H, Ittmann M, Li R, Powell M, Frolov A, et al. Growth and survival mechanisms associated with perineural invasion in prostate cancer. Cancer Res. 2004;64:6082–90. doi: 10.1158/0008-5472.CAN-04-0838. [DOI] [PubMed] [Google Scholar]
- 19.Ayala GE, Dai H, Powell M, Li R, Ding Y, Wheeler TM, et al. Cancer-related axonogenesis and neurogenesis in prostate cancer. Clin Cancer Res. 2008;14:7593–603. doi: 10.1158/1078-0432.CCR-08-1164. [DOI] [PubMed] [Google Scholar]
- 20.Magnon C, Hall SJ, Lin J, Xue X, Gerber L, Freedland SJ, et al. Autonomic nerve development contributes to prostate cancer progression. Science. 2013;341:1236361. doi: 10.1126/science.1236361. [DOI] [PubMed] [Google Scholar]
- 21.Li X, Placencio V, Iturregui JM, Uwamariya C, Sharif-Afshar AR, Koyama T, et al. Prostate tumor progression is mediated by a paracrine TGF-beta/Wnt3a signaling axis. Oncogene. 2008;27:7118–30. doi: 10.1038/onc.2008.293. [DOI] [PMC free article] [PubMed] [Google Scholar]
- 22.Richardson AM, Woodson K, Wang Y, Rodriguez-Canales J, Erickson HS, Tangrea MA, et al. Global expression analysis of prostate cancer-associated stroma and epithelia. Diagnostic molecular pathology : the American journal of surgical pathology, part B. 2007;16:189–97. doi: 10.1097/PDM.0b013e3180de20ac. [DOI] [PubMed] [Google Scholar]
- 23.Kim C, Choi J, Park H, Park Y, Park J, Park T, et al. Global analysis of microarray data reveals intrinsic properties in gene expression and tissue selectivity. Bioinformatics. 2010;26:1723–30. doi: 10.1093/bioinformatics/btq279. [DOI] [PubMed] [Google Scholar]
- 24.Klee EW, Bondar OP, Goodmanson MK, Dyer RB, Erdogan S, Bergstralh EJ, et al. Candidate serum biomarkers for prostate adenocarcinoma identified by mRNA differences in prostate tissue and verified with protein measurements in tissue and blood. Clinical chemistry. 2012;58:599–609. doi: 10.1373/clinchem.2011.171637. [DOI] [PMC free article] [PubMed] [Google Scholar]
- 25.Untergasser G, Gander R, Lilg C, Lepperdinger G, Plas E, Berger P. Profiling molecular targets of TGF-beta1 in prostate fibroblast-to-myofibroblast transdifferentiation. Mechanisms of ageing and development. 2005;126:59–69. doi: 10.1016/j.mad.2004.09.023. [DOI] [PubMed] [Google Scholar]
- 26.Yang F, Tuxhorn JA, Ressler SJ, McAlhany SJ, Dang TD, Rowley DR. Stromal expression of connective tissue growth factor promotes angiogenesis and prostate cancer tumorigenesis. Cancer Res. 2005;65:8887–95. doi: 10.1158/0008-5472.CAN-05-1702. [DOI] [PubMed] [Google Scholar]
- 27.Simak R, Capodieci P, Cohen DW, Fair WR, Scher H, Melamed J, et al. Expression of c-kit and kit-ligand in benign and malignant prostatic tissues. Histology and histopathology. 2000;15:365–74. doi: 10.14670/HH-15.365. [DOI] [PubMed] [Google Scholar]
- 28.Feng S, Dakhova O, Creighton CJ, Ittmann M. Endocrine fibroblast growth factor FGF19 promotes prostate cancer progression. Cancer research. 2013;73:2551–62. doi: 10.1158/0008-5472.CAN-12-4108. [DOI] [PMC free article] [PubMed] [Google Scholar]
- 29.Hou X, Appleby N, Fuentes T, Longo LD, Bailey LL, Hasaniya N, et al. Isolation, Characterization, and Spatial Distribution of Cardiac Progenitor Cells in the Sheep Heart. J Clin Exp Cardiolog. 2012:S6. [PMC free article] [PubMed] [Google Scholar]
- 30.Zhang J, Lipinski R, Shaw A, Gipp J, Bushman W. Lack of demonstrable autocrine hedgehog signaling in human prostate cancer cell lines. The Journal of urology. 2007;177:1179–85. doi: 10.1016/j.juro.2006.10.032. [DOI] [PubMed] [Google Scholar]
- 31.Shaw A, Gipp J, Bushman W. The Sonic Hedgehog pathway stimulates prostate tumor growth by paracrine signaling and recapitulates embryonic gene expression in tumor myofibroblasts. Oncogene. 2009;28:4480–90. doi: 10.1038/onc.2009.294. [DOI] [PMC free article] [PubMed] [Google Scholar]
- 32.Lauth M, Toftgard R. Non-canonical activation of GLI transcription factors: implications for targeted anti-cancer therapy. Cell Cycle. 2007;6:2458–63. doi: 10.4161/cc.6.20.4808. [DOI] [PubMed] [Google Scholar]
- 33.Franco OE, Jiang M, Strand DW, Peacock J, Fernandez S, Jackson RS, 2nd, et al. Altered TGF-beta signaling in a subpopulation of human stromal cells promotes prostatic carcinogenesis. Cancer research. 2011;71:1272–81. doi: 10.1158/0008-5472.CAN-10-3142. [DOI] [PMC free article] [PubMed] [Google Scholar]
Associated Data
This section collects any data citations, data availability statements, or supplementary materials included in this article.